Copyright
©The Author(s) 2024.
World J Gastroenterol. Jan 28, 2024; 30(4): 367-380
Published online Jan 28, 2024. doi: 10.3748/wjg.v30.i4.367
Published online Jan 28, 2024. doi: 10.3748/wjg.v30.i4.367
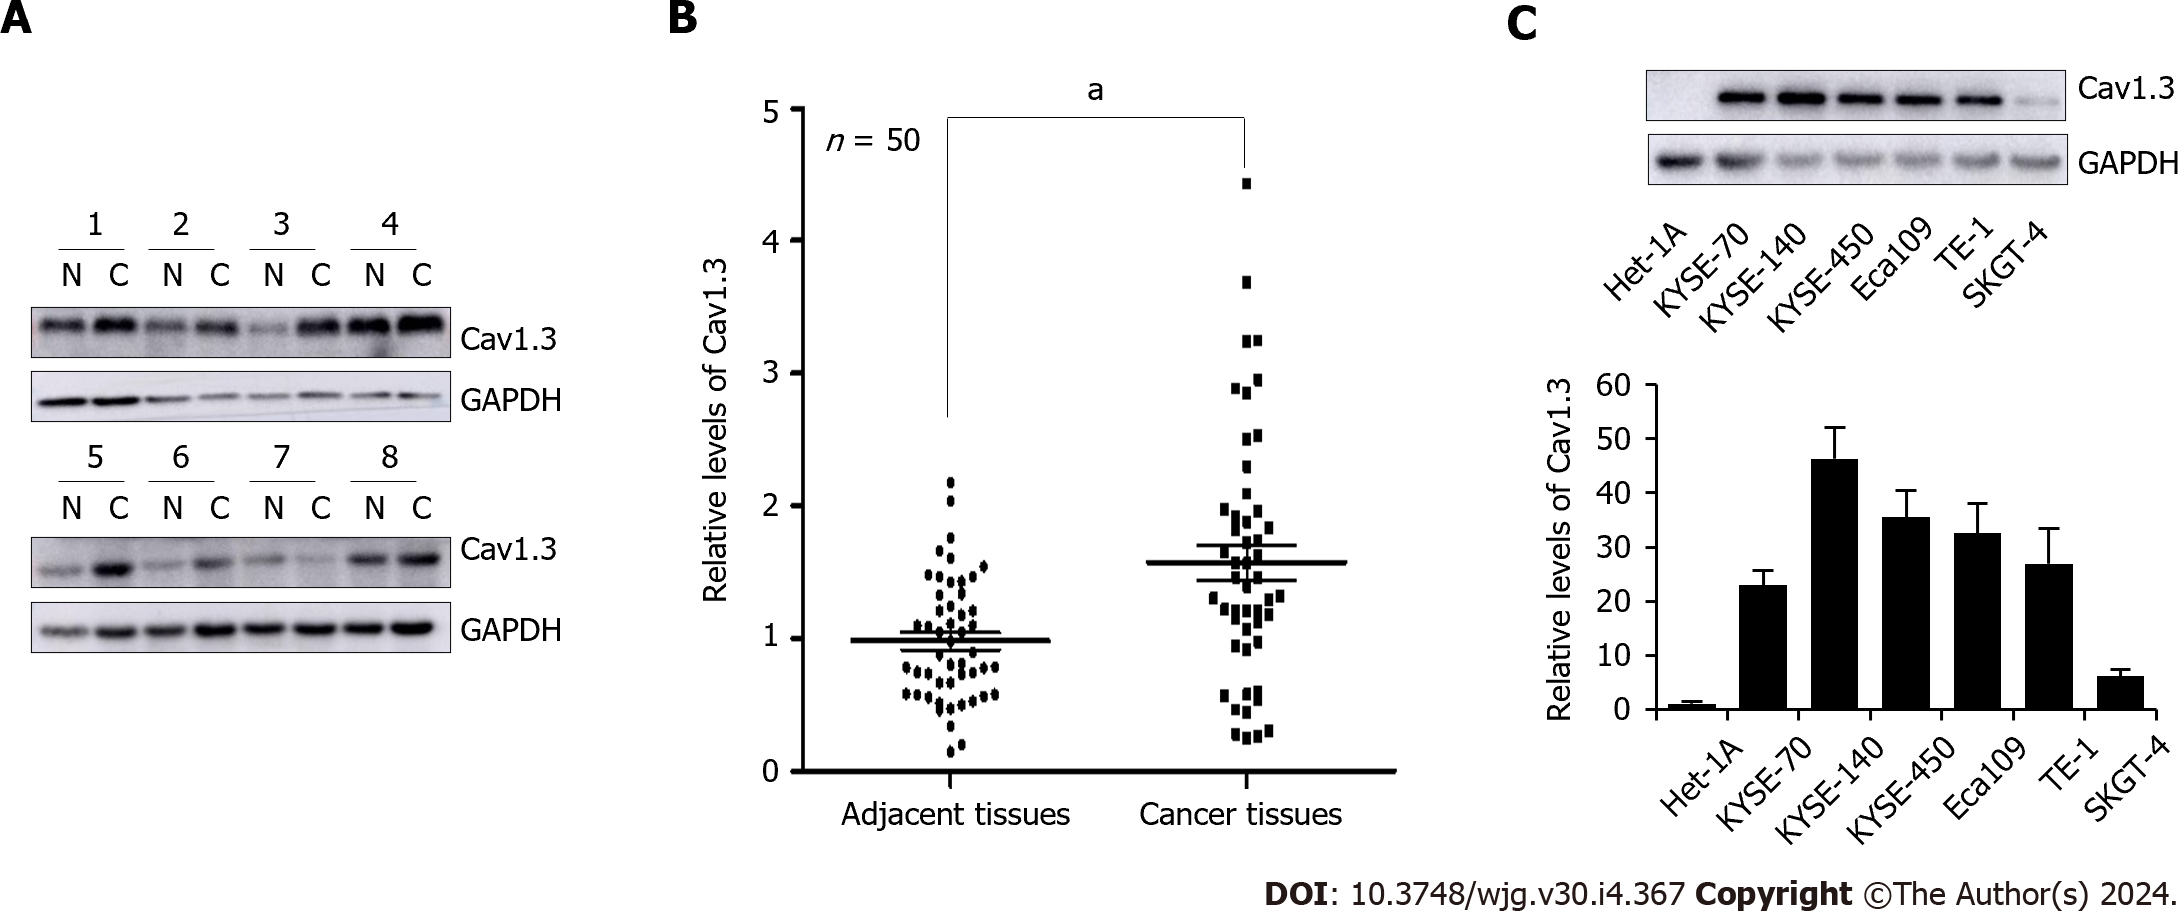
Figure 1 Levels of Cav1.
3 expression in esophageal cancer cell tissues. A: Representative detection of Cav1.3 level in esophageal squamous cell carcinoma (ESCC) by Western blot, N means adjacent tissues and C means cancer tissues; B: Statistical analysis of 50 cases of esophageal squamous cell carcinoma showed that level of Cav1.3 in ESCC tumor tissue was 1.60 times higher than that in adjacent tissue. aP < 0.05 vs the adjacent tissues; C: Western blot detection showed that the level of Cav1.3 in ESCC cells KYSE-70, KYSE-140, KYSE-450, Eca109, TE-1, and esophageal adenocarcinoma cell SKGT-4 was higher than that in esophageal squamous cell Het-1A.
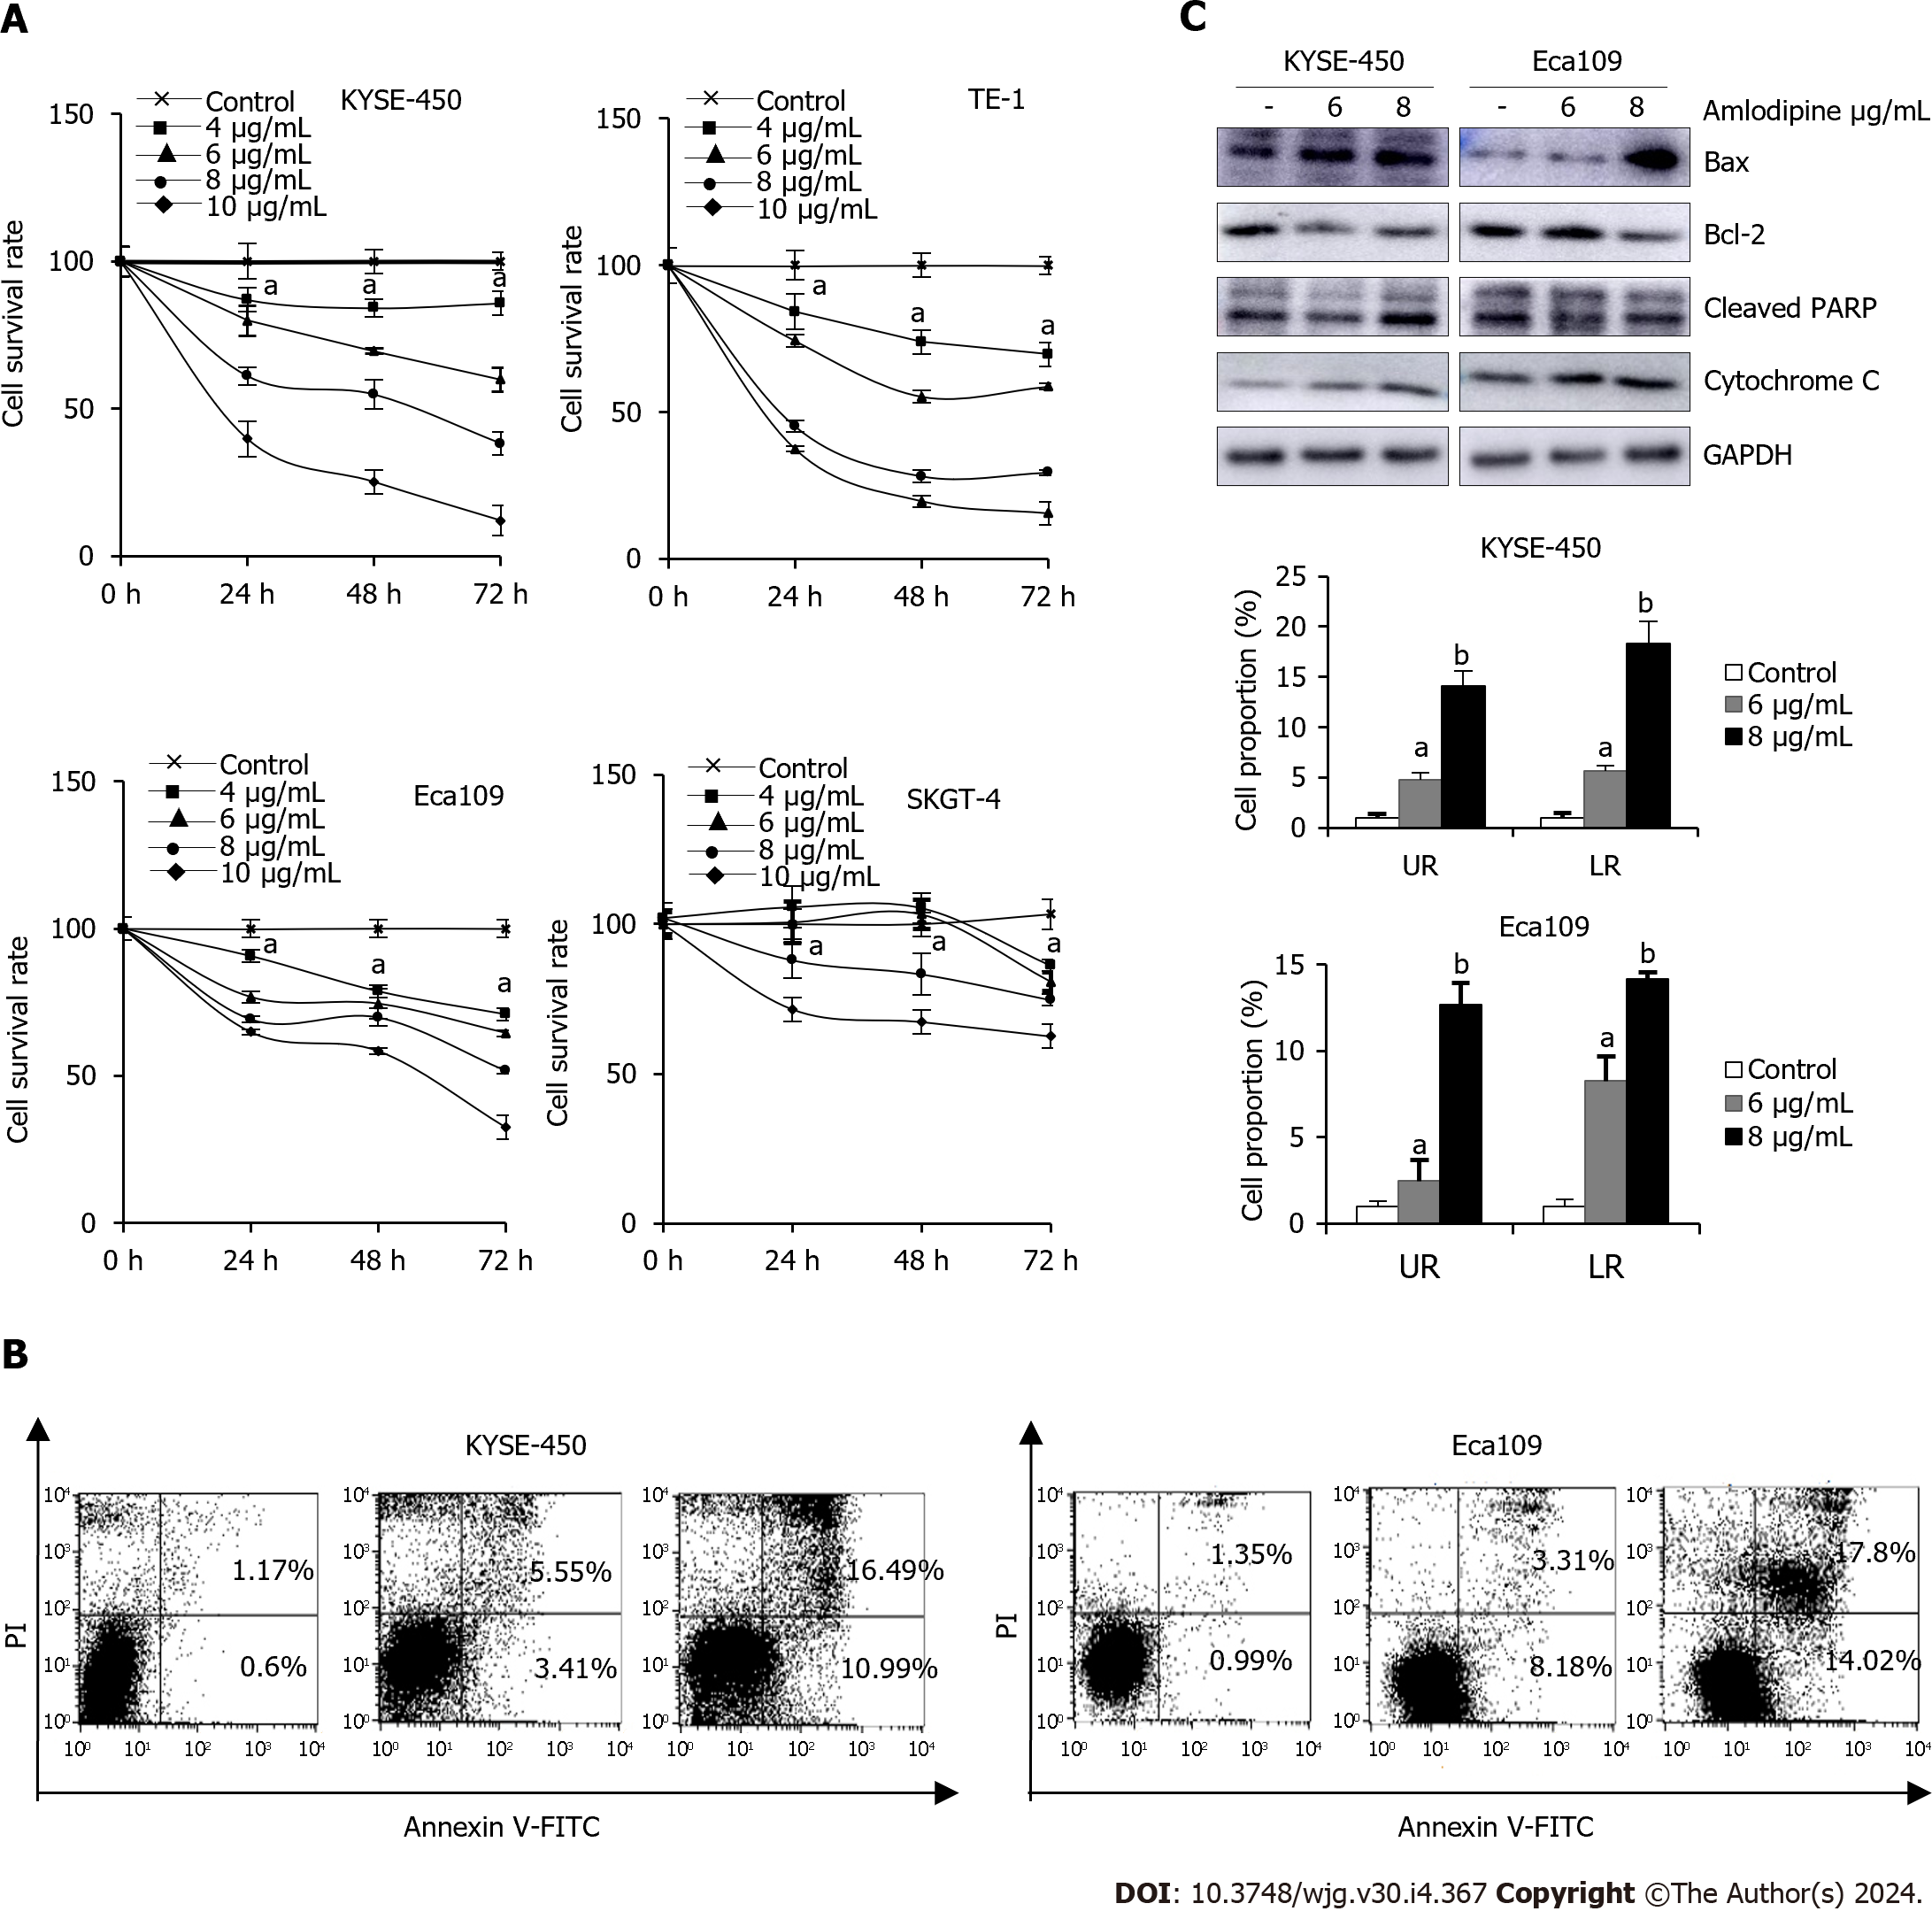
Figure 2 Amlodipine suppressed esophageal carcinoma cell growth through mitochondria-mediated apoptosis.
A: For human esophageal cancer cells, treatment with different concentrations of amlodipine solution at 4-10 μg/mL, increasing by 2 μg/mL, was performed. Cell viability was measured using the 3-(4,5-dimethyl-2-thiazolyl)-2,5-diphenyl tetrazolium bromide (MTT) assay to observe the state of cells after treatment for one, two, and three days aP < 0.05 vs Control; B: KYSE-450 and Eca109 cells were exposed to amlodipine at a concentration of either 6 or 8 μg/mL for 48 h, following which the percentage of apoptotic cells was measured using flow cytometry or propidium iodide staining aP < 0.05 vs Control, bP < 0.01 vs Control; C: In addition, after two days of treatment with amlodipine, changes in the levels of various apoptosis-related proteins including Bcl-2, Bax, cleaved PARP, and cytochrome C were detected using Western blotting techniques. UR: Upper right quadrant LR: Lower right quadrant.
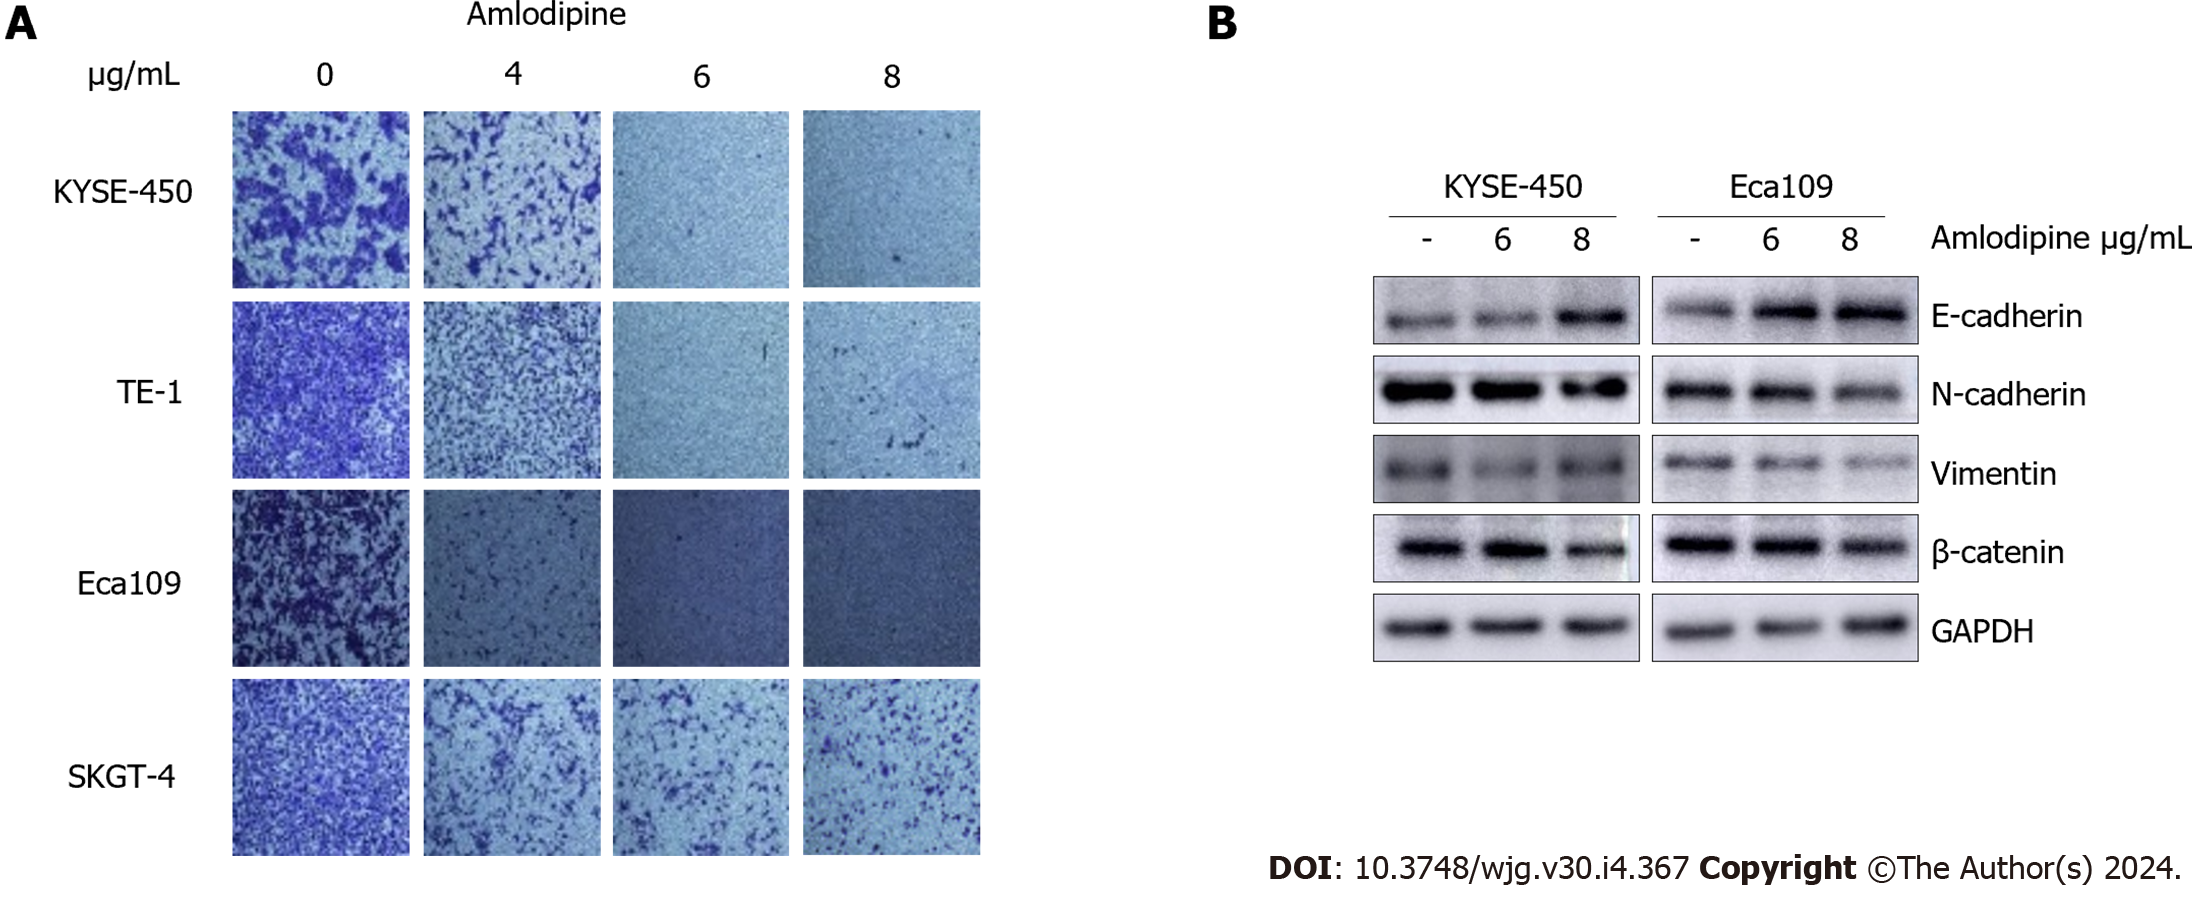
Figure 3 Amlodipine inhibited esophageal carcinoma cells migration by restraining epithelial-mesenchymal transition.
A: Human esophageal carcinoma cells (KYSE-450, TE-1, Eca109, and SKGT-4) were treated with increasing doses of amlodipine (4 μg/mL, 6 μg/mL, and 8 μg/mL) and assessed cell migration at 24 h via Transwell migration assay; B: The Western blot results clearly showed the percentage of mesenchymal marker N-cadherin, epithelial marker E-cadherin, and β-catenin protein in KYSE-450 and Eca109 cells after treatment with amlodipine.
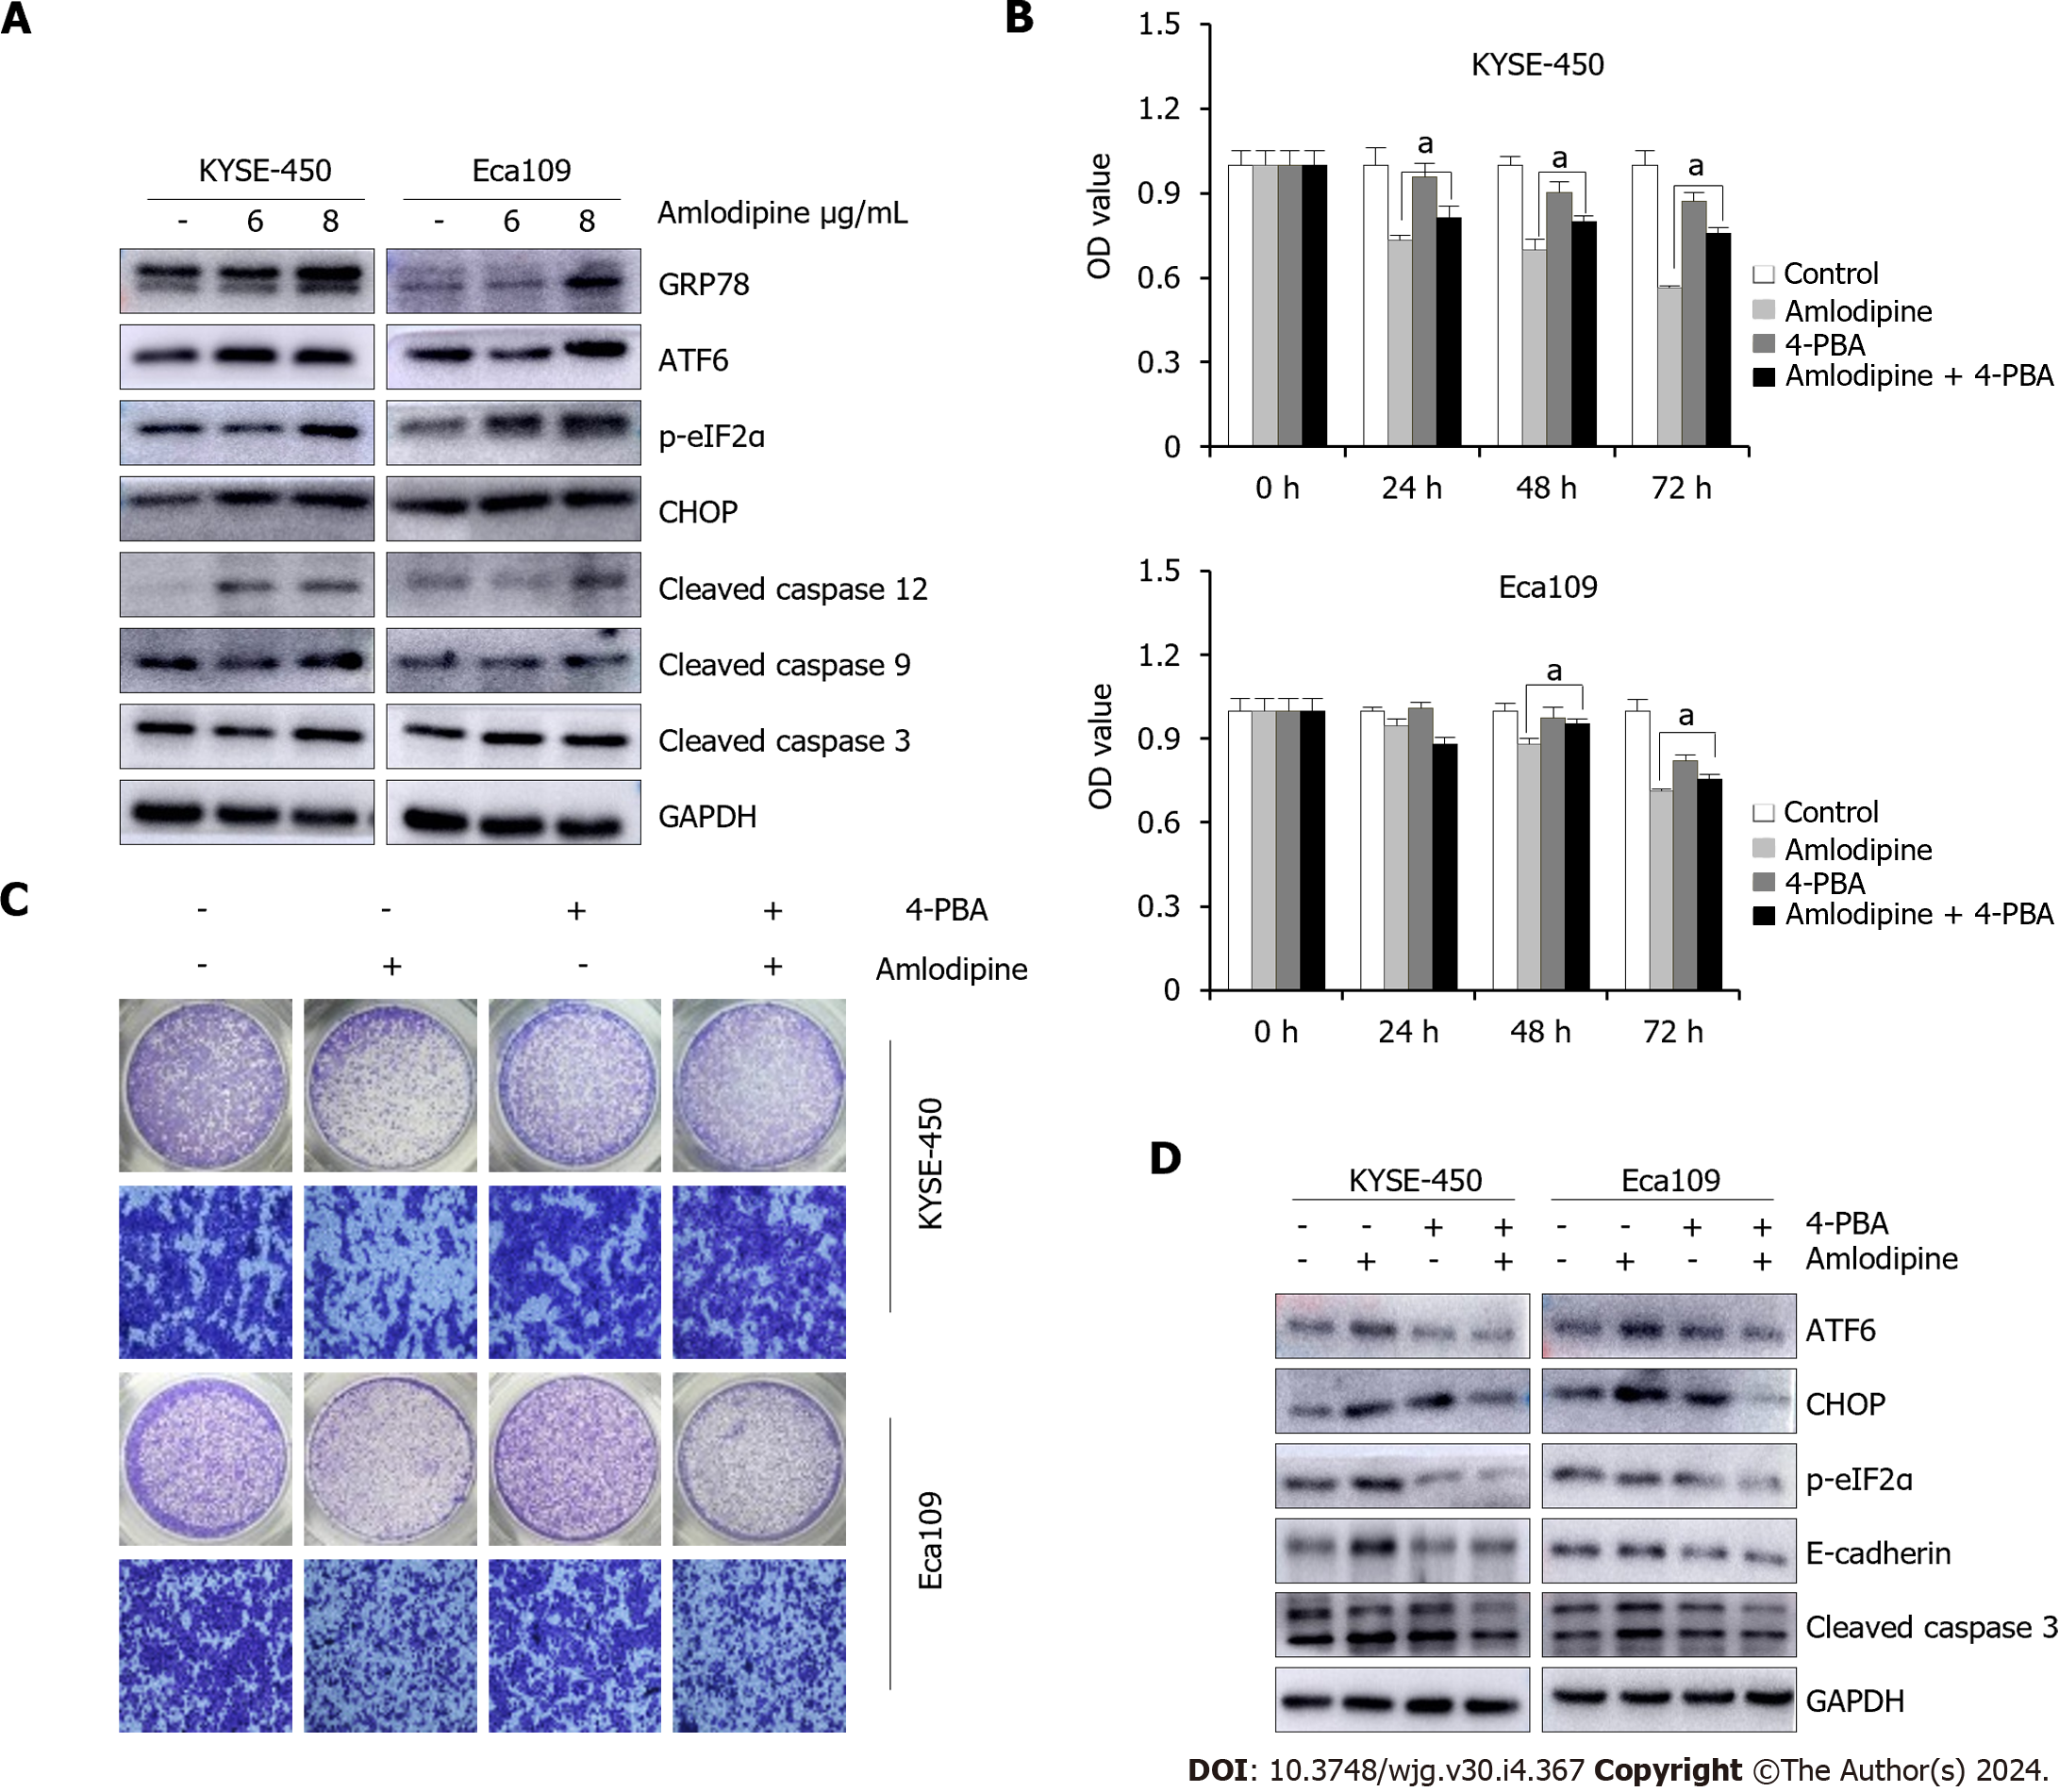
Figure 4 Amlodipine repressed esophageal carcinoma proliferation and migration via induction of endoplasmic reticulum stress.
A: KYSE-450 and Eca109 cells were treated with amlodipine at different concentrations for two days. According to the Western blot results, the protein levels of CHOP, p-eIF2α, GRP78, cleaved caspase-12, ATF6, cleaved caspase-9, and cleaved caspase-3 could be observed; B: With a concentration of 4 μg/mL amlodipine drug, 0.2 μM of 4-phenylbutyric acid (4-PBA), mixed treatment, then placed into KYSE-450 and Eca109 cells, with the help of 3-(4,5-dimethyl-2-thiazolyl)-2,5-diphenyl tetrazolium bromide (MTT) assay to test the cell activity presented by these cells in 1 d to 3 d aP < 0.05 vs amlodipine; C: Transwell migration assay was conducted to examine cell migration of KYSE-450 and Eca109 when treatment with amlodipine (4 μg/mL), 4-PBA (0.2 μM) or both combination for 24 h; D: Western blot analysis showed the levels of ATF6, CHOP, p-eIF2α, E-cadherin, and cleaved caspase-3 in KYSE-450 and Eca109 cells after treatment with amlodipine (4 μg/mL), 4-PBA (0.2 μM) or both combination for 48 h. All amlodipine and 4-PBA combination treatment was applying 4-PBA in advance for 1 h then amlodipine.
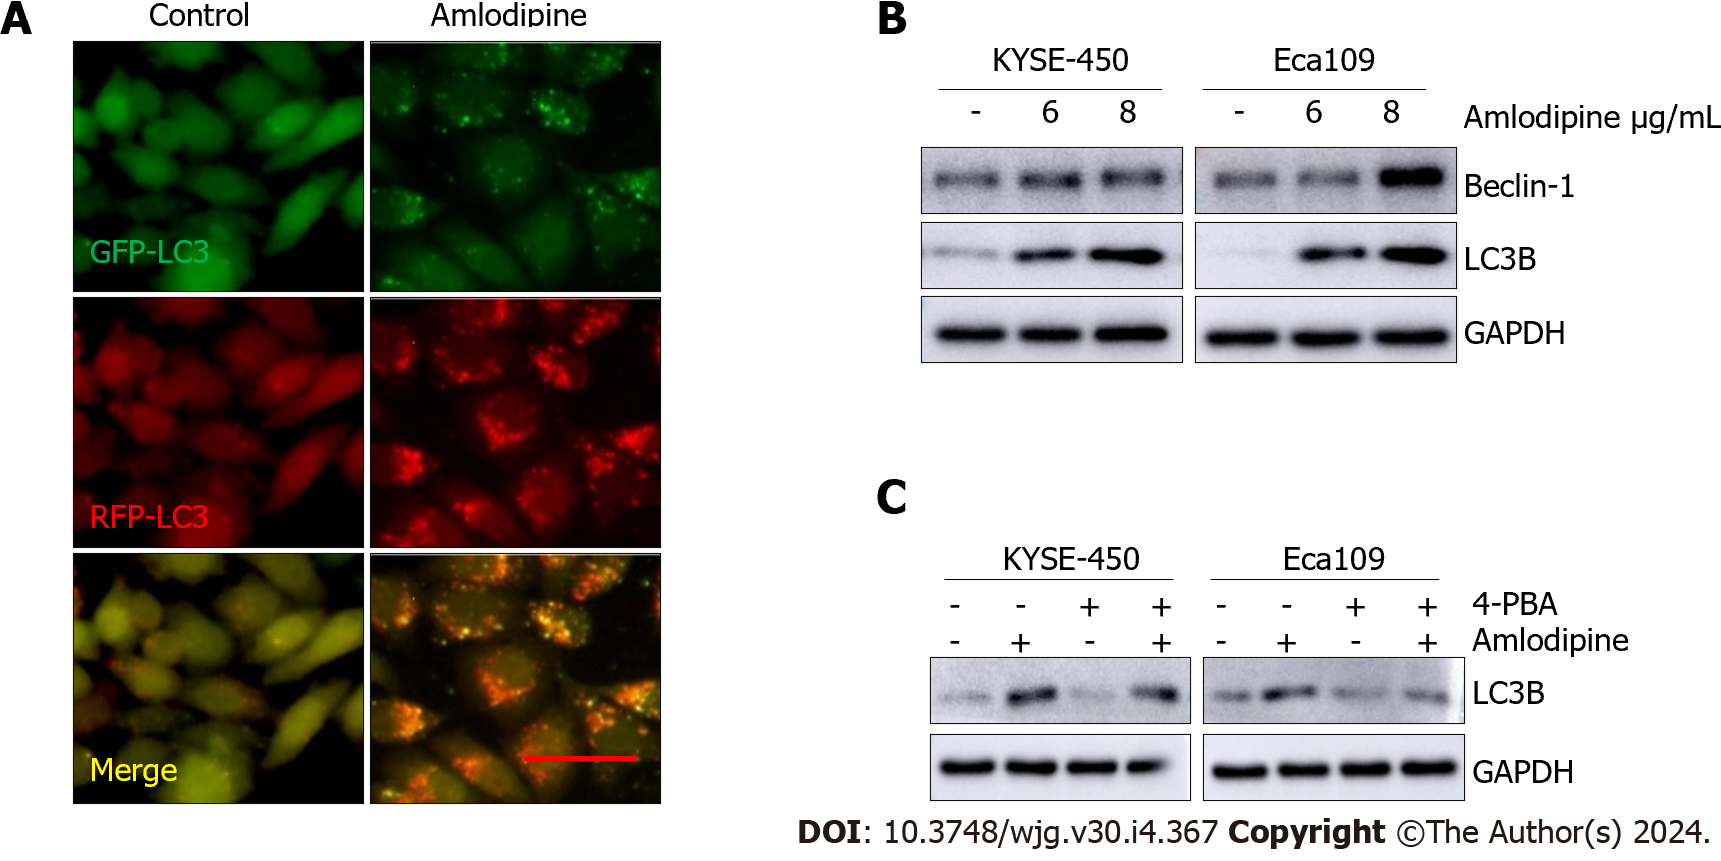
Figure 5 Amlodipine induced autophagy in esophageal carcinoma cells.
A: Eca109 cells after transient infection with GFP-RFP-LC3 virus were treated with vehicle control PBS or amlodipine (6 μg/mL) for 24 h and representative fluorescence images were captured. Bar = 20 μm; B: Protein trajectory results were measured using PBS or different concentrations of amlodipine, and the levels of beclin-1 and light chain 3 B (LC3B) in KYSE-450 and Eca109 cells after two days of treatment were detected; C: Western blot analysis revealed the level of LC3B in KYSE-450 and Eca109 after 48 h treatment with amlodipine (4 μg/mL), 4-phenylbutyric acid (4-PBA) (0.2 μM) or both combination (applying 4-PBA in advance for 1 h then amlodipine). GAPDH served as a loading control.
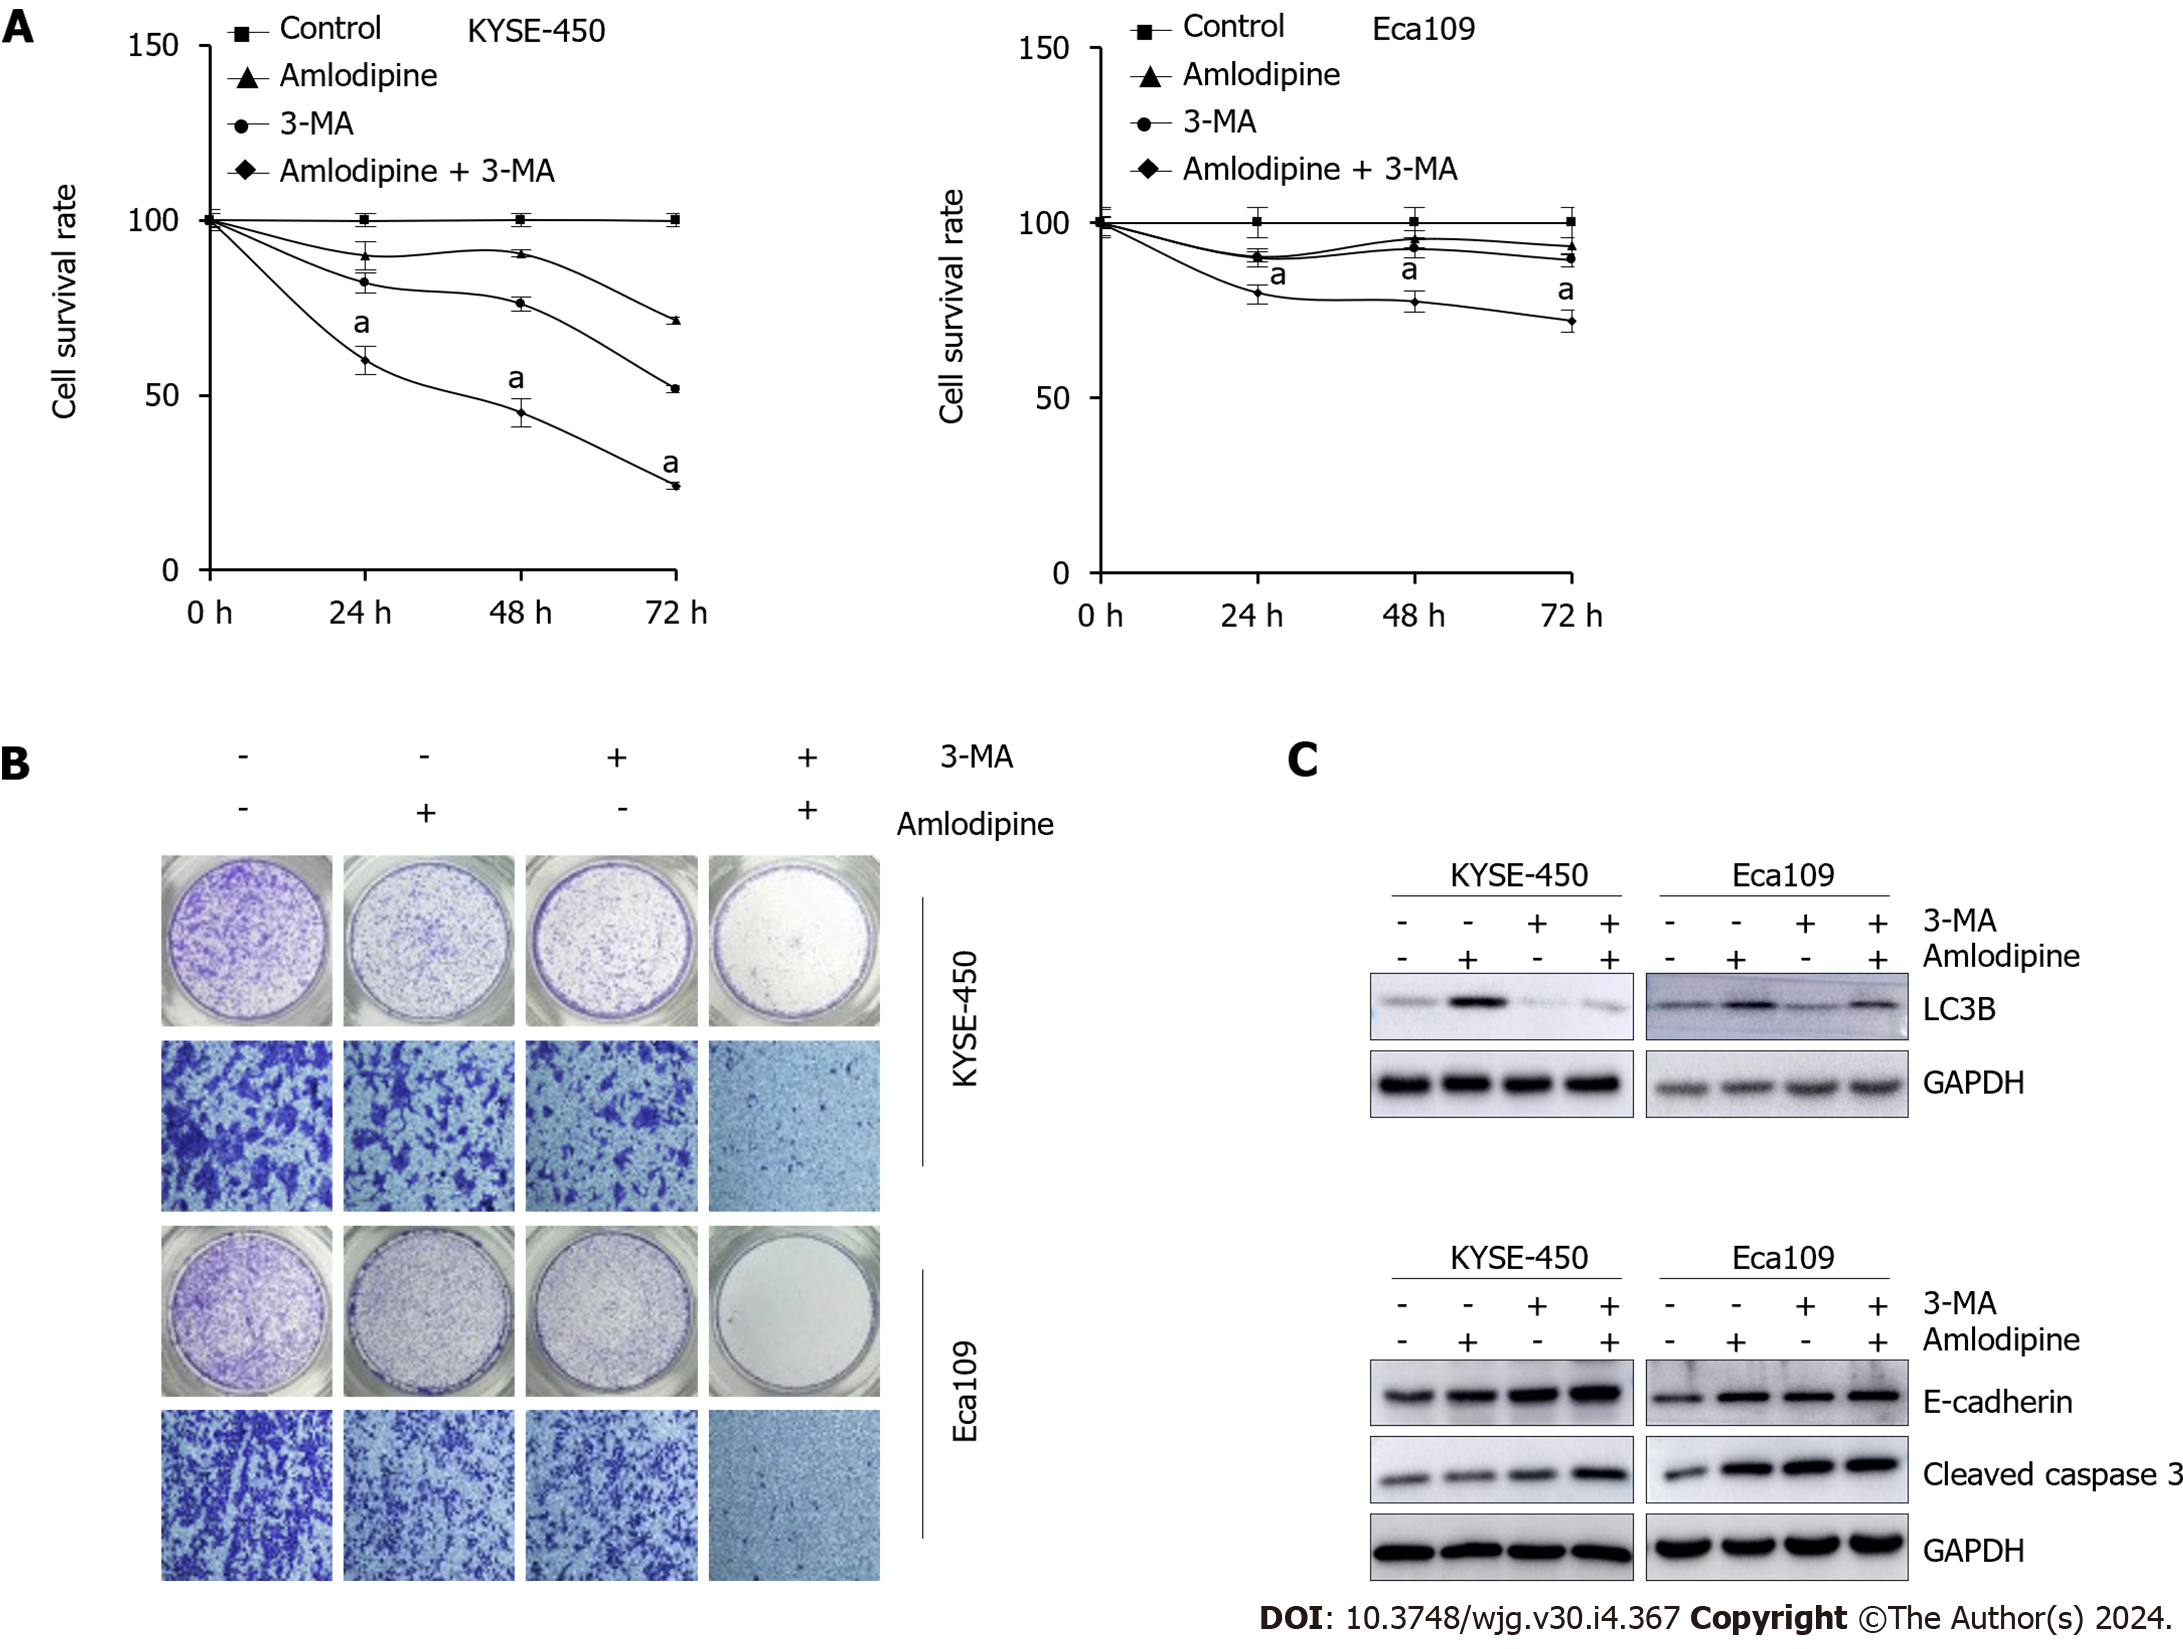
Figure 6 Inhibition of autophagy enhanced amlodipine-induced apoptosis and migration.
A and B: To investigate the effects of amlodipine, 3-methyladenine (3-MA), or their combination on cell proliferation and migration of KYSE-450 and Eca109 cells, 3-(4,5-dimethyl-2-thiazolyl)-2,5-diphenyl tetrazolium bromide (MTT) and Transwell migration assay were carried out, and significant results were observed with aP < 0.05 vs Control; C: LC3B, as well as E-cadherin content and levels, were tested in detail by means of western blot analysis, cleaved caspase 3 in KYSE-450 and Eca109 cells after treatment with amlodipine (4 μg/mL), 3-MA (3 mmol/L), or their combination. GAPDH served as a loading control. 3-MA: 3-methyladenine.
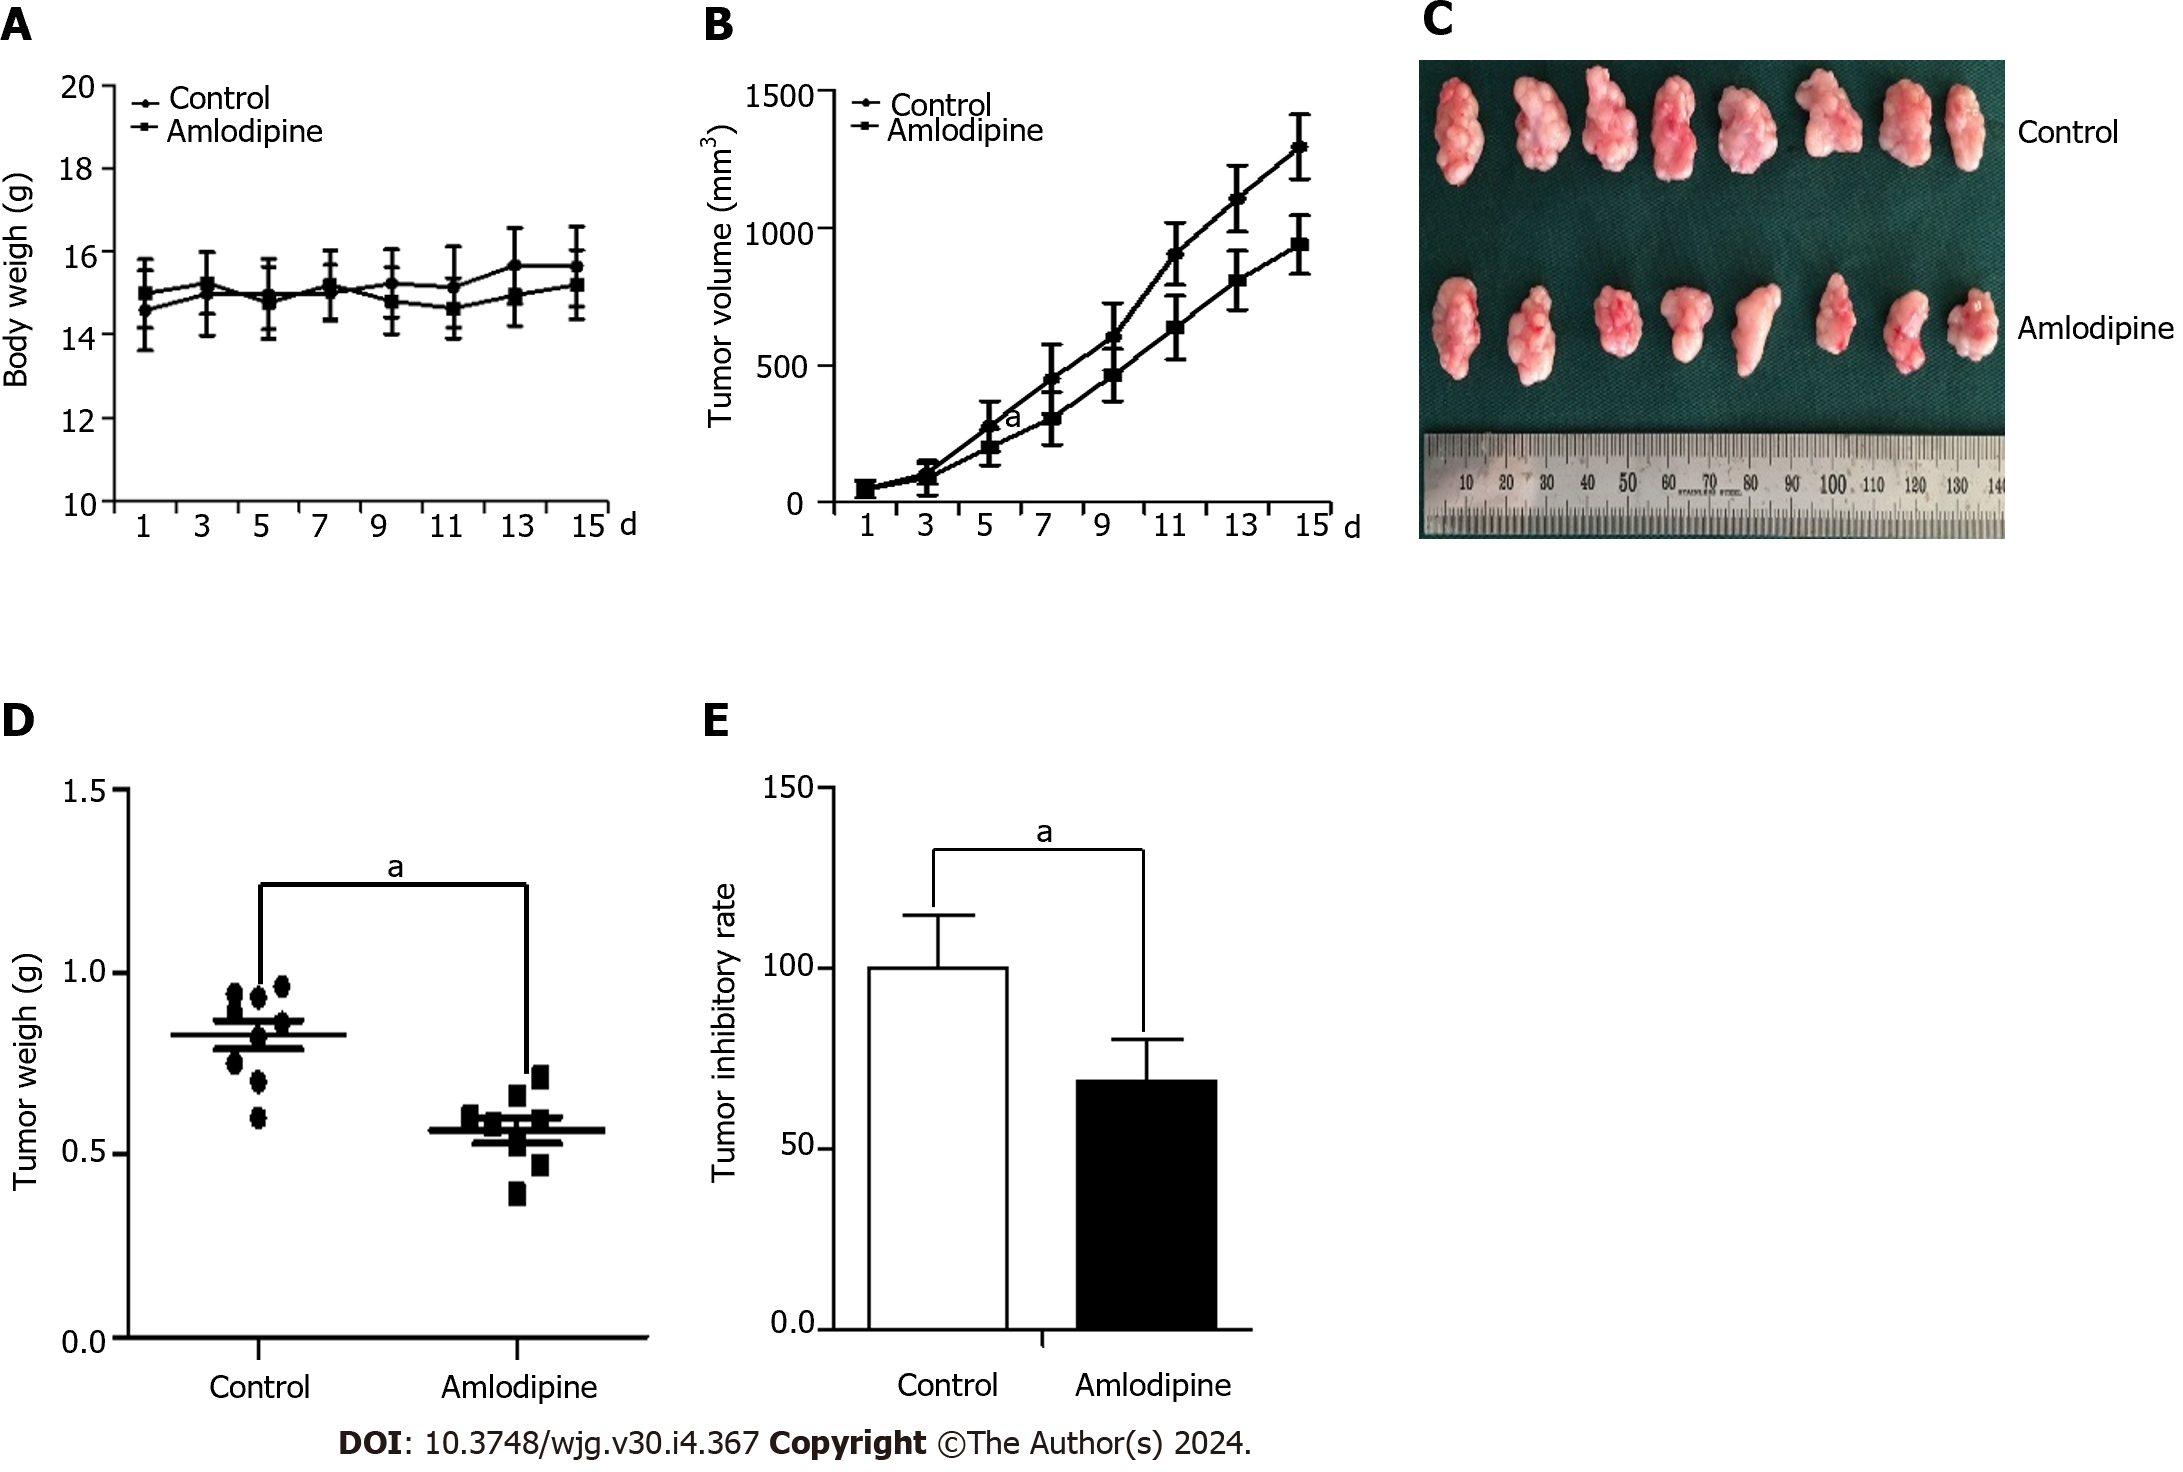
Figure 7 In vivo studies revealed that amlodipine was able to impede Eca109 tumor xenografts.
Initially, 1 × 10⁶ Eca109 cells were subcutaneously implanted into the left hind limb of female BALB/c nude mice. After five days, when tumors reached an approximate size of 50 mm3, the mice were orally administered with amlodipine (13 mg/kg/d) or PBS control vehicle once daily via gavage. Following treatment for fifteen days, the mice were euthanized and their respective tumors were excised for further analysis. A and B: Body weight (A) and the growth curves (B) of tumors were compared between the control group and amlodipine group with significant differences observed at aP < 0.05 vs Control; C: Physical images of tumor xenografts in each group; D: The xenogeneic tumor weights in each group aP < 0.05 vs Control; E: Inhibitory rate of amlodipine on Eca109 xenografts in athymic nude mice aP < 0.05 vs Control.
- Citation: Chen YM, Yang WQ, Gu CW, Fan YY, Liu YZ, Zhao BS. Amlodipine inhibits the proliferation and migration of esophageal carcinoma cells through the induction of endoplasmic reticulum stress. World J Gastroenterol 2024; 30(4): 367-380
- URL: https://www.wjgnet.com/1007-9327/full/v30/i4/367.htm
- DOI: https://dx.doi.org/10.3748/wjg.v30.i4.367


