Copyright
©The Author(s) 2024.
World J Gastroenterol. Sep 21, 2024; 30(35): 3985-3995
Published online Sep 21, 2024. doi: 10.3748/wjg.v30.i35.3985
Published online Sep 21, 2024. doi: 10.3748/wjg.v30.i35.3985
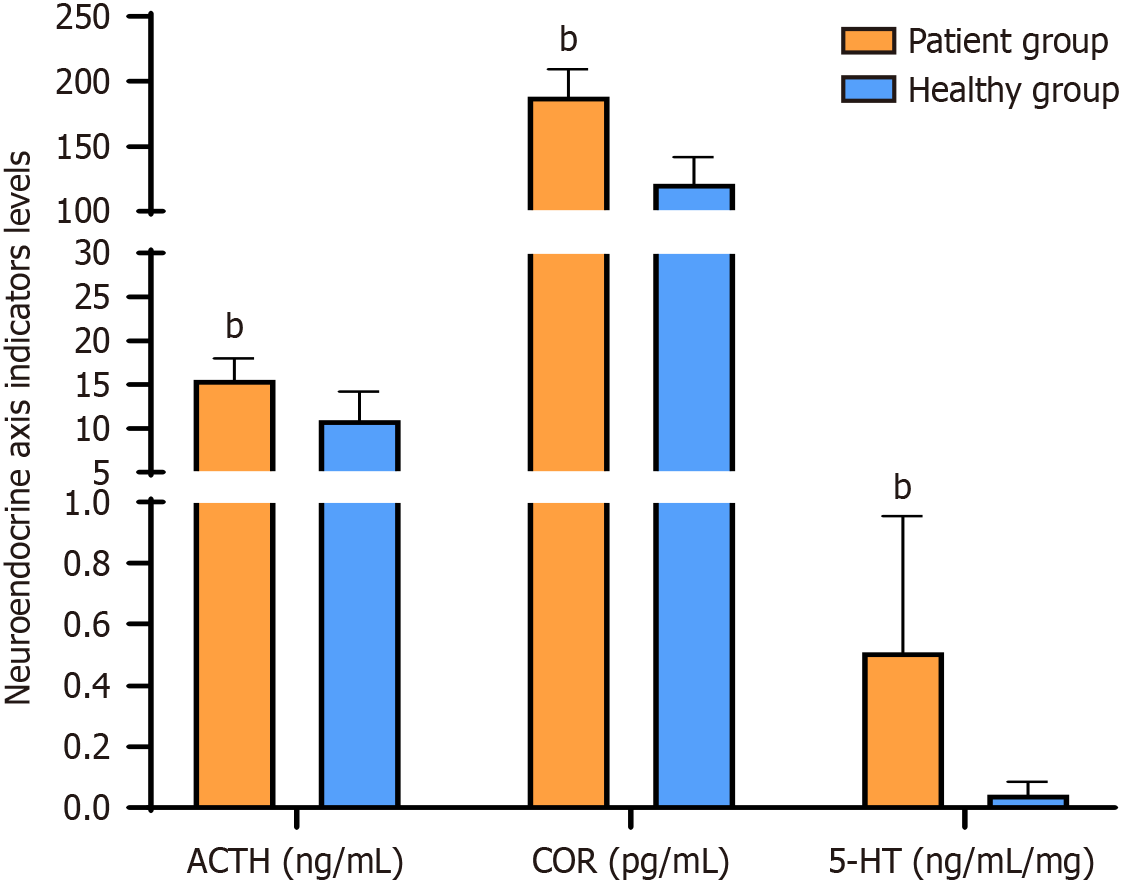
Figure 1 Comparison of neuroendocrine axis indicators between two study groups.
bP < 0.05 vs healthy group. ACTH: Adrenocorticotropic hormone; COR: Cortisol; 5-HT: 5-hydroxytryptamine.
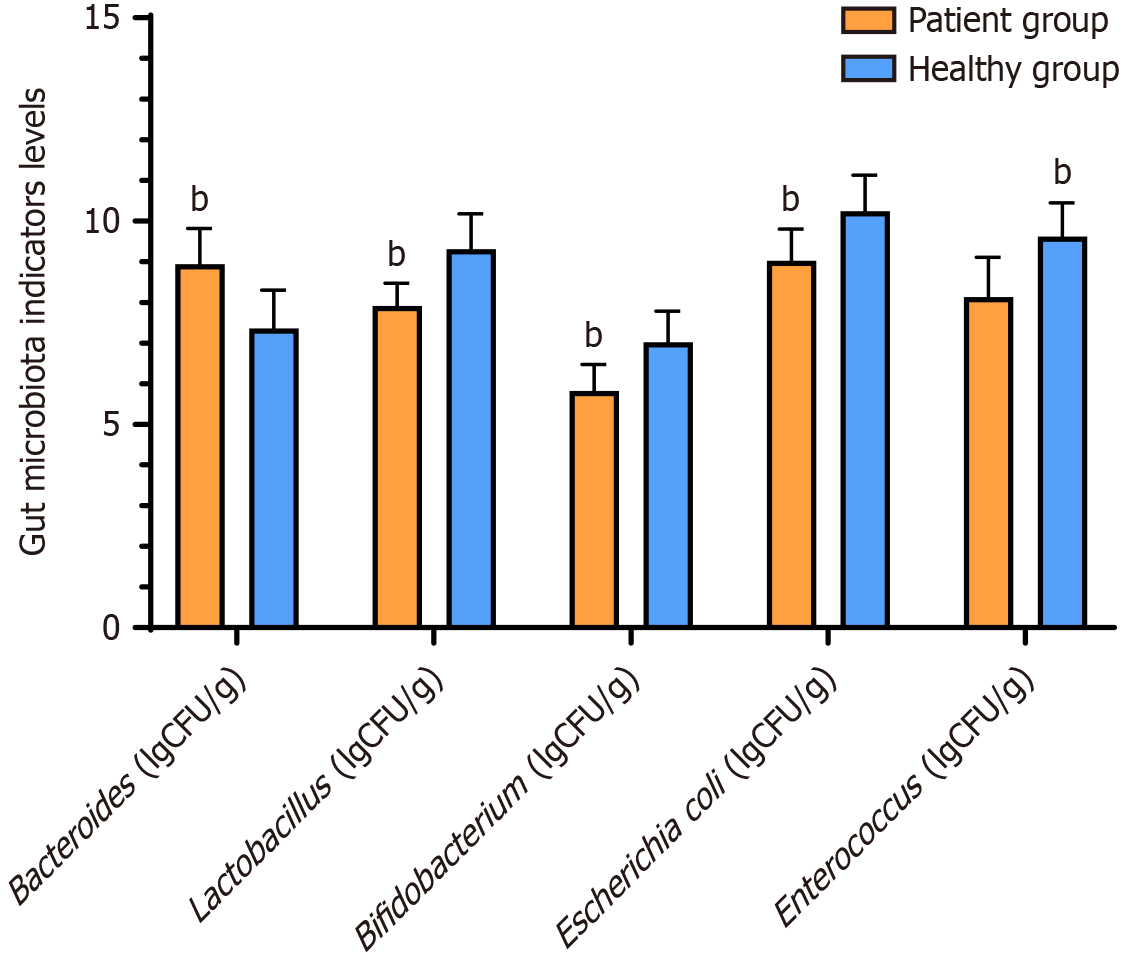
Figure 2 Comparison of gut microbiota indicators between two study groups.
bP < 0.05 vs healthy group.
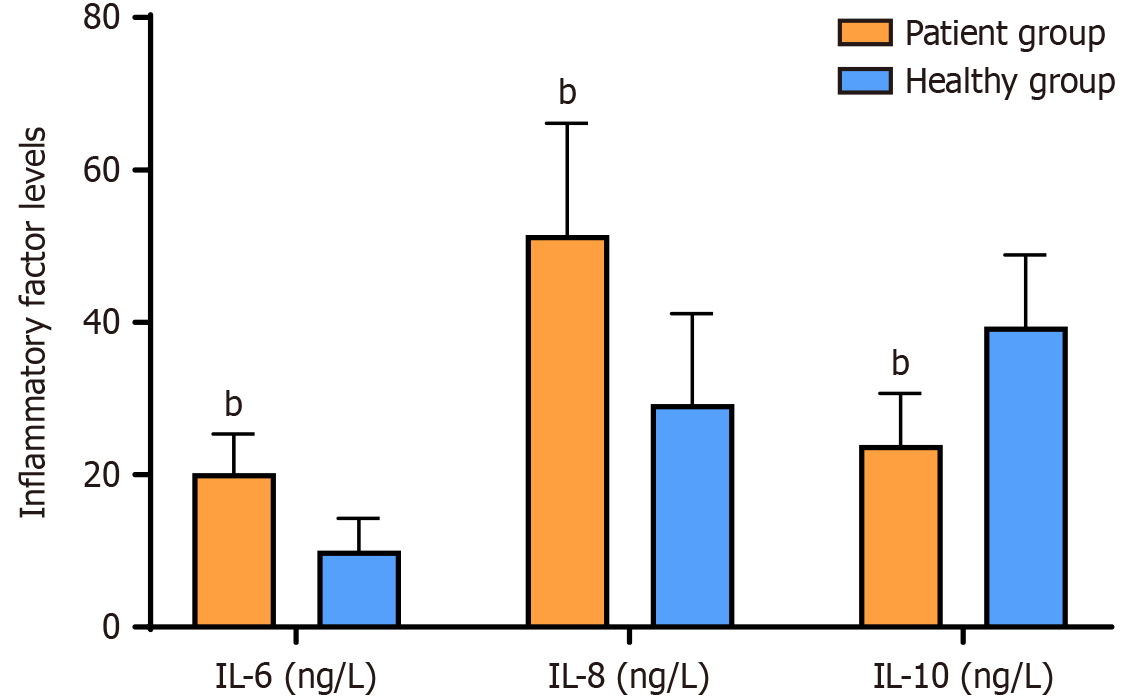
Figure 3 Comparison of inflammatory factor levels between two study groups.
bP < 0.05 vs healthy group.
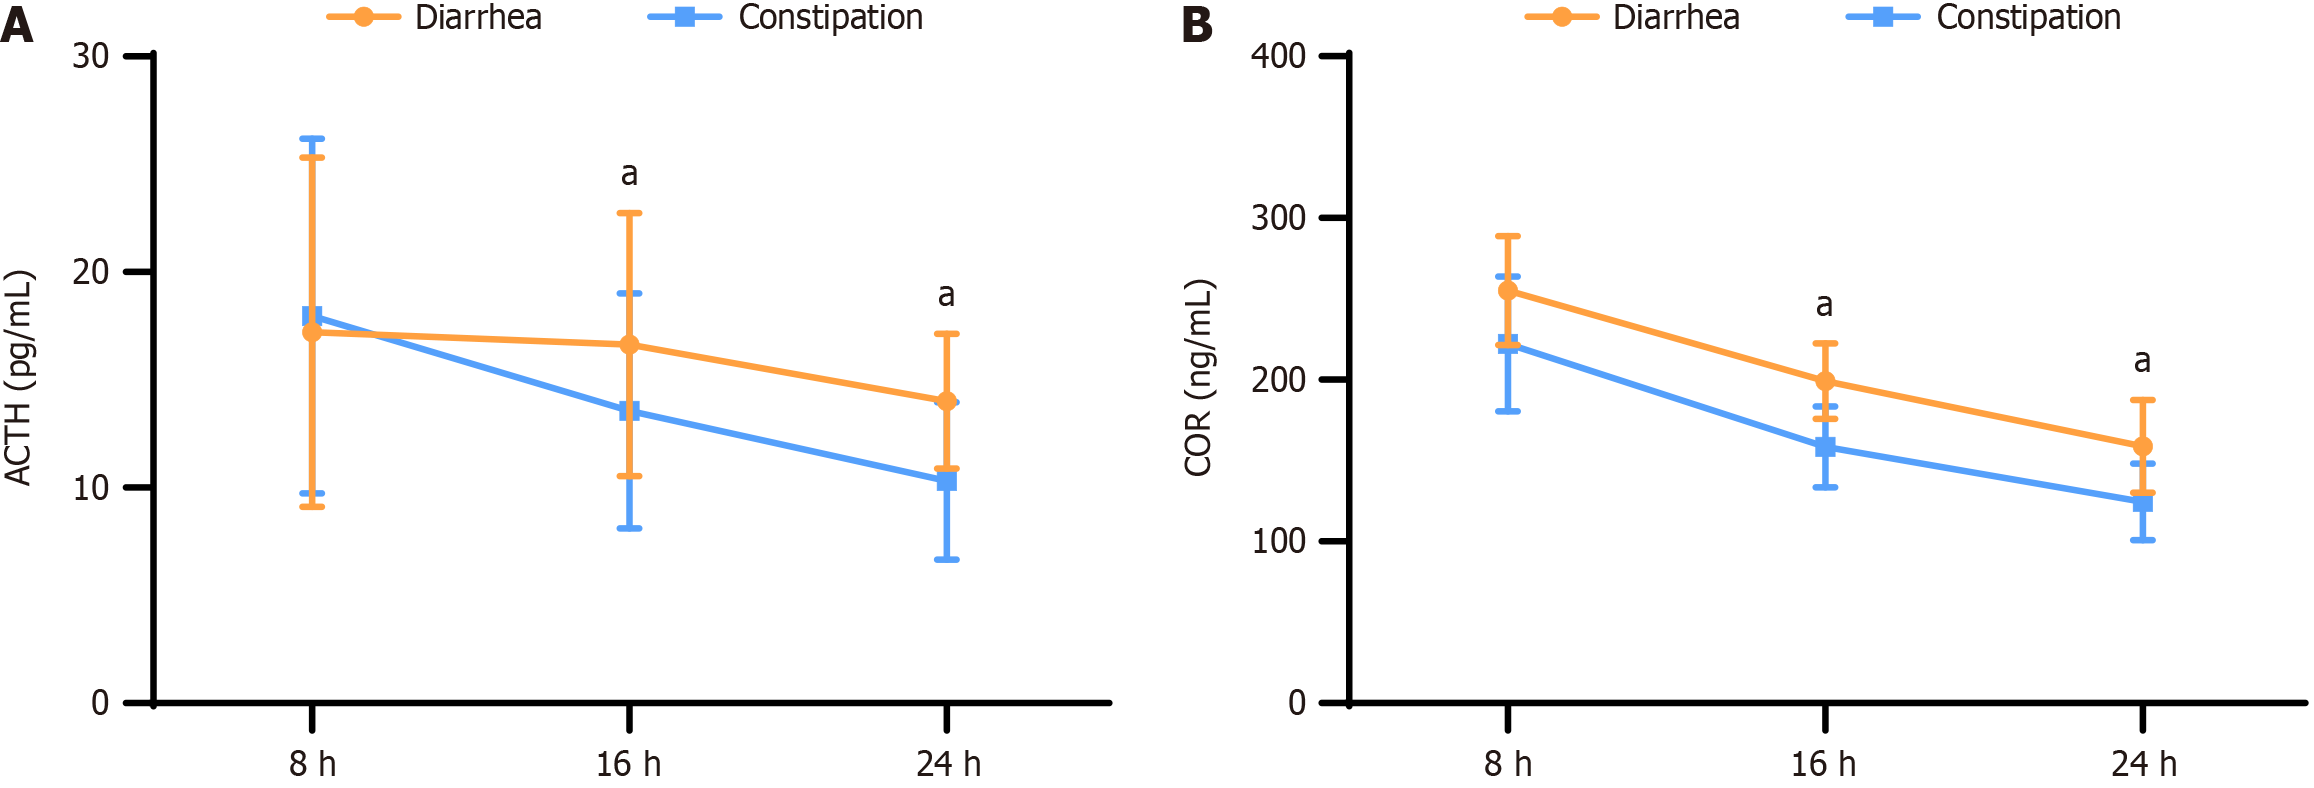
Figure 4 Neuroendocrine axis indicator levels in patients with different symptoms within 24 hours.
A: Adrenocorticotropic hormone levels; B: Cortisol levels. aP < 0.05. ACTH: Adrenocorticotropic hormone; COR: Cortisol.
- Citation: Zhang X, Jin WW, Wang HG. Correlation between the neuroendocrine axis, microbial species, inflammatory response, and gastrointestinal symptoms in irritable bowel syndrome. World J Gastroenterol 2024; 30(35): 3985-3995
- URL: https://www.wjgnet.com/1007-9327/full/v30/i35/3985.htm
- DOI: https://dx.doi.org/10.3748/wjg.v30.i35.3985


