Copyright
©The Author(s) 2024.
World J Gastroenterol. Sep 14, 2024; 30(34): 3894-3925
Published online Sep 14, 2024. doi: 10.3748/wjg.v30.i34.3894
Published online Sep 14, 2024. doi: 10.3748/wjg.v30.i34.3894
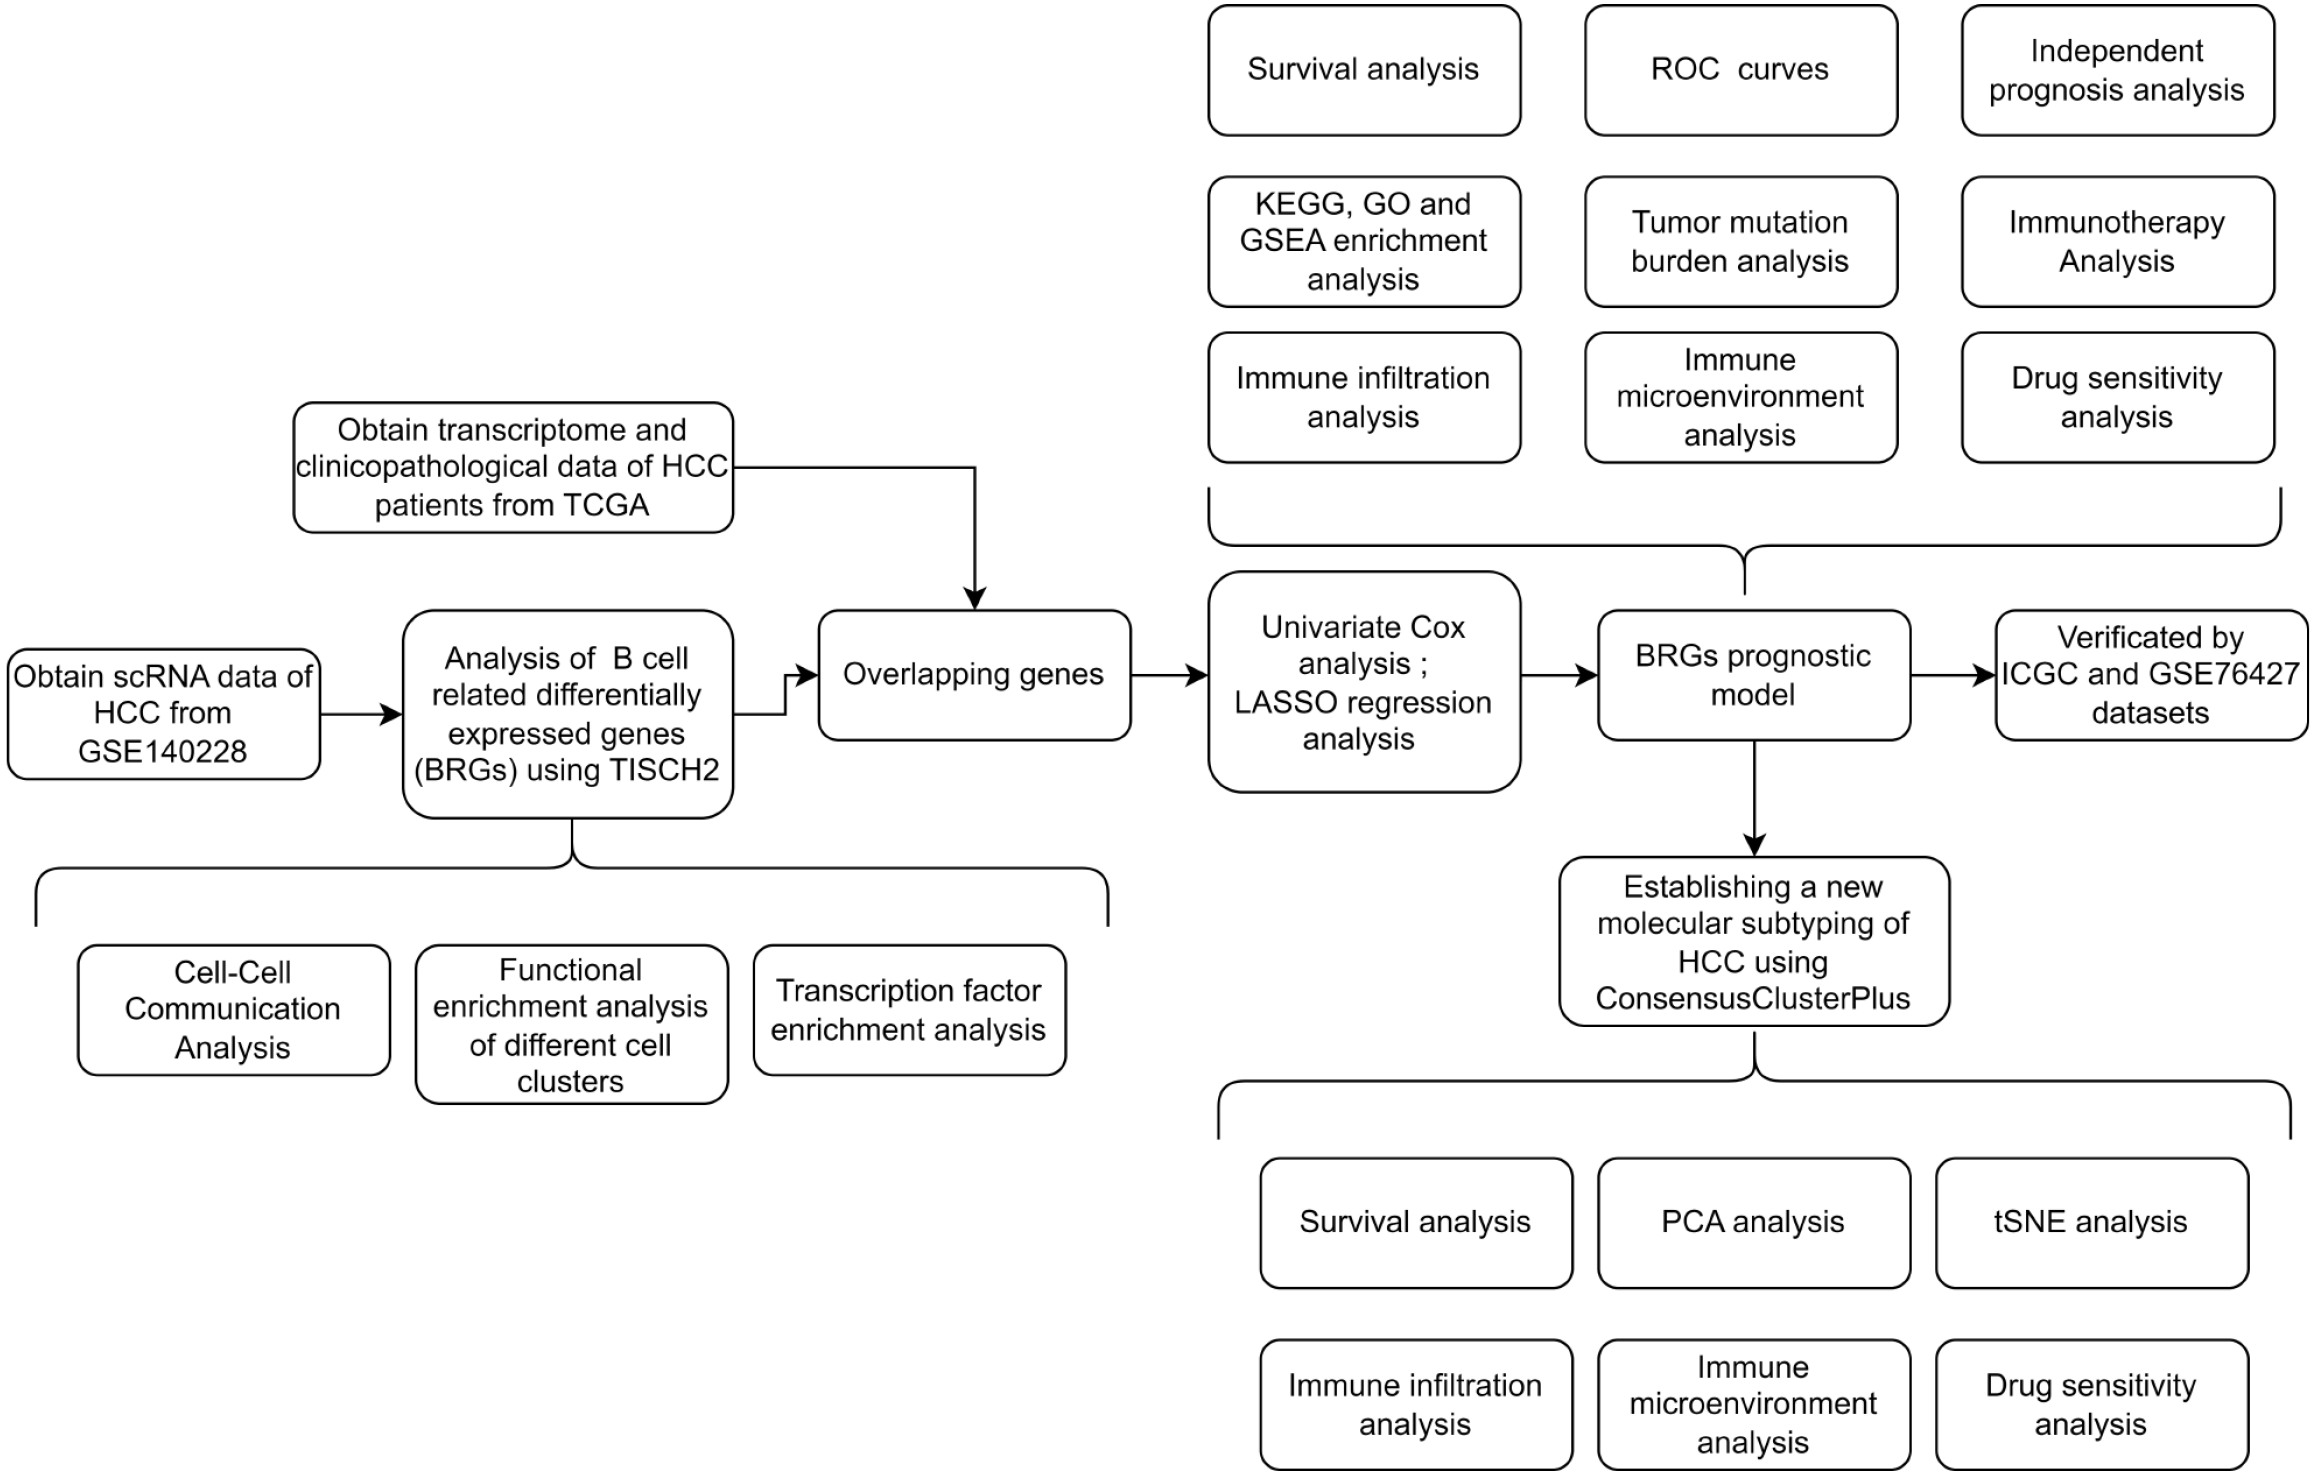
Figure 1 Detailed flowchart illustrates the identification and validation of the prognostic model associated with B-cell-related genes.
HCC: Hepatocellular carcinoma; TCGA: The Cancer Genome Atlas; BRGs: B-cell-related genes; TISCH2: Tumor Immune Single-Cell Hub 2; ROC: Receiver operating characteristic; KEGG: Kyoto Encyclopedia of Genes and Genomes; GO: Gene Ontology; GSEA: Gene set enrichment analysis; LASSO: Least absolute shrinkage and selection operator; ICGC: International Cancer Genome Consortium; PCA: Principal component analysis; tSNE: T-distributed stochastic neighbor embedding; GSE: Gene Expression Omnibus Series.
Figure 2 Cell-to-cell communication in hepatocellular carcinoma.
A: Cellular map illustrates the distribution and abundance of various cell subgroups within hepatocellular carcinoma (HCC); B: Pie chart displays the accurate cell counts of each cell subgroup in HCC; C: Bar graph demonstrates the proportional distribution of each cell subgroup among individual HCC patients; D: Heatmap exhibits the number of gene pairs interacting between cell groups; E: Using cell chat, the interaction probability between specific cell groups and other cell groups is depicted; F: Using cell chat, the interaction probability is delineated between B cells as donors and specific gene pairs of other cells; G: Using cell chat, the interaction probability is delineated between B cells as recipients and specific gene pairs of other cells; H: Volcano plot showcases the differentially expressed genes within B cells. Red indicates fold change > 1.5 and FDR < 0.05; green indicates fold change < 1.5 and FDR < 0.05. LIHC: Liver hepatocellular carcinoma; NK: Nature kill; DC: Dendritic cells; HLA: Human leukocyte antigen.
Figure 3 Analysis of B-cell-related immune signatures in hepatocellular carcinoma.
A: Heatmap illustrates key transcription factors differentially expressed in various cells within hepatocellular carcinoma (HCC); B: Dot plot displays significantly expressed transcription factors in B cells of HCC; C: Heatmap shows immunological gene sets positively regulated by each cell subgroup; D: Heatmap displays immunological gene sets negatively regulated by each cell subgroup; E: Heatmap exhibits Kyoto Encyclopedia of Genes and Genomes (KEGG) enrichment pathways positively regulated by each cell subgroup; F: Heatmap exhibits KEGG enrichment pathways negatively regulated by each cell subgroup; G: Heatmap displays gene ontology biological process (GOBP) enrichment pathways positively regulated by each cell subgroup; H: Heatmap displays GOBP enrichment pathways negatively regulated by each cell subgroup; I: Heatmap displays gene ontology molecular function (GOMF) enrichment pathways positively regulated by each cell subgroup; J: Heatmap displays GOMF enrichment pathways negatively regulated by each cell subgroup; K: Heatmap displays gene ontology cellular component (GOCC) enrichment pathways positively regulated by each cell subgroup; L: Heatmap displays GOCC enrichment pathways negatively regulated by each cell subgroup.
Figure 4 Establishment of prognostic model of B-cell-related genes in hepatocellular carcinoma.
A: Forest plot displays B-cell-related genes (BRGs) associated with hepatocellular carcinoma (HCC) prognosis, green indicates hazard ratio < 1, red indicates hazard ratio > 1; B: Heatmap illustrates the expression levels of BRGs associated with HCC prognosis in both HCC and paired adjacent non-tumor samples; C: Least absolute shrinkage and selection operator (LASSO) regression analysis cross-validation curve demonstrates the fitting effect of the model when incorporating different numbers of BRGs; D: LASSO coefficient path plot displays the lambda values when the model incorporates different numbers of BRGs; E: Survival analysis depicts the relationship between the expression levels of 11 BRGs included in the prognostic model and the prognosis of HCC patients; F: Single-cell analysis reveals the expression levels of the 11 BRGs included in the prognostic model within B cells of HCC. aP < 0.05; bP < 0.01; cP < 0.001.
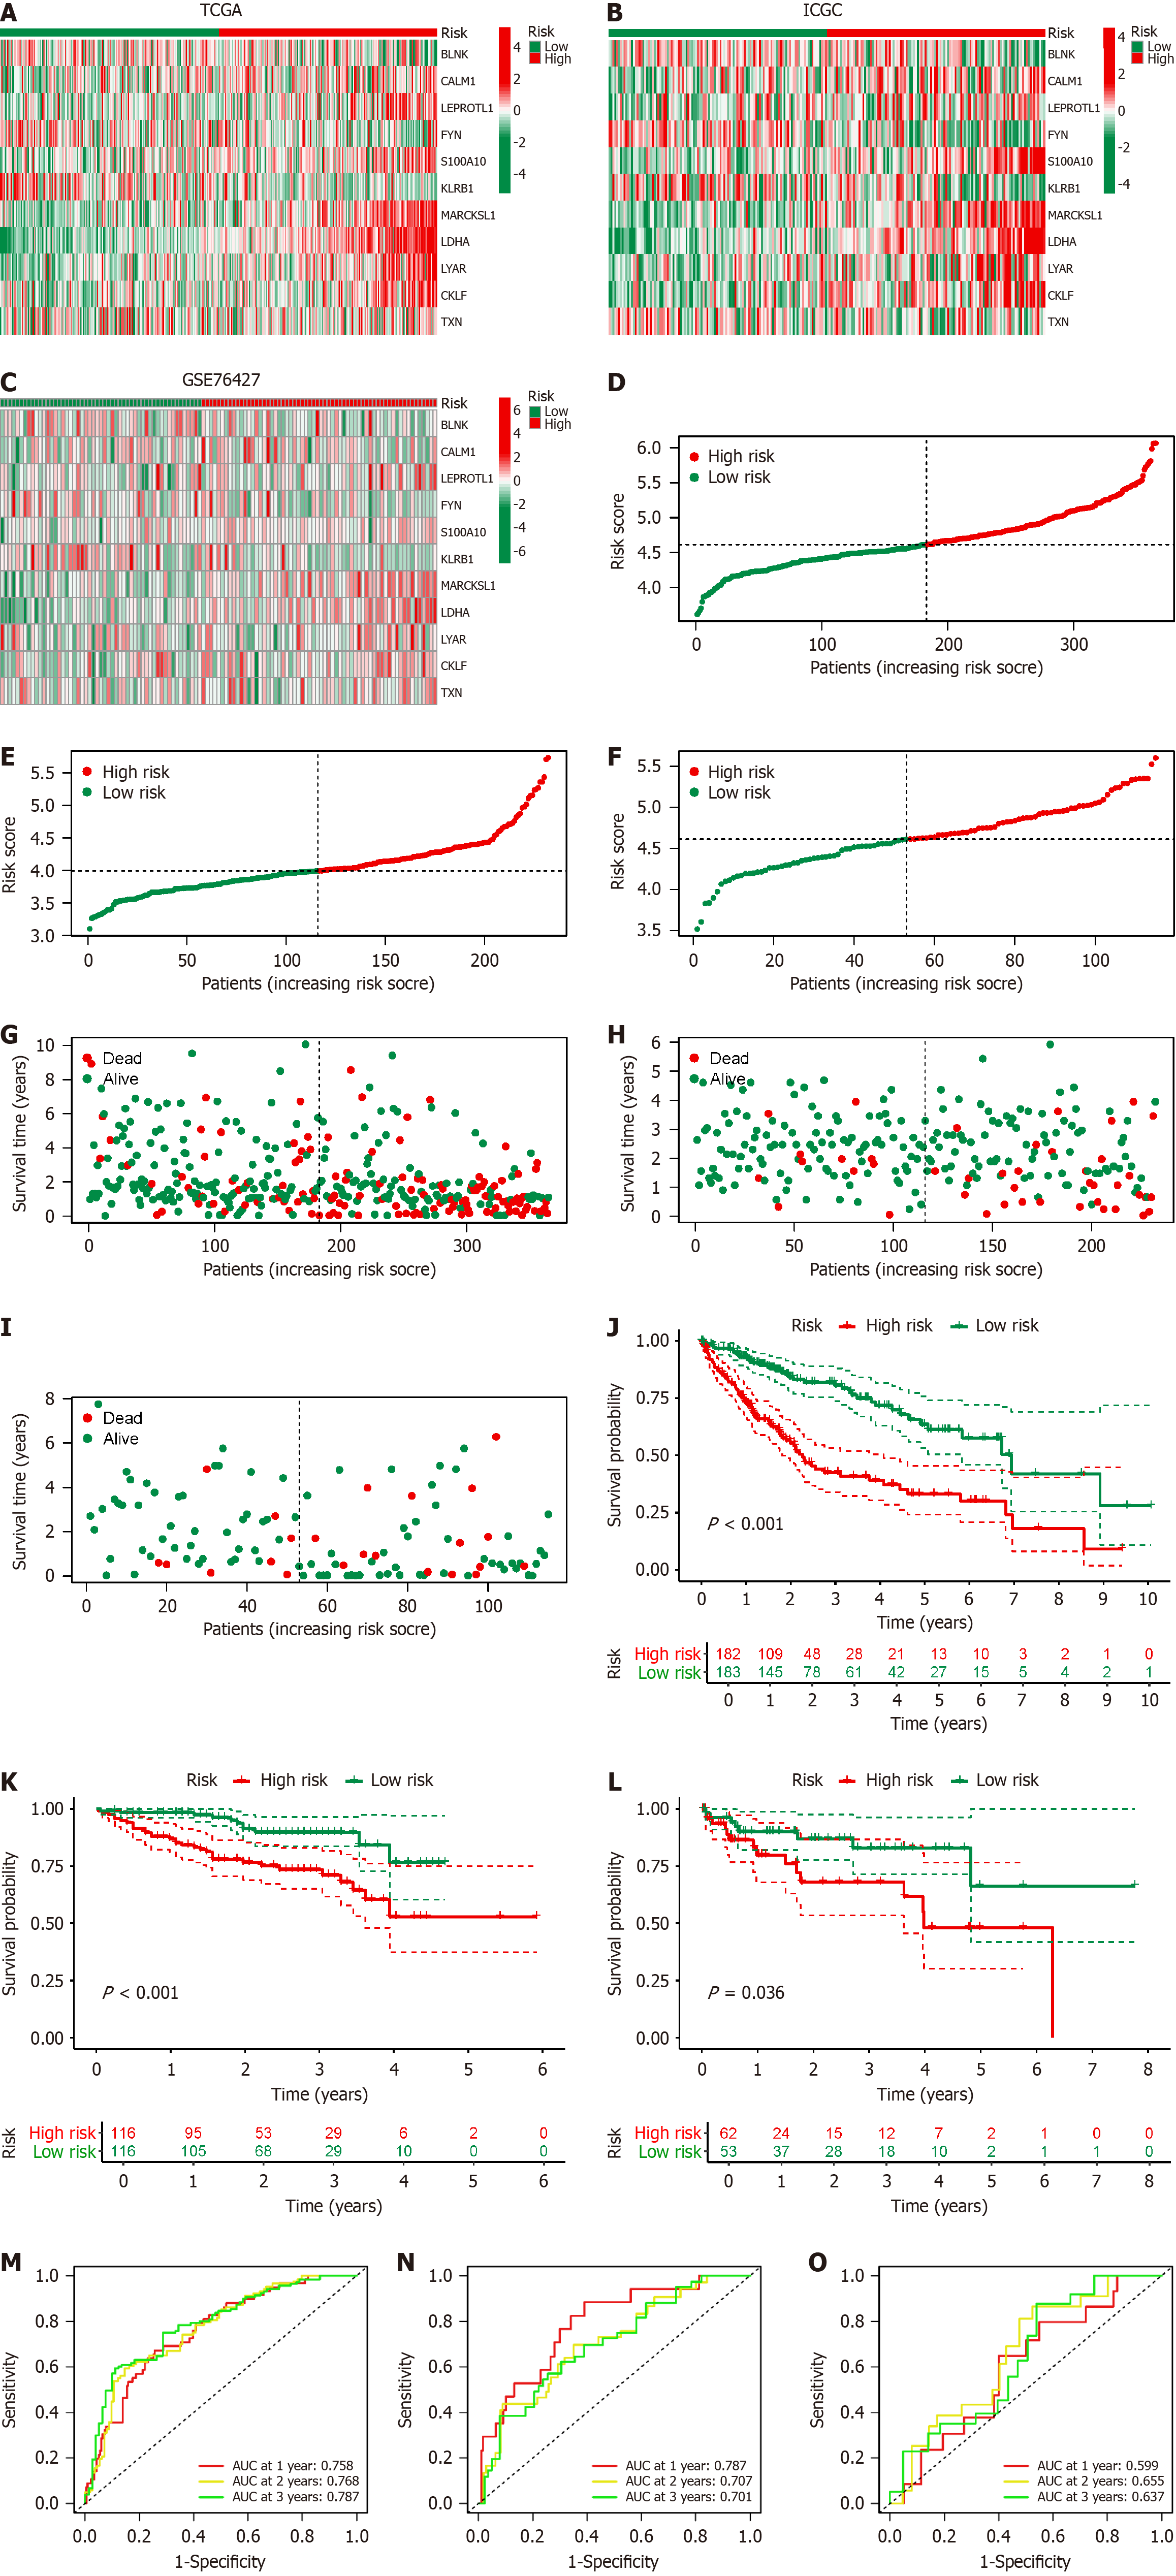
Figure 5 Validation of B-cell-related genes prognostic model in hepatocellular carcinoma.
A–C: Heatmap displays the expression levels of the 11 B-cell-related genes (BRGs) included in the prognostic model in The Cancer Genome Atlas (TCGA) (A); International Cancer Genome Consortium (ICGC) (B); Gene set enrichment (GSE) 76427 (C); D–F: Risk curves depict the distribution of hepatocellular carcinoma (HCC) patients with different risk scores in TCGA (D); ICGC (E); GSE76427 (F); G–I: Dot plots show the distribution of the survival status of HCC patients with different risk scores in TCGA (G); ICGC (H); GSE76427 (I); J–L: Survival curves illustrate the prognosis of HCC patients with different risk scores in TCGA (J); ICGC (K); GSE76427 (L); M–O: Receiver operating characteristic curves demonstrate the predictive efficacy of the BRGs prognostic model in TCGA (M); ICGC (N); GSE76427 (O); AUC: Areas under the curves.
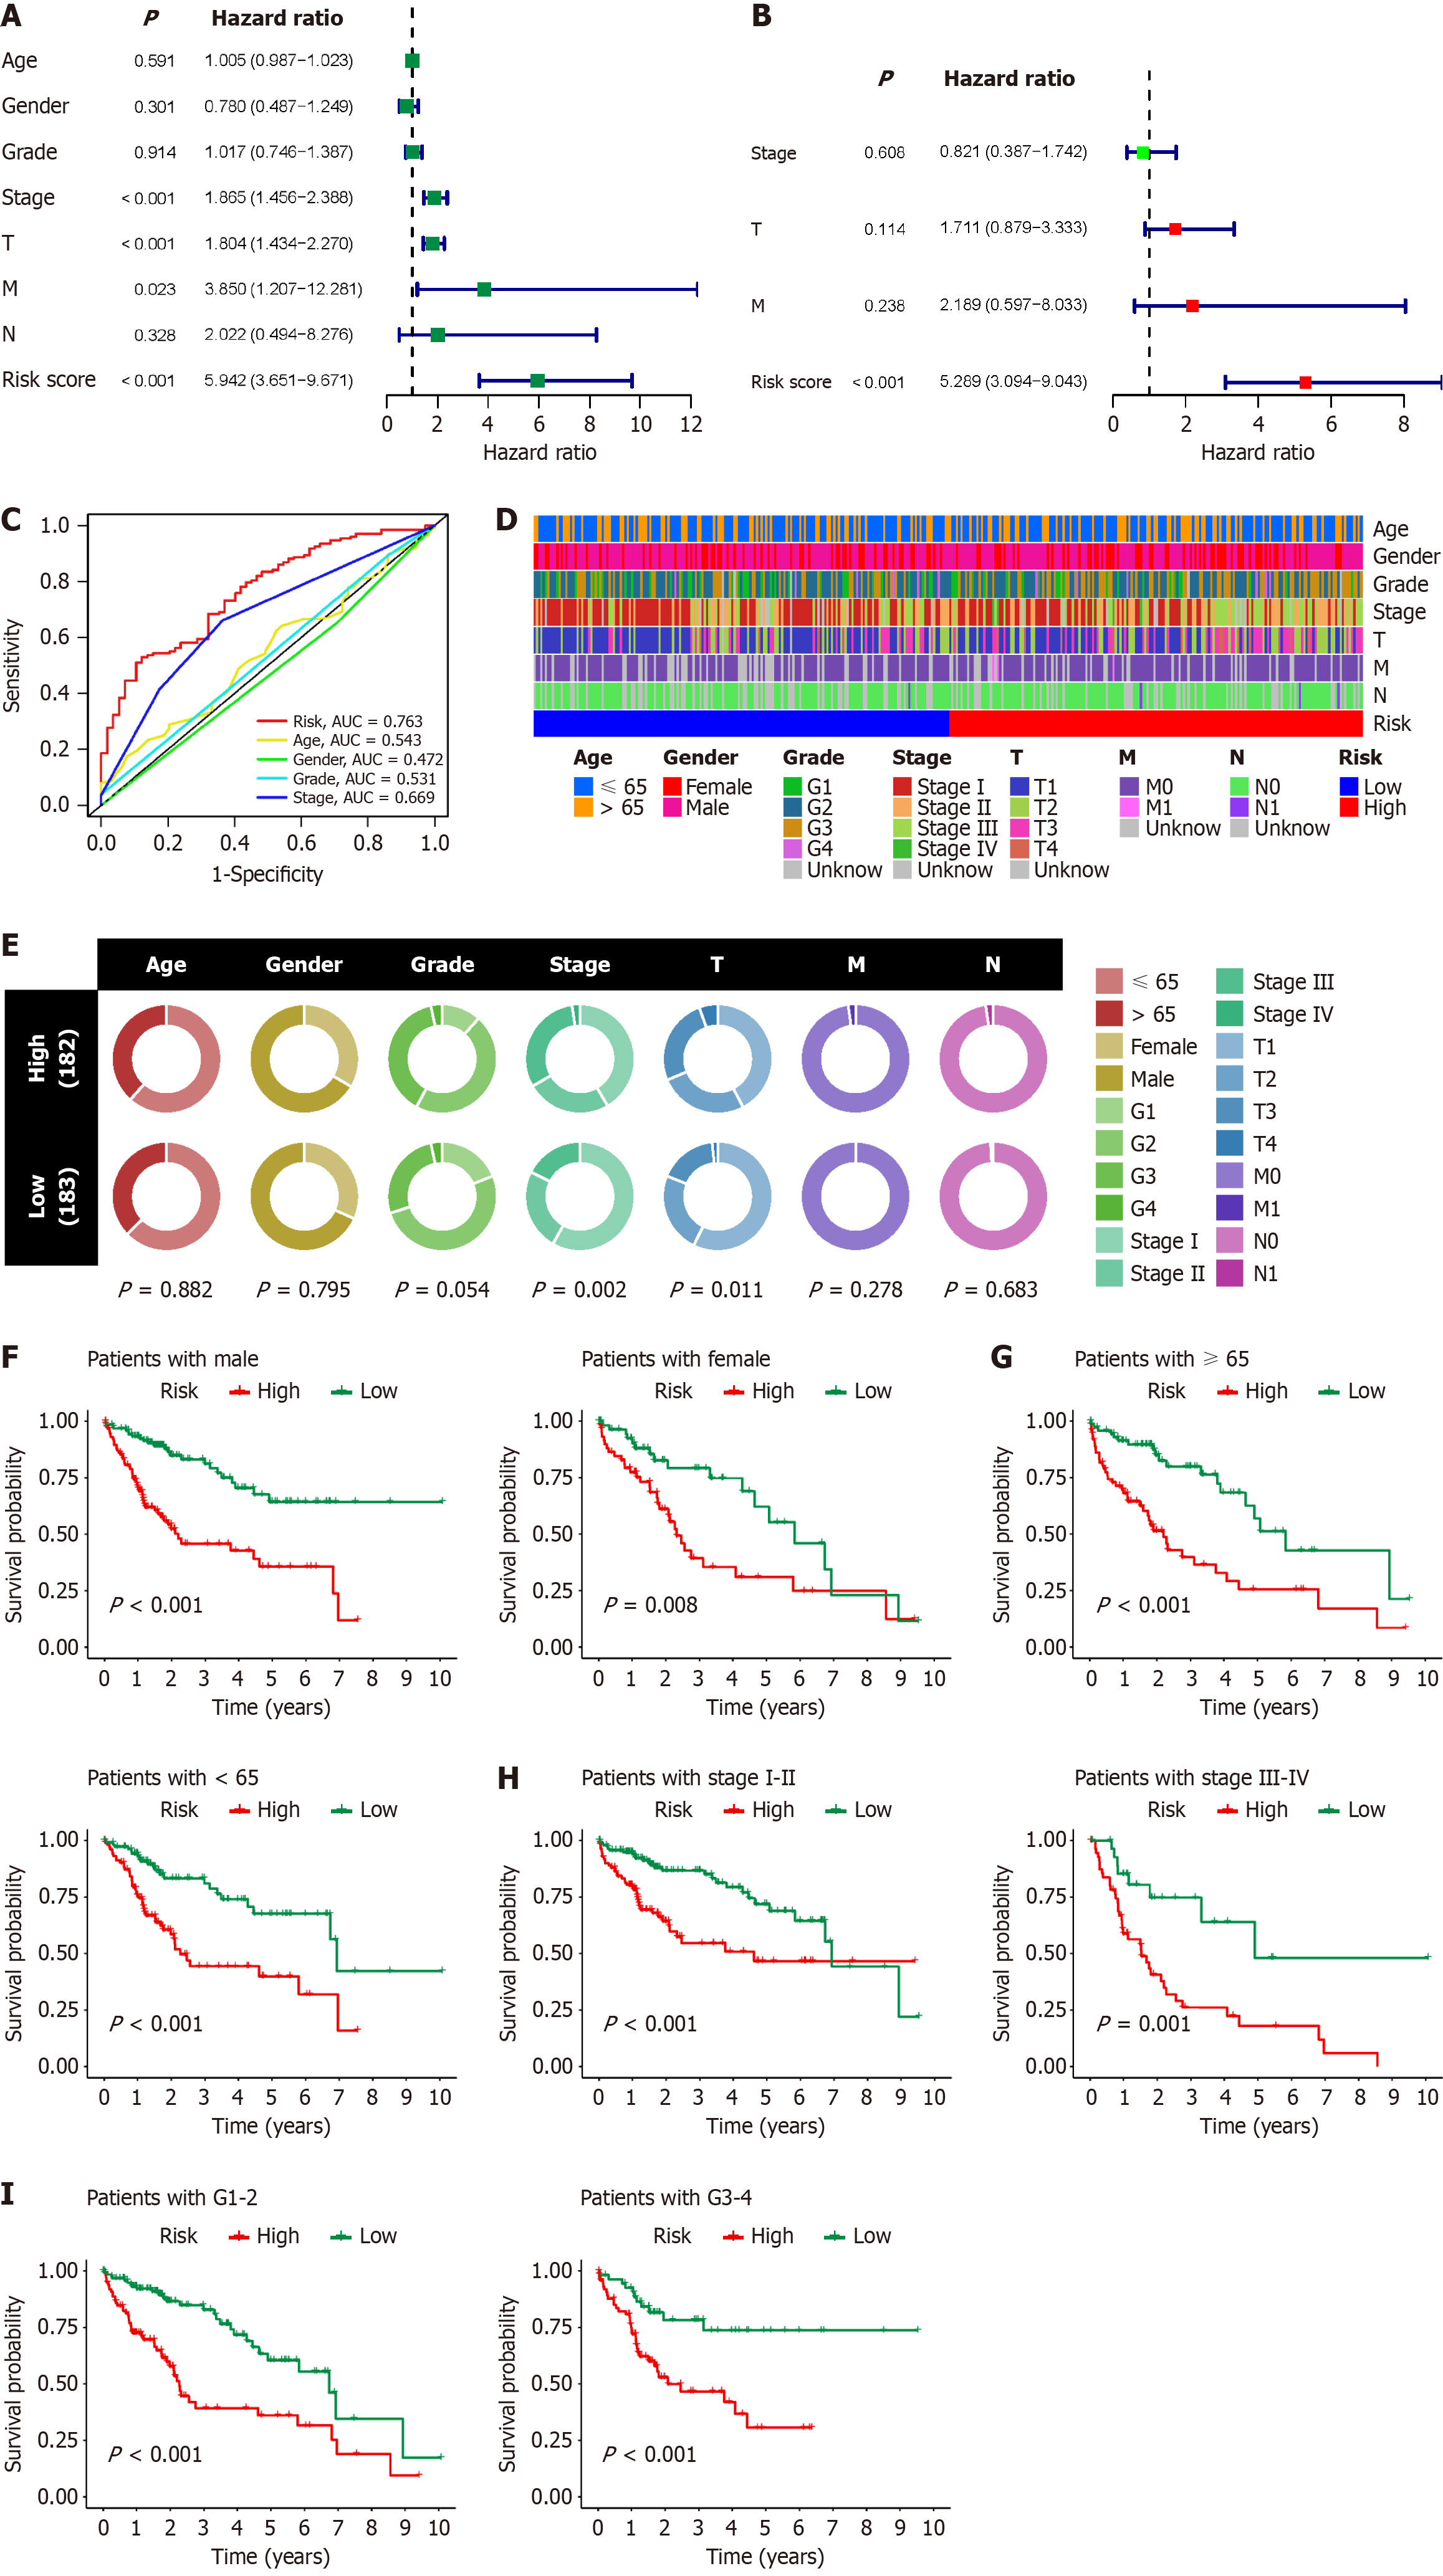
Figure 6 Clinical correlation analysis of B-cell-related genes prognostic model in hepatocellular carcinoma.
A: Single-factor Cox regression analysis shows the association between risk score and other clinicopathological factors of hepatocellular carcinoma (HCC) with prognosis; B: Multifactor Cox regression analysis demonstrates whether risk score and other clinicopathological factors of HCC can serve as independent prognostic factors for HCC; C: Receiver operating characteristic curve illustrates the effectiveness of risk score and other clinicopathological factors of HCC in predicting the prognosis of HCC patients; D: Heatmap displays the distribution of various clinical and pathological statuses of HCC patients in different risk score groups; E: Bubble plot demonstrates the proportions of various clinical and pathological statuses among HCC patients in different risk score groups and their correlation with risk score; F–I: Survival analysis shows the ability of the B-cell-related genes prognostic model to predict the prognosis of HCC patients in various clinical subgroups. AUC: Areas under the curves.
Figure 7 Functional enrichment analysis of different risk score groups.
A: Heatmap displays the expression levels of the top 50 differentially expressed genes across different risk score groups in hepatocellular carcinoma (HCC) samples; B: Volcano plot illustrates the differentially expressed genes across different risk score groups. Red indicates fold change > 2, false discovery rate (FDR) < 0.05; green indicates fold change < 2, FDR < 0.05; C: Bubble plot presents the Kyoto Encyclopedia of Genes and Genomes pathway enrichment analysis results across different risk score groups; D: Bubble plot demonstrates gene ontology (GO) enrichment analysis pathways and proportions across different risk score groups; E: Bubble plot exhibits GO enrichment analysis pathways, number of genes, and their statistical significance across different risk score groups; F: Gene set enrichment analysis (GSEA) analysis reveals the key pathways enriched in HCC patients with high risk scores; G: GSEA analysis unveils the key pathways enriched in HCC patients with low risk scores; H: Somatic mutation data analysis showcases the mutation rates of key genes in HCC patients with high risk scores; I: Somatic mutation data analysis displays the mutation rates of key genes in HCC patients with low risk scores; J: Survival analysis illustrates the prognosis of HCC patients in different tumor mutation burden groups; K: Survival analysis demonstrates the impact of tumor mutation burden combined with risk score groups on the prognosis of HCC patients. FC: Fold change; ECM: Extracellular matrix; HIF: Hypoxia-inducible factor; KEGG: Kyoto encyclopedia of genes and genomes.
Figure 8 Assessment of the immune microenvironment in different risk score groups.
A: Box plot illustrates the stromal score across different risk score groups; B: Box plot displays the immune score across different risk score groups; C: Box plot showcases the estimate score across different risk score groups; D: Bubble plot demonstrates the correlation between risk score and immune cell infiltration within hepatocellular carcinoma samples; E: Box plot shows the abundance of immune cells across different risk score groups calculated based on the single-sample gene set enrichment analysis (ssGSEA) algorithm; F: Box plot exhibits the abundance of immune cells across different risk score groups calculated based on the cell-type identification by estimating relative subsets of RNA transcripts (CIBERSORT) algorithm; G: Heatmap displays the distribution and proportions of immune cells across different risk score groups calculated based on the CIBERSORT algorithm; H: Box plot demonstrates the immune functional status across different risk score groups calculated based on the ssGSEA algorithm; I: Association between The Cancer Genome Atlas immune subtypes and BRGs prognostic subtypes; J: Box plot showcases the expression of immune checkpoint genes across different risk score groups; K: Survival analysis depicts the immune therapy response and efficacy in different risk score groups of the IMvigor210 immune therapy cohort. aP < 0.05; bP < 0.01; cP < 0.001. LIHC: Liver hepatocellular carcinoma; CD: Cluster of differentiation; NK: Nature kill; DC: Dendritic cells; HLA: Human leukocyte antigen; TCGA: The cancer genome atlas.
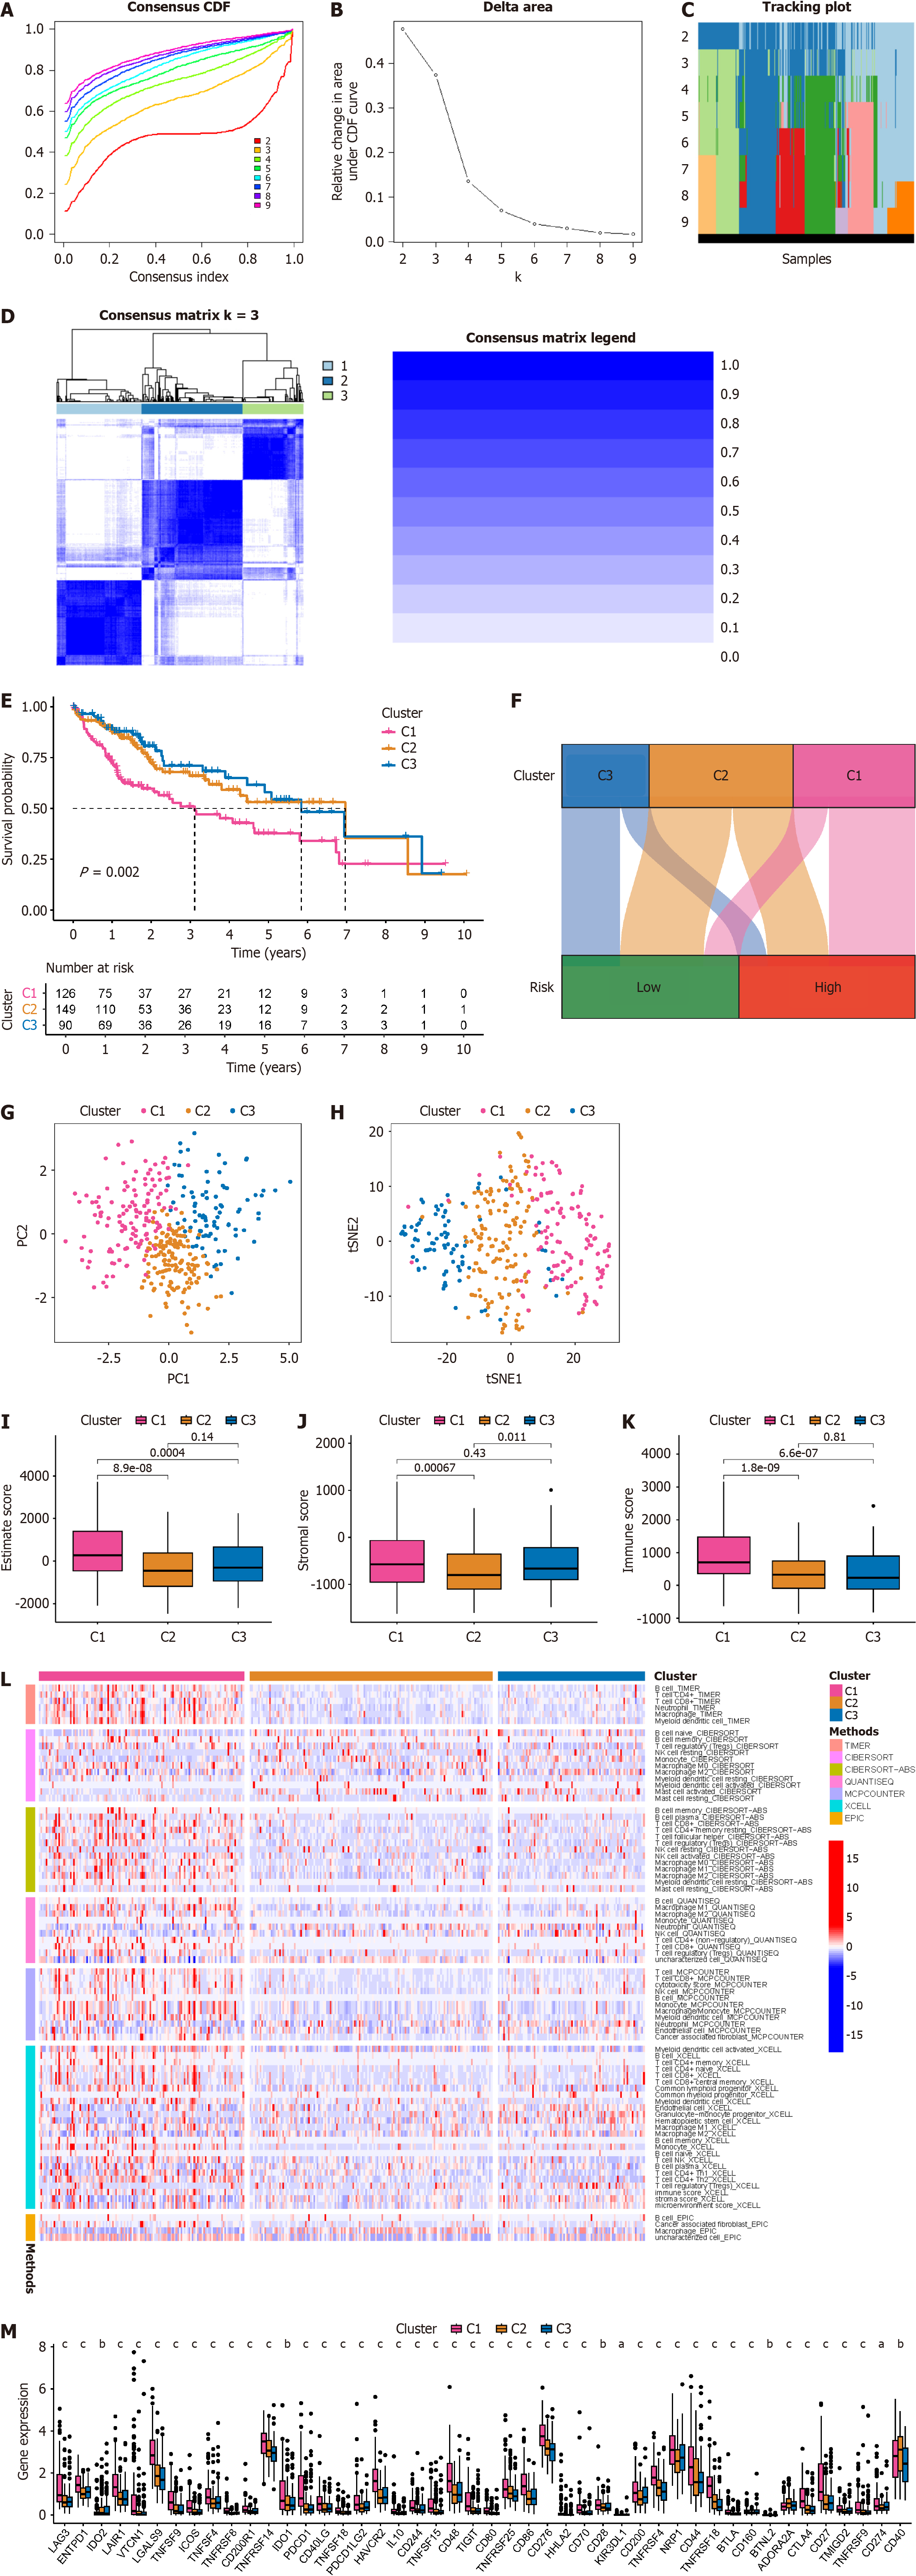
Figure 9 Novel molecular subtyping for identification of hepatocellular carcinoma based on B-cell-related genes.
A: Cumulative distribution function curves for different numbers of classifications, where different curves represent the stability of models at different k values; B: Distribution of samples across different numbers of classifications; C: Heatmap displays distribution of hepatocellular carcinoma (HCC) patients under different k values; D: Consistency clustering plot displays the clustering results when k = 3; E: Survival curves illustrate the prognosis of HCC patients with different molecular subtypes; F: Sankey diagram shows the correspondence between different molecular subtypes of HCC patients and different risk score groups; G: Principal component analysis shows the distribution of samples across different HCC molecular subtypes; H: T-distributed stochastic neighbor embedding analysis shows the distribution of samples across different HCC molecular subtypes; I: Box plot demonstrates the estimate score across different HCC molecular subtypes; J: Box plot showcases the stromal score across different HCC molecular subtypes; K: Box plot displays the immune score across different HCC molecular subtypes; L: Heatmap displays the immune cell infiltration status across different HCC molecular subtypes based on different algorithms; M: Box plot demonstrates the expression of immune checkpoint genes across different HCC molecular subtypes. aP < 0.05; bP < 0.01; cP < 0.001.
- Citation: Xu KQ, Gong Z, Yang JL, Xia CQ, Zhao JY, Chen X. B-cell-specific signatures reveal novel immunophenotyping and therapeutic targets for hepatocellular carcinoma. World J Gastroenterol 2024; 30(34): 3894-3925
- URL: https://www.wjgnet.com/1007-9327/full/v30/i34/3894.htm
- DOI: https://dx.doi.org/10.3748/wjg.v30.i34.3894


