Copyright
©The Author(s) 2024.
World J Gastroenterol. Aug 21, 2024; 30(31): 3705-3716
Published online Aug 21, 2024. doi: 10.3748/wjg.v30.i31.3705
Published online Aug 21, 2024. doi: 10.3748/wjg.v30.i31.3705
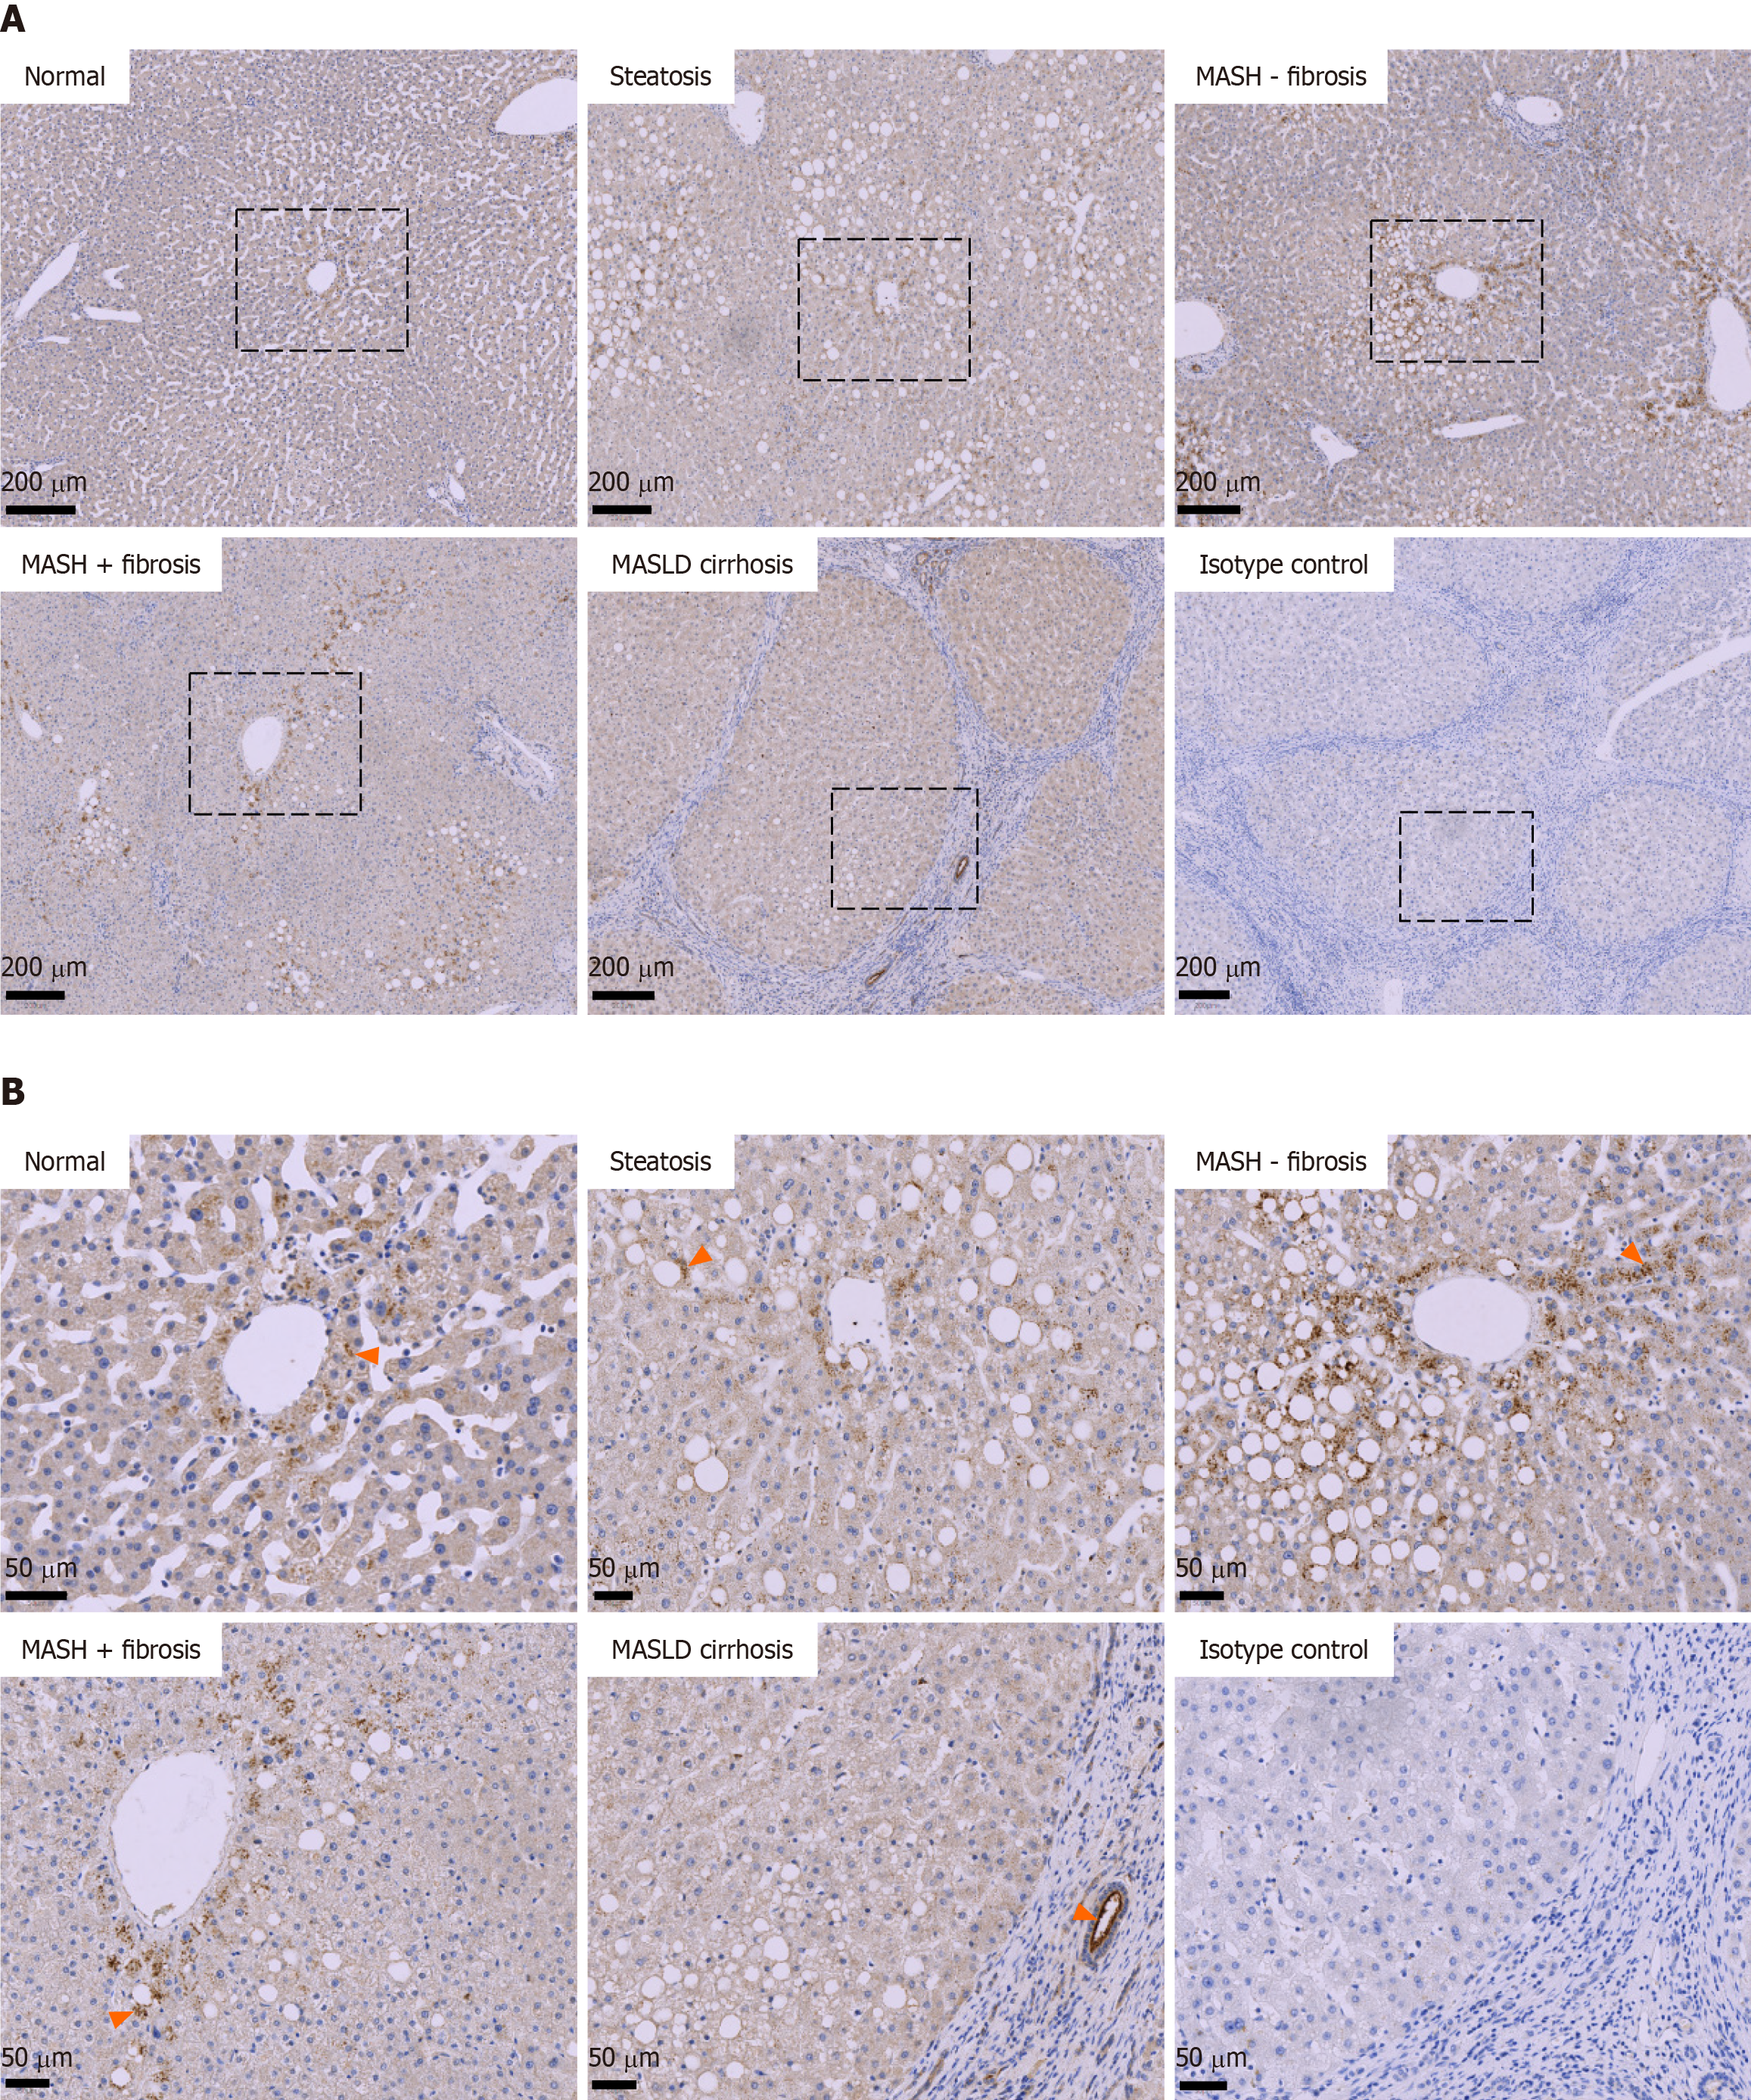
Figure 1 Angiotensin-converting enzyme 2 protein expression pattern in normal and metabolic dysfunction-associated steatotic liver disease livers.
A: Representative images of angiotensin-converting enzyme 2 immunostaining across the metabolic dysfunction-associated steatotic liver disease histological spectrum. Scale bars: 200 µm; B: Representative views of boxed areas in panel A (positive and specific staining is indicated with arrowheads). Scale bars: 50 µm. MASH: Metabolic dysfunction-associated steatohepatitis; MASLD: Metabolic dysfunction-associated steatotic liver disease.
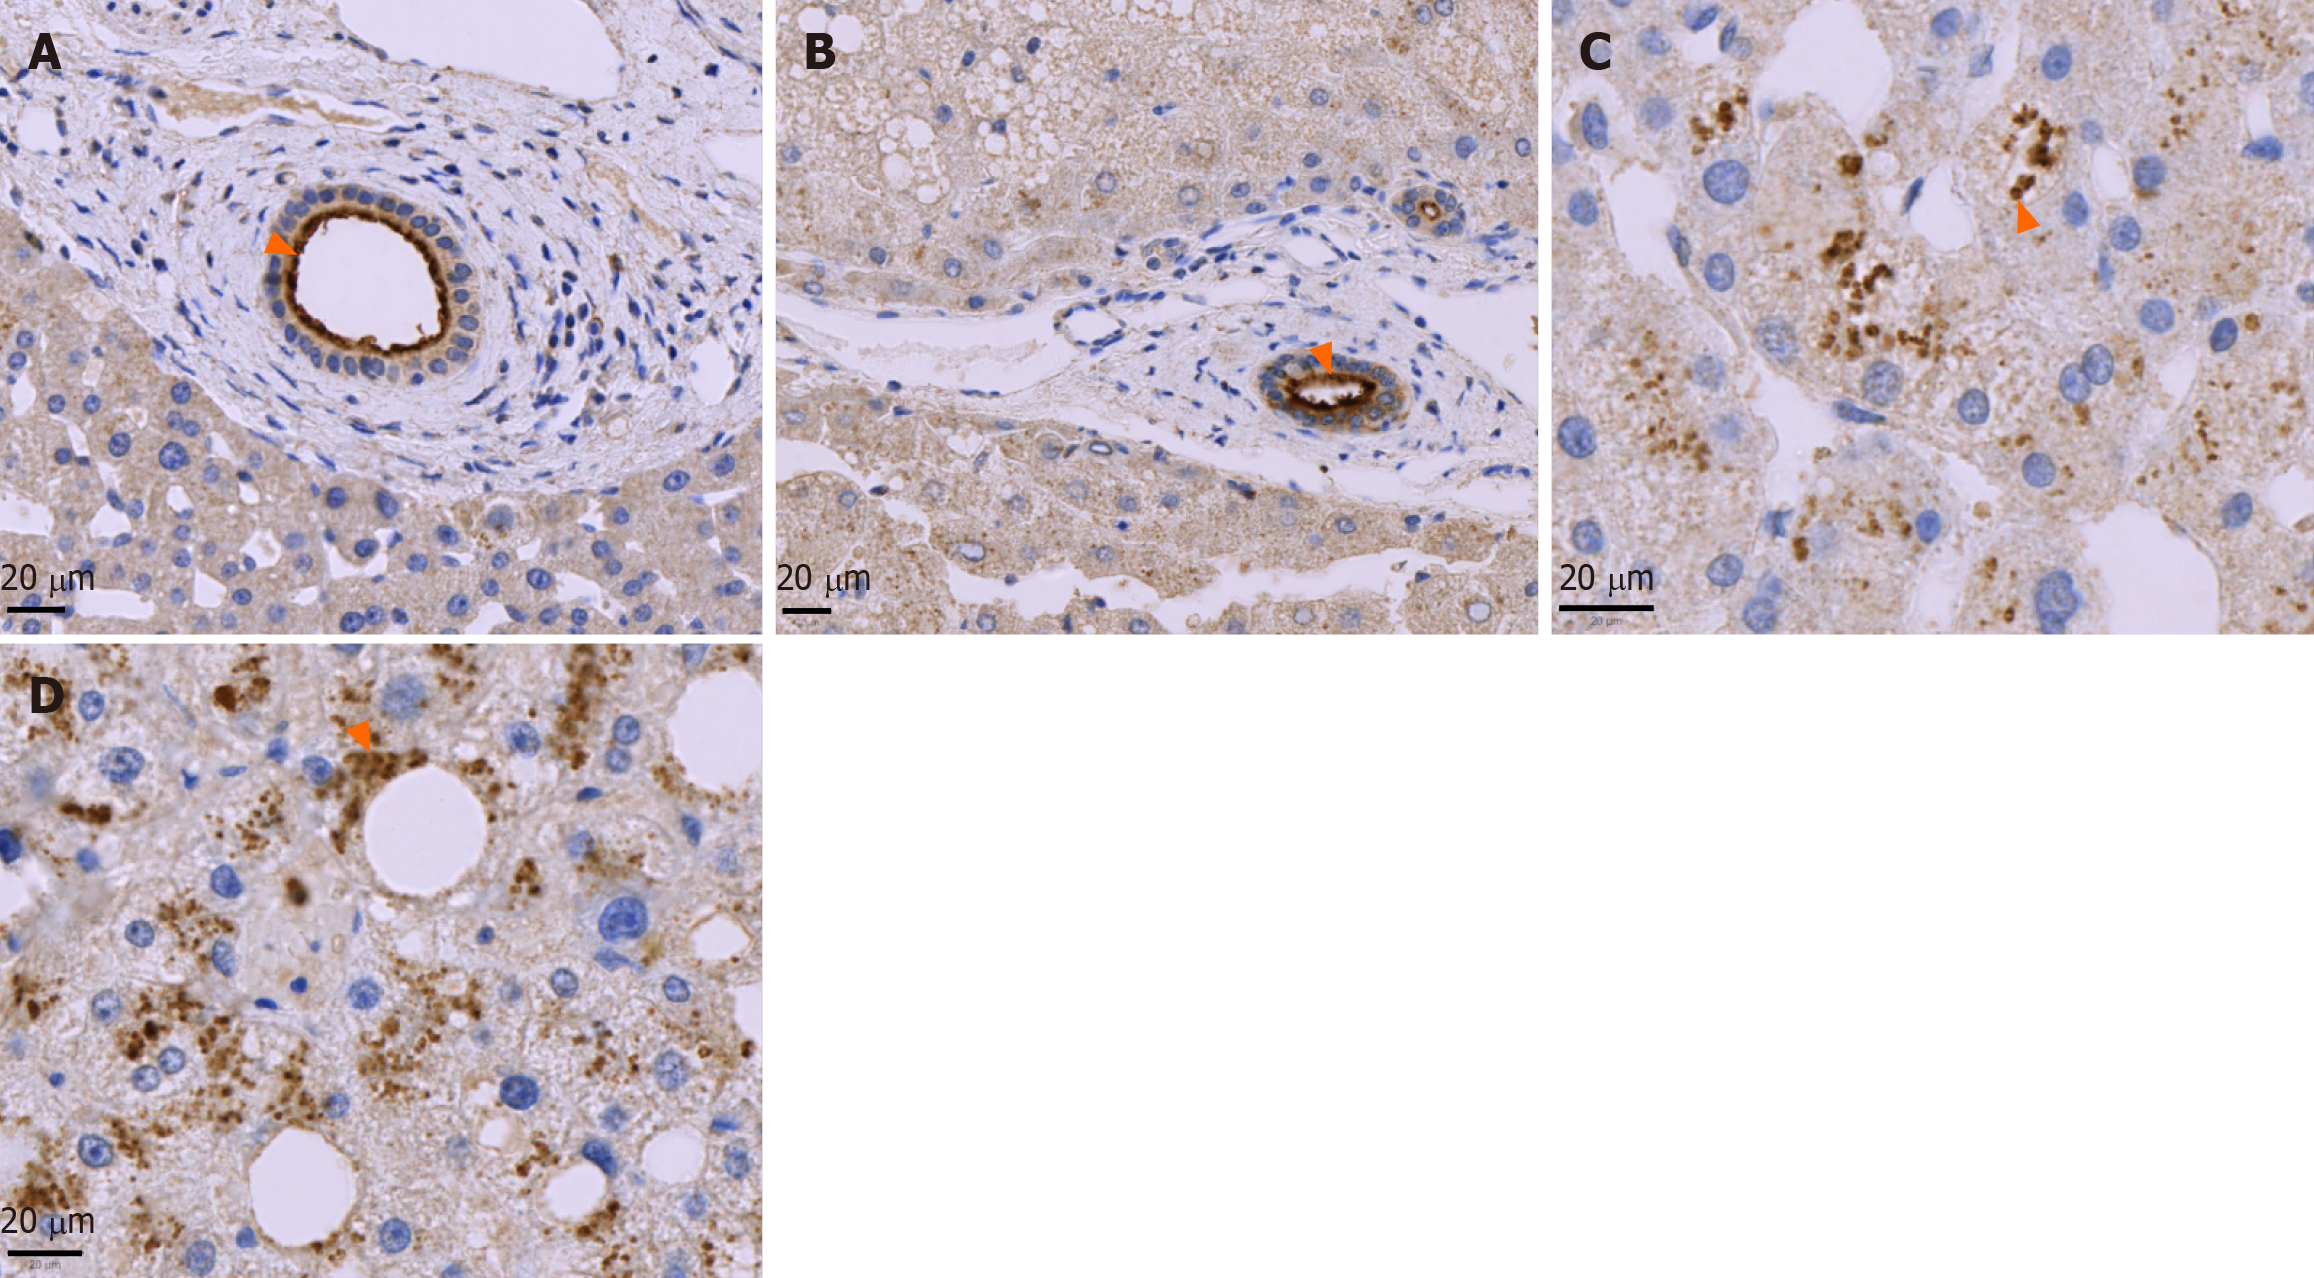
Figure 2 Hepatic angiotensin-converting enzyme 2 immunolocalization in cholangiocytes and hepatocytes in normal and metabolic dysfunction-associated steatotic liver disease.
Representative images of liver sections showing strong and precise immunostaining for angiotensin-converting enzyme 2 (ACE2) on the apical membrane of cholangiocytes. A: Normal liver; B: Metabolic dysfunction-associated steatotic liver disease (MASLD)-related cirrhosis (arrowheads); C: Normal liver showing punctuate granular intracellular ACE2 immunostaining in hepatocytes (arrowhead); D: Metabolic dysfunction-associated steatohepatitis showing ACE2 immunostaining localised close to the plasma membrane in some steatotic hepatocytes (arrowhead). Scale bars: 20 µm.
Figure 3 Hepatic angiotensin-converting enzyme 2 protein expression is elevated in metabolic dysfunction-associated steatohepatitis without fibrosis and correlates with hepatocyte lipid droplet content.
A: Computational quantification of hepatic angiotensin-converting enzyme 2 (ACE2) immunostaining in tissue sections across the histopathological metabolic dysfunction-associated steatotic liver disease (MASLD) spectrum. Metabolic dysfunction-associated steatohepatitis (MASH) - fib = MASH without fibrosis, MASH + fib = MASH with fibrosis. Data was analysed using the Kruskal-Wallis test and Dunn’s post-hoc multiple comparisons (Normal vs MASH - fib: P < 0.05; other comparisons not statistically significant); B: Correlation between histological fibrosis (picrosirius red-positive area) and hepatic ACE2 protein levels (ACE2-positive area) across the MASLD spectrum assessed by Spearman’s rank correlation coefficient: rs = 0.3, I = 0.09, not statistically significant); C: Correlation between lipid droplet content (lipid droplet-positive area) and hepatic ACE2 protein levels (ACE2-positive area) across the MASLD spectrum assessed by Spearman’s rank correlation coefficient: rs = 0.5, P = 0.01). ACE2: Angiotensin-converting enzyme 2.
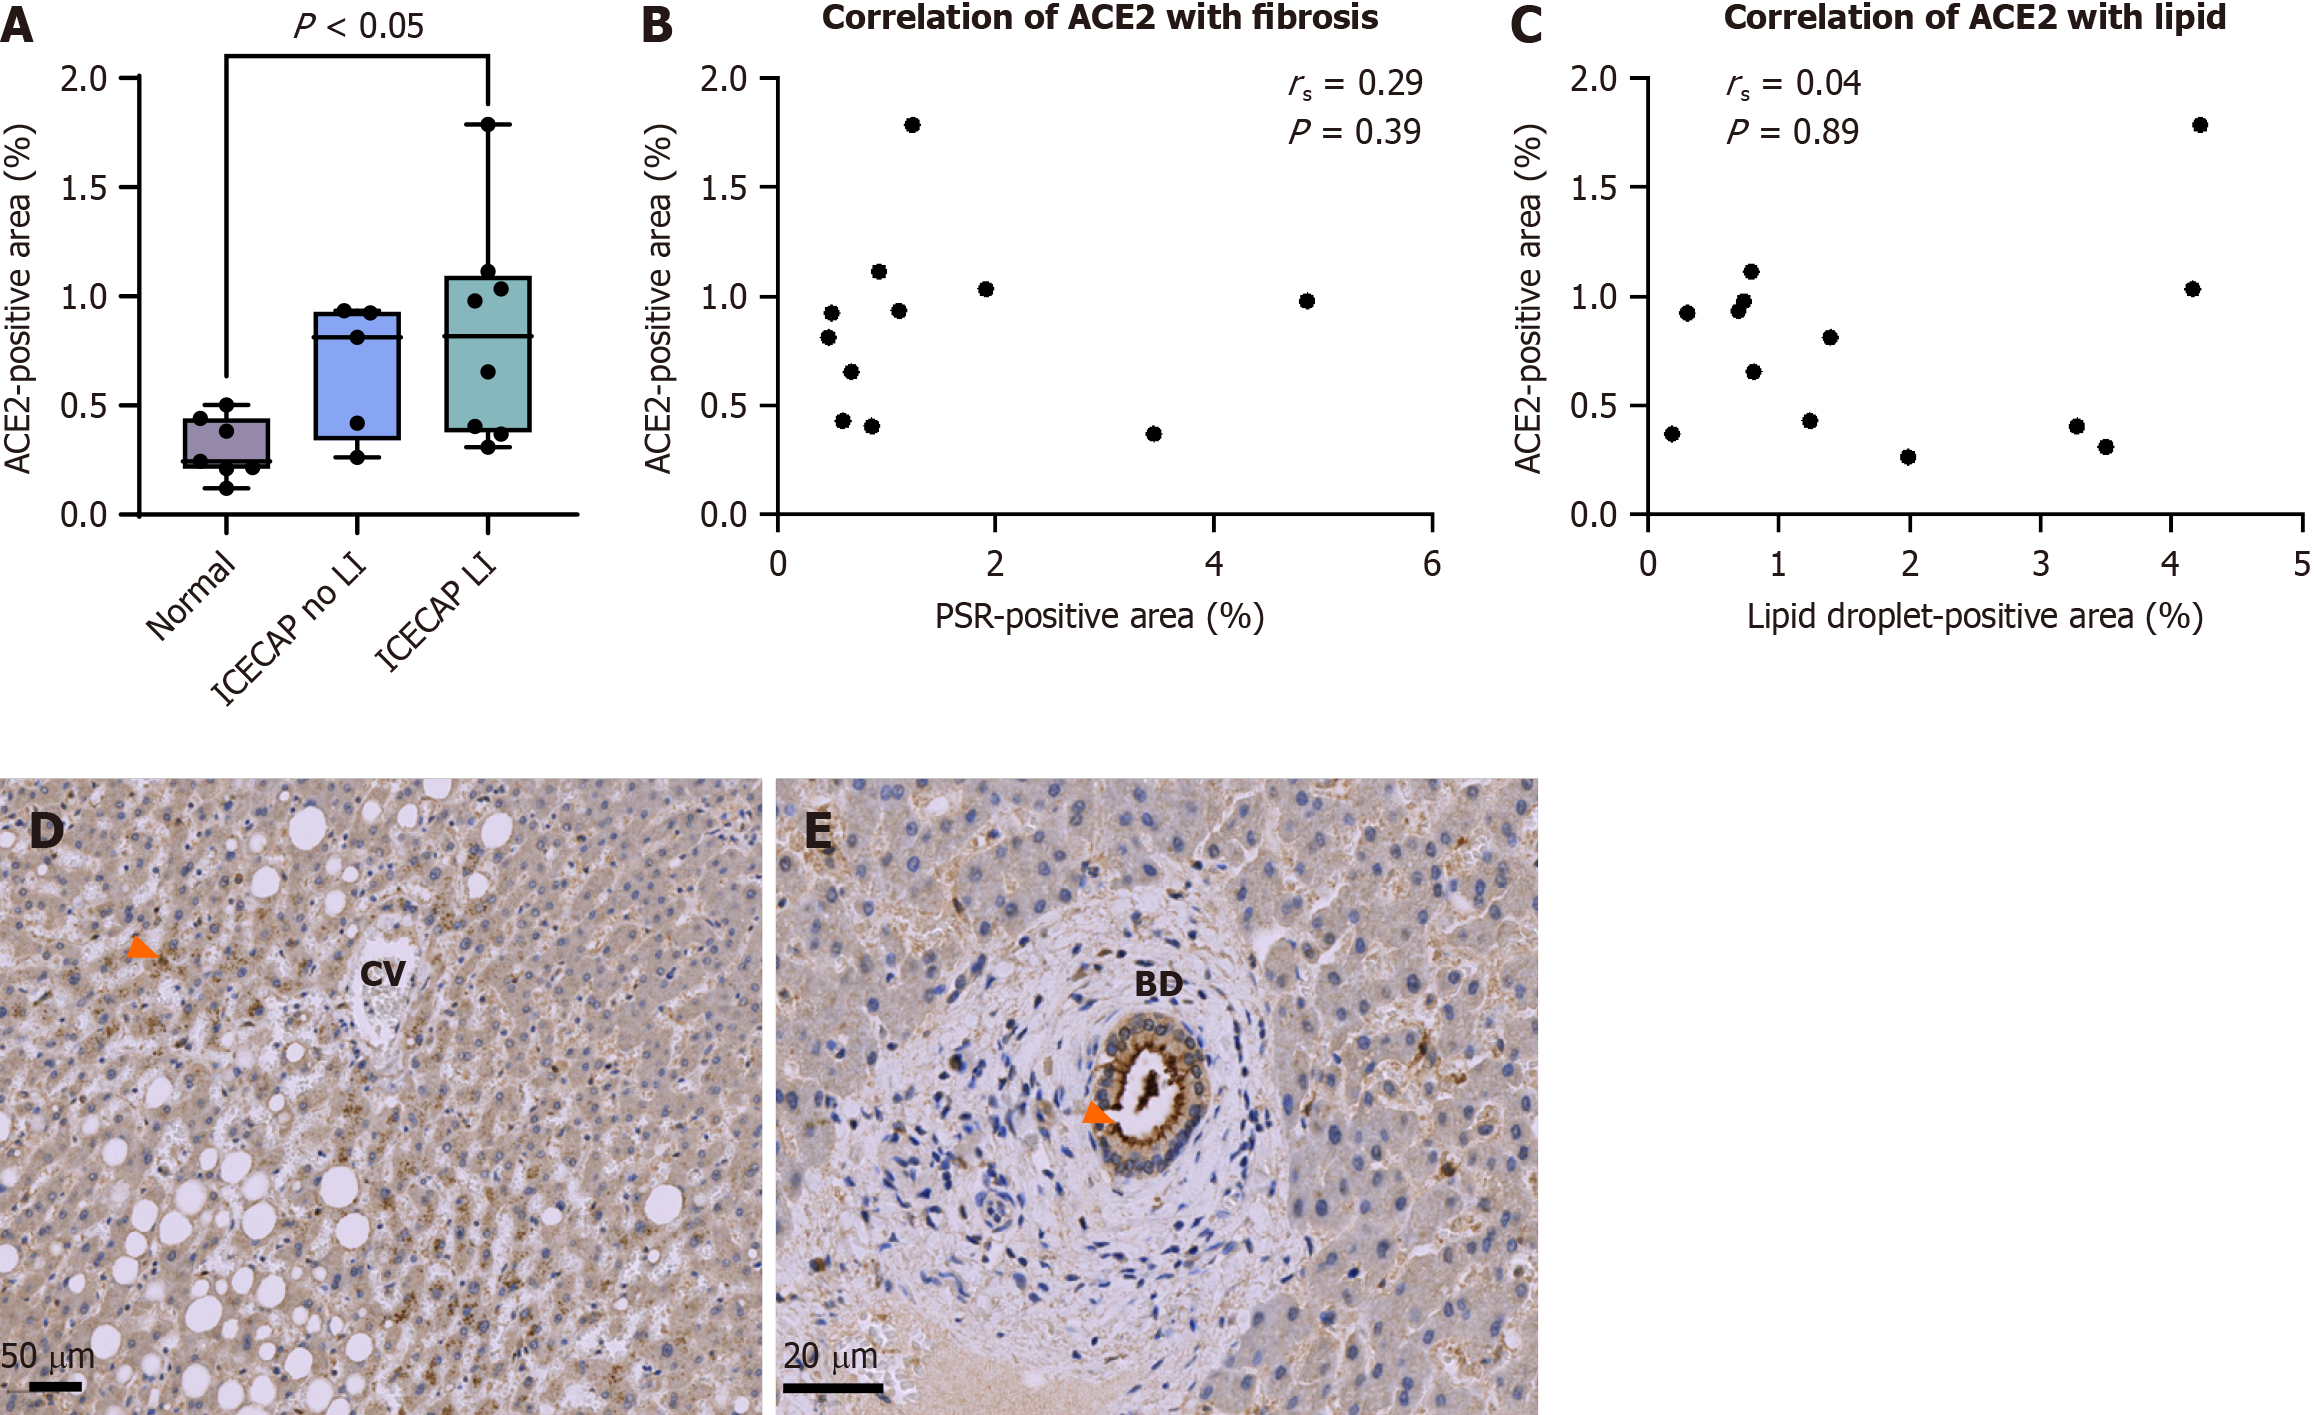
Figure 4 Angiotensin-converting enzyme 2 protein levels are increased in post-mortem livers of patients who died with severe coronavirus disease 2019.
A: Computational quantification of hepatic angiotensin-converting enzyme 2 (ACE2) protein immunostaining in post-mortem tissue sections from the coronavirus disease-19 ‘Exploration of Critical Aspects of Pathogenesis’ (ICECAP) patient cohort with and without histopathological evidence of liver injury (LI) (ICECAP + LI and ICECAP no LI), including steatosis and/or fibrosis. Groups were compared by one-way ANOVA with Bonferroni’s post-hoc test (Normal vs ICECAP + LI: P < 0.05, comparison of Normal vs ICECAP no LI not statistically significant); B: Correlation between histological fibrosis (picrosirius red-positive area) and hepatic ACE2 protein levels (ACE2-positive area) assessed by Spearman’s correlation coefficient: rs = 0.29, P = 0.39, not statistically significant; C: Correlation between lipid droplet content (lipid droplet positive-area) and hepatic ACE2 protein levels (ACE2-positive area) assessed by Spearman’s correlation coefficient: rs = 0.04, P = 0.89, not statistically significant; D: Representative image showing granular ACE2 immunostaining pattern (arrowhead) in the cytoplasm of hepatocytes in pericentral areas of the liver lobule (central vein) in a steatotic post-mortem liver. Scale bar: 50 µm; E: Representative image showing a bile duct is shown with strong and specific staining localised to the apical membrane of cholangiocytes (arrowhead). Scale bar: 20 µm. ACE2: Angiotensin-converting enzyme 2; LI: Liver injury. CV: Central vein; BD: Bile duct.
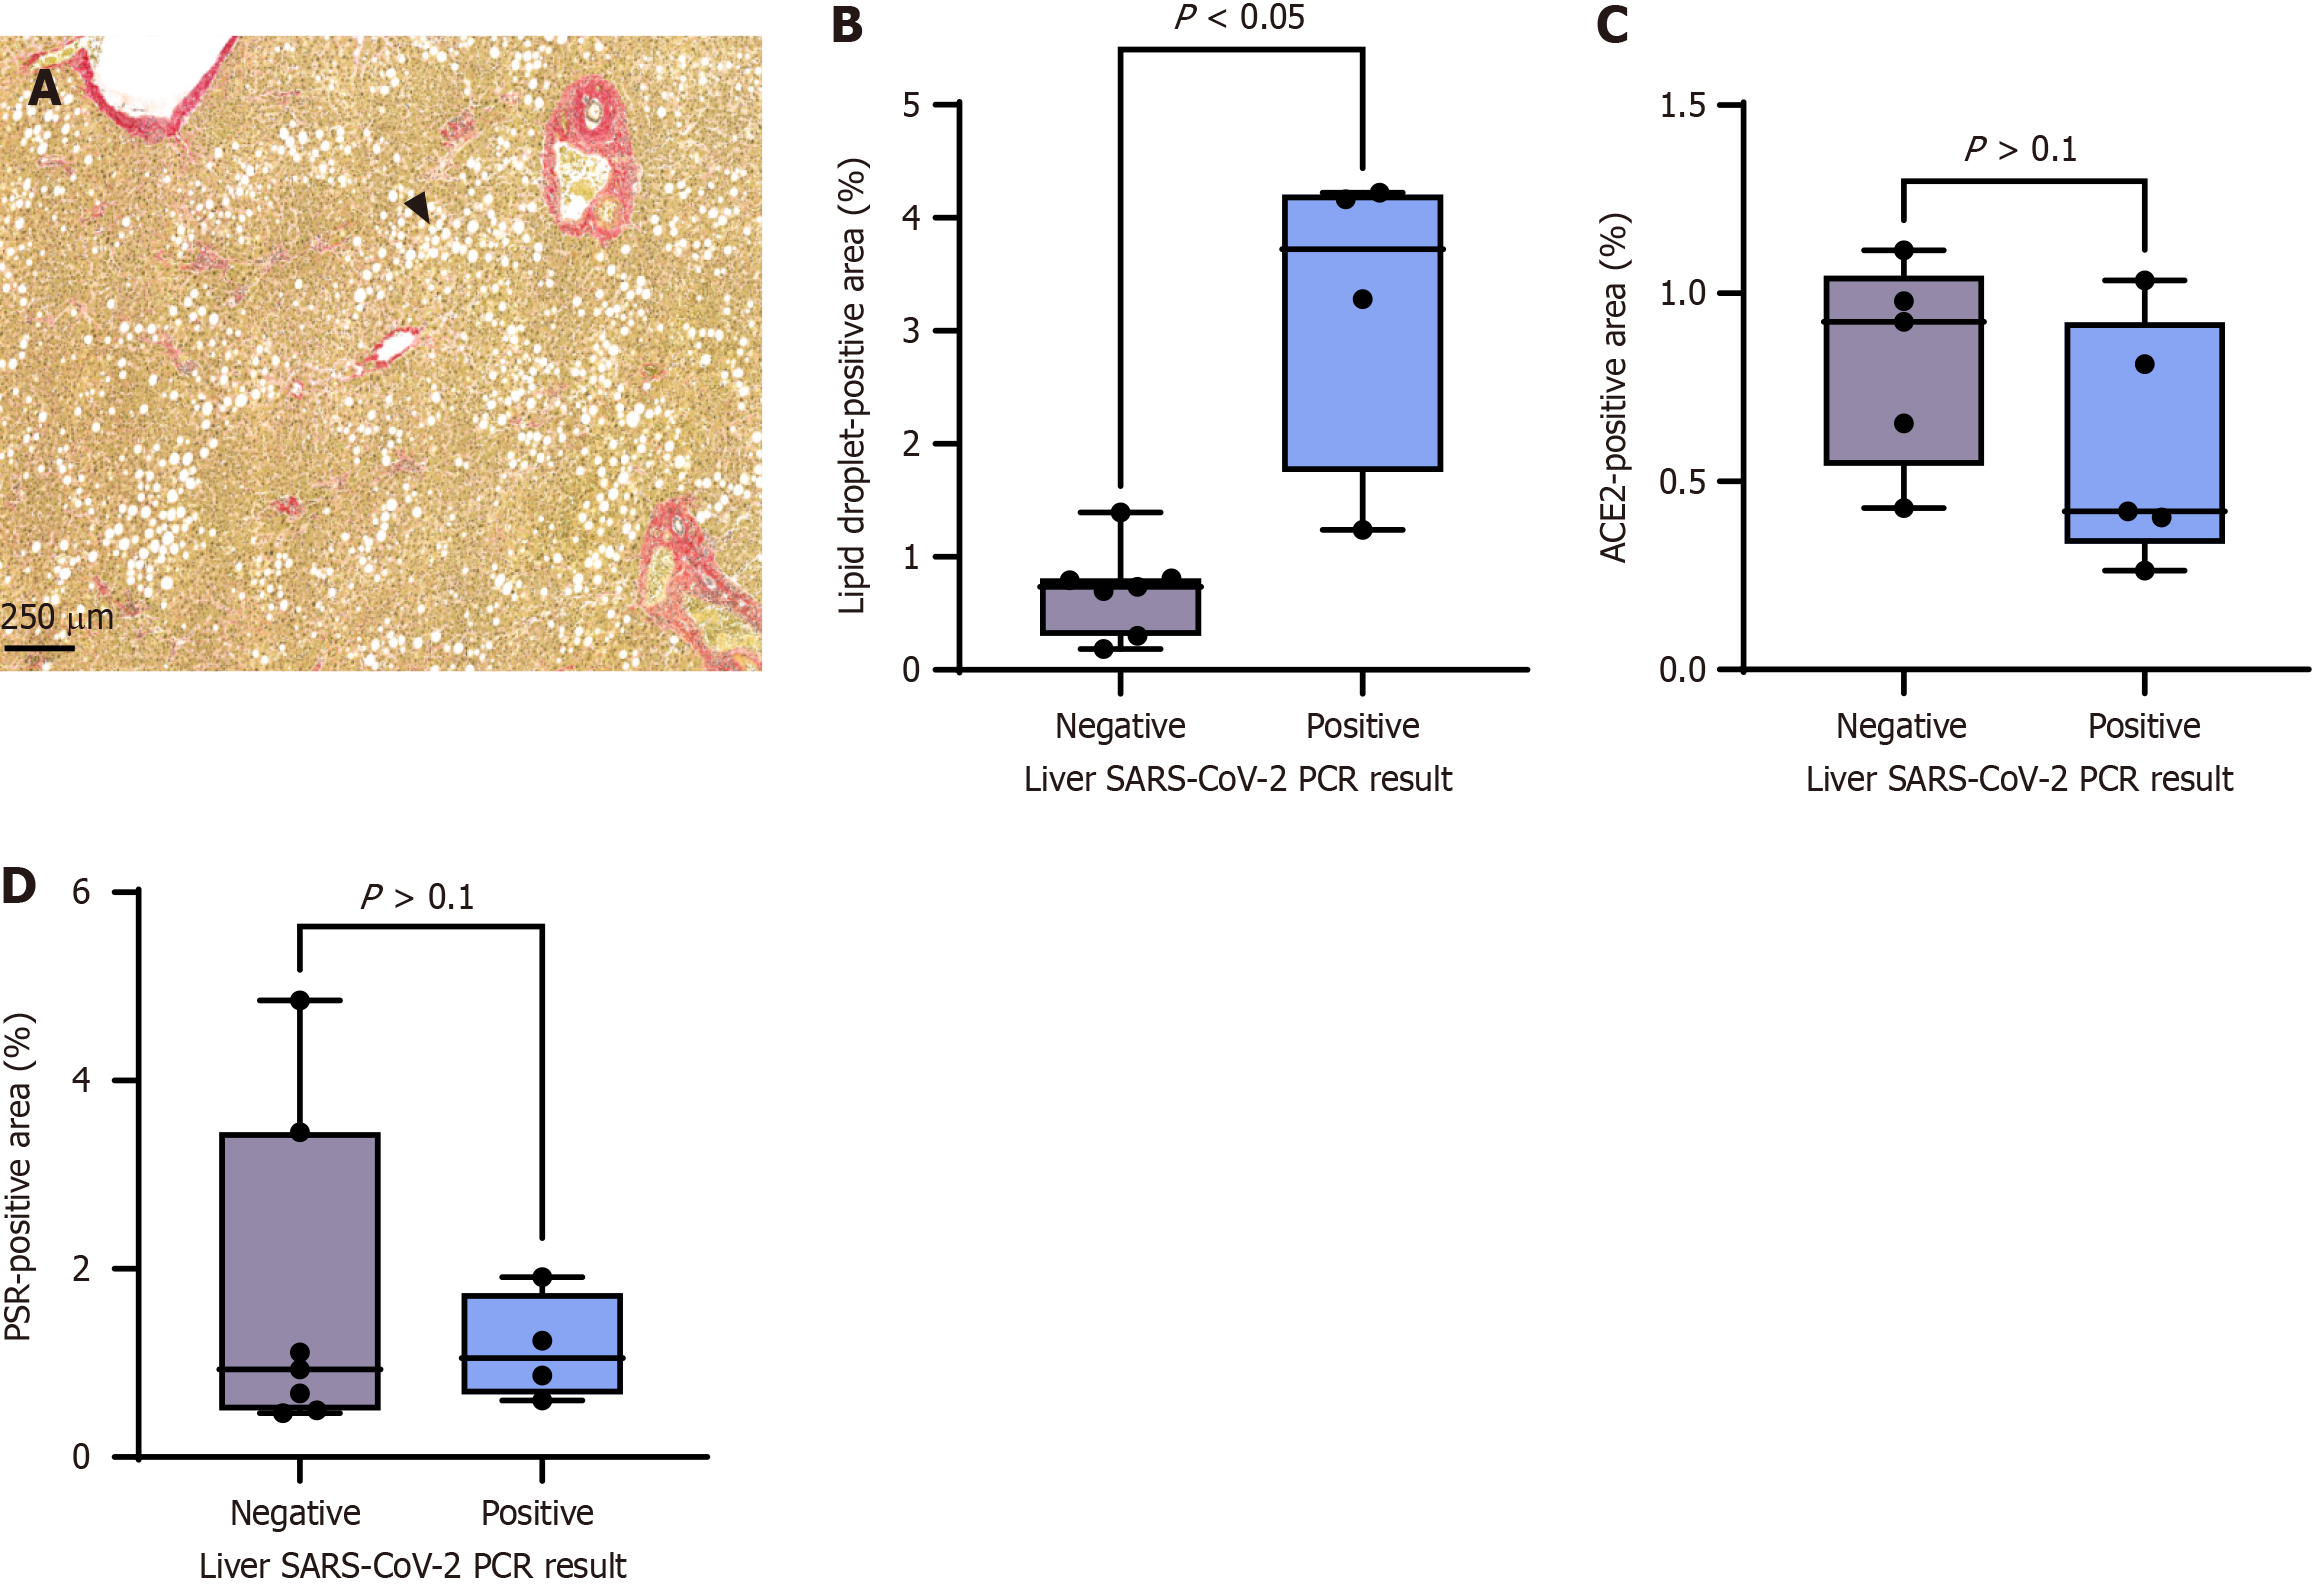
Figure 5 Hepatic lipid droplet content correlates with detectable severe acute respiratory syndrome coronavirus 2 RNA.
A: Representative image showing extensive hepatocellular steatosis (arrowhead) in a post-mortem liver section from an ICECAP study patient who died with severe coronavirus disease-19. Scale bar: 250 µm; B: Hepatic lipid droplet content (lipid droplet-positive area); C: Hepatic angiotensin-converting enzyme 2 (ACE2) protein levels (ACE2-positive area); D: Histological fibrosis (picrosirius red-positive area) in ICECAP patient post-mortem liver sections were compared with the presence or absence of detectable liver severe acute respiratory syndrome coronavirus 2 (SARS-CoV-2) viral RNA (liver SARS-Cov-2 PCR result), in the ICECAP study patient cohort[17], using the Mann-Whitney test for unpaired group comparisons (hepatic lipid droplet content vs detectable liver SARS-CoV-2 viral RNA P < 0.05; other comparisons not statistically significant). PSR: Picrosirius red; SARS-CoV-2: Severe acute respiratory syndrome coronavirus 2.
- Citation: Jacobs AK, Morley SD, Samuel K, Morgan K, Boswell L, Kendall TJ, Dorward DA, Fallowfield JA, Hayes PC, Plevris JN. Hepatic angiotensin-converting enzyme 2 expression in metabolic dysfunction-associated steatotic liver disease and in patients with fatal COVID-19. World J Gastroenterol 2024; 30(31): 3705-3716
- URL: https://www.wjgnet.com/1007-9327/full/v30/i31/3705.htm
- DOI: https://dx.doi.org/10.3748/wjg.v30.i31.3705


