Copyright
©The Author(s) 2024.
World J Gastroenterol. Aug 21, 2024; 30(31): 3680-3688
Published online Aug 21, 2024. doi: 10.3748/wjg.v30.i31.3680
Published online Aug 21, 2024. doi: 10.3748/wjg.v30.i31.3680
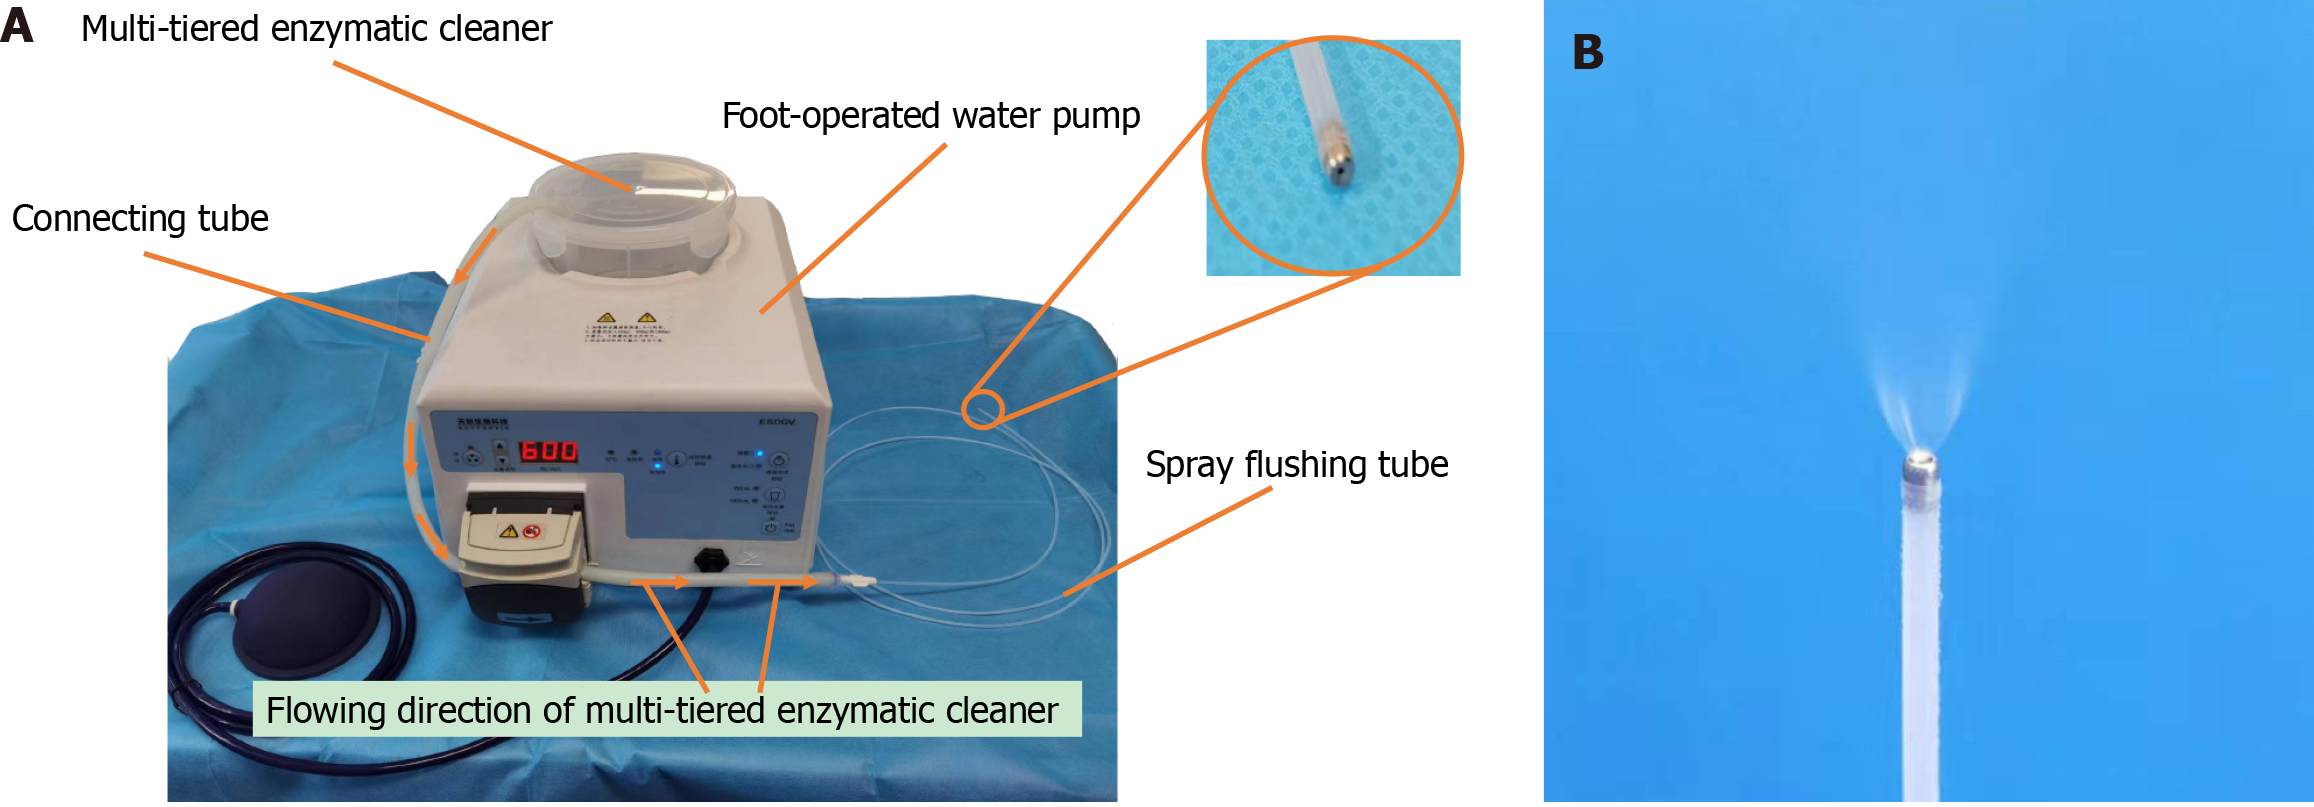
Figure 1 Spray flushing system.
A: Components of the spray flushing system; B: Spray flushing effect.
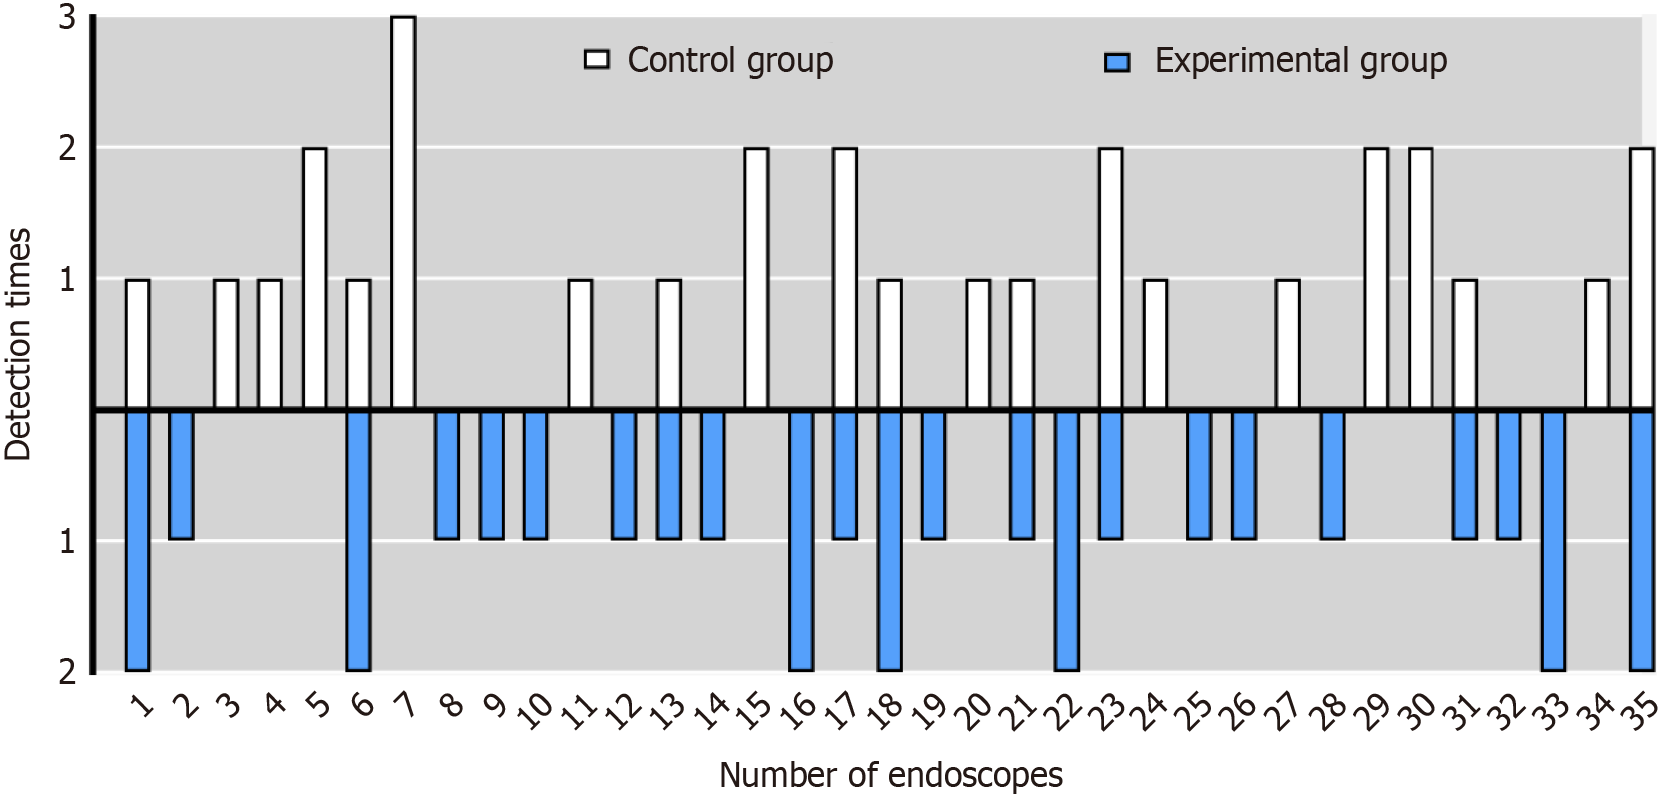
Figure 2 Different endoscopic detection times.
The horizontal axis represents number of endoscopes, and the vertical axis represents number of detections.
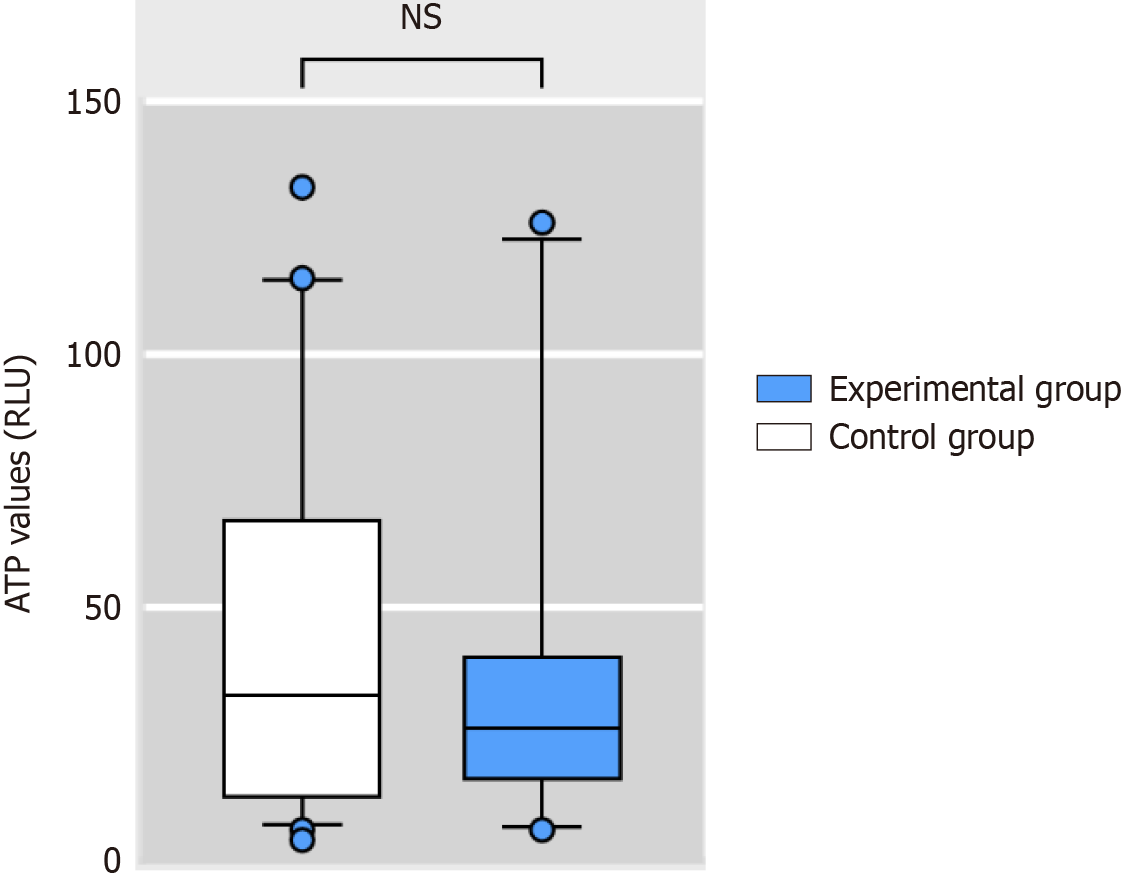
Figure 3 Differences in ATP concentration within the endoscopic working channel.
NS: No significance.
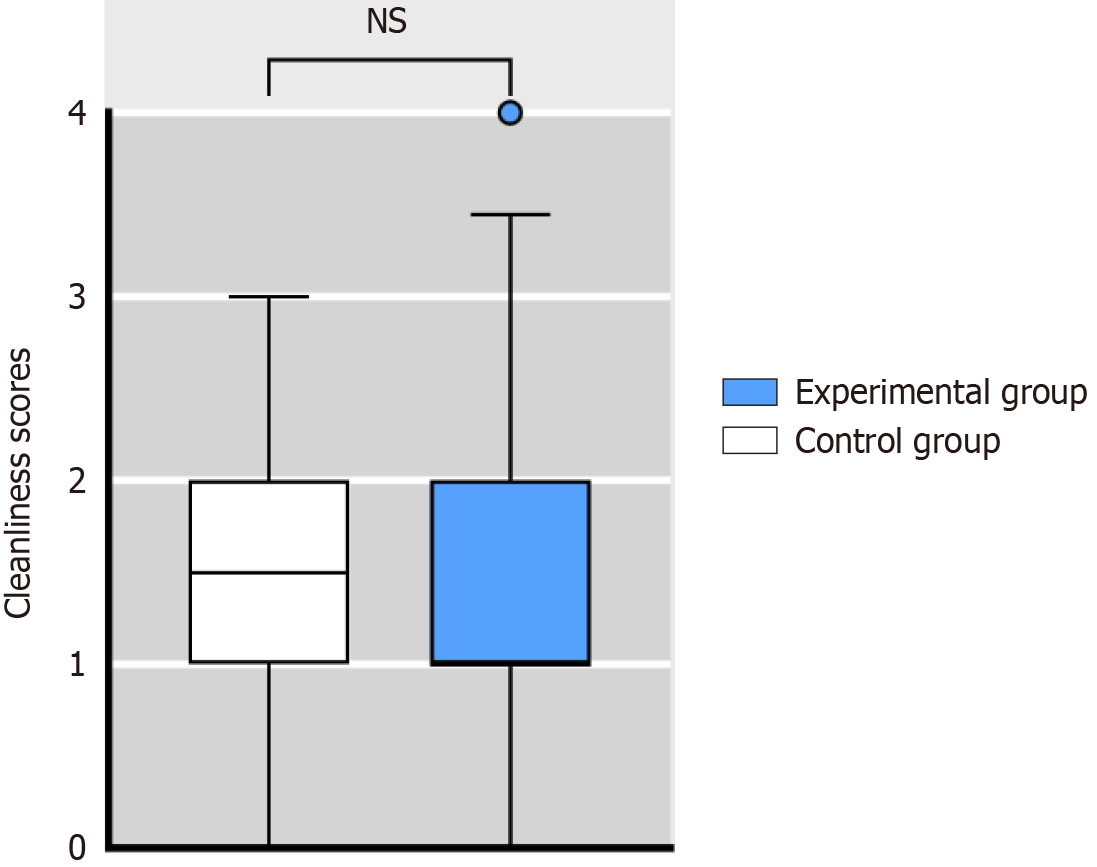
Figure 4 Differences in the cleanliness scores of endoscopic working channels.
NS: No significance.
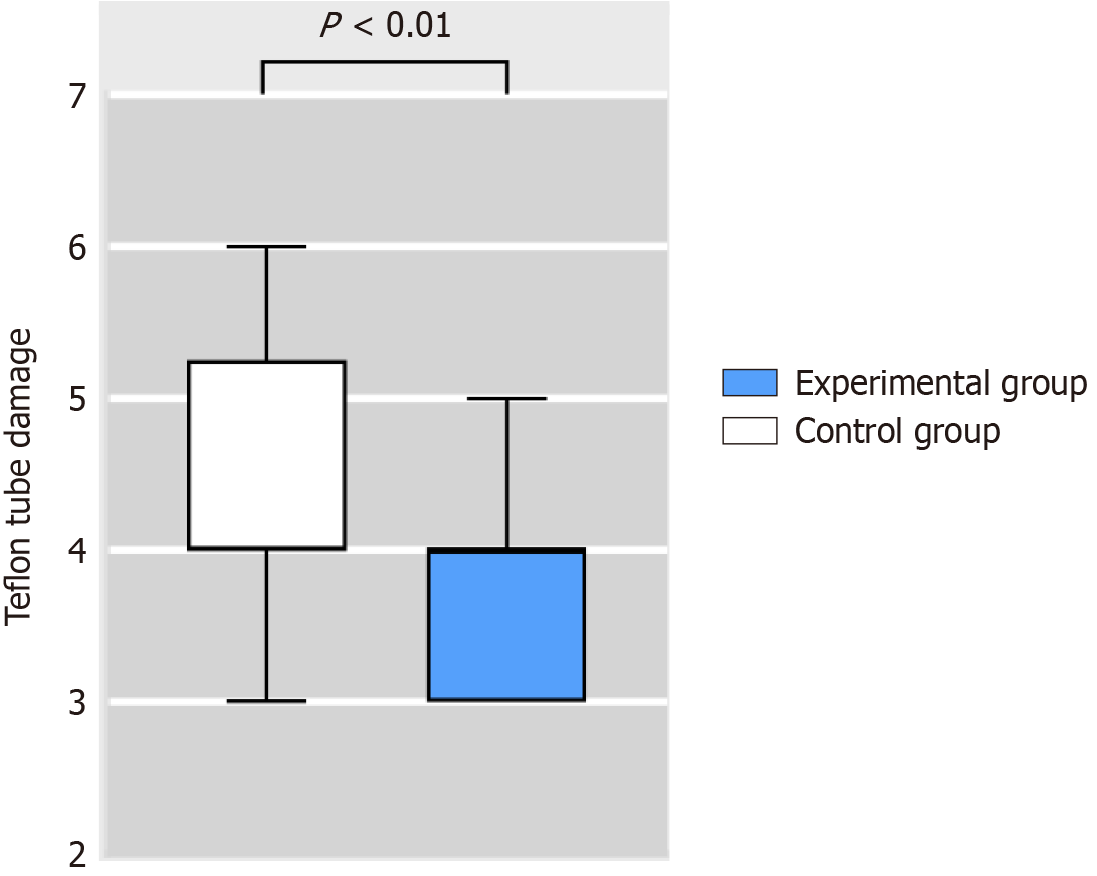
Figure 5 Differences in Teflon tube damage.
- Citation: Du J, Zhang M, Tao SY, Ye LS, Gong H, Hu B, Zhang QY, Qiao F. Efficacy of spray flushing in the reprocessing of flexible endoscopes: A randomized controlled trial. World J Gastroenterol 2024; 30(31): 3680-3688
- URL: https://www.wjgnet.com/1007-9327/full/v30/i31/3680.htm
- DOI: https://dx.doi.org/10.3748/wjg.v30.i31.3680


