Copyright
©The Author(s) 2024.
World J Gastroenterol. Aug 14, 2024; 30(30): 3584-3608
Published online Aug 14, 2024. doi: 10.3748/wjg.v30.i30.3584
Published online Aug 14, 2024. doi: 10.3748/wjg.v30.i30.3584
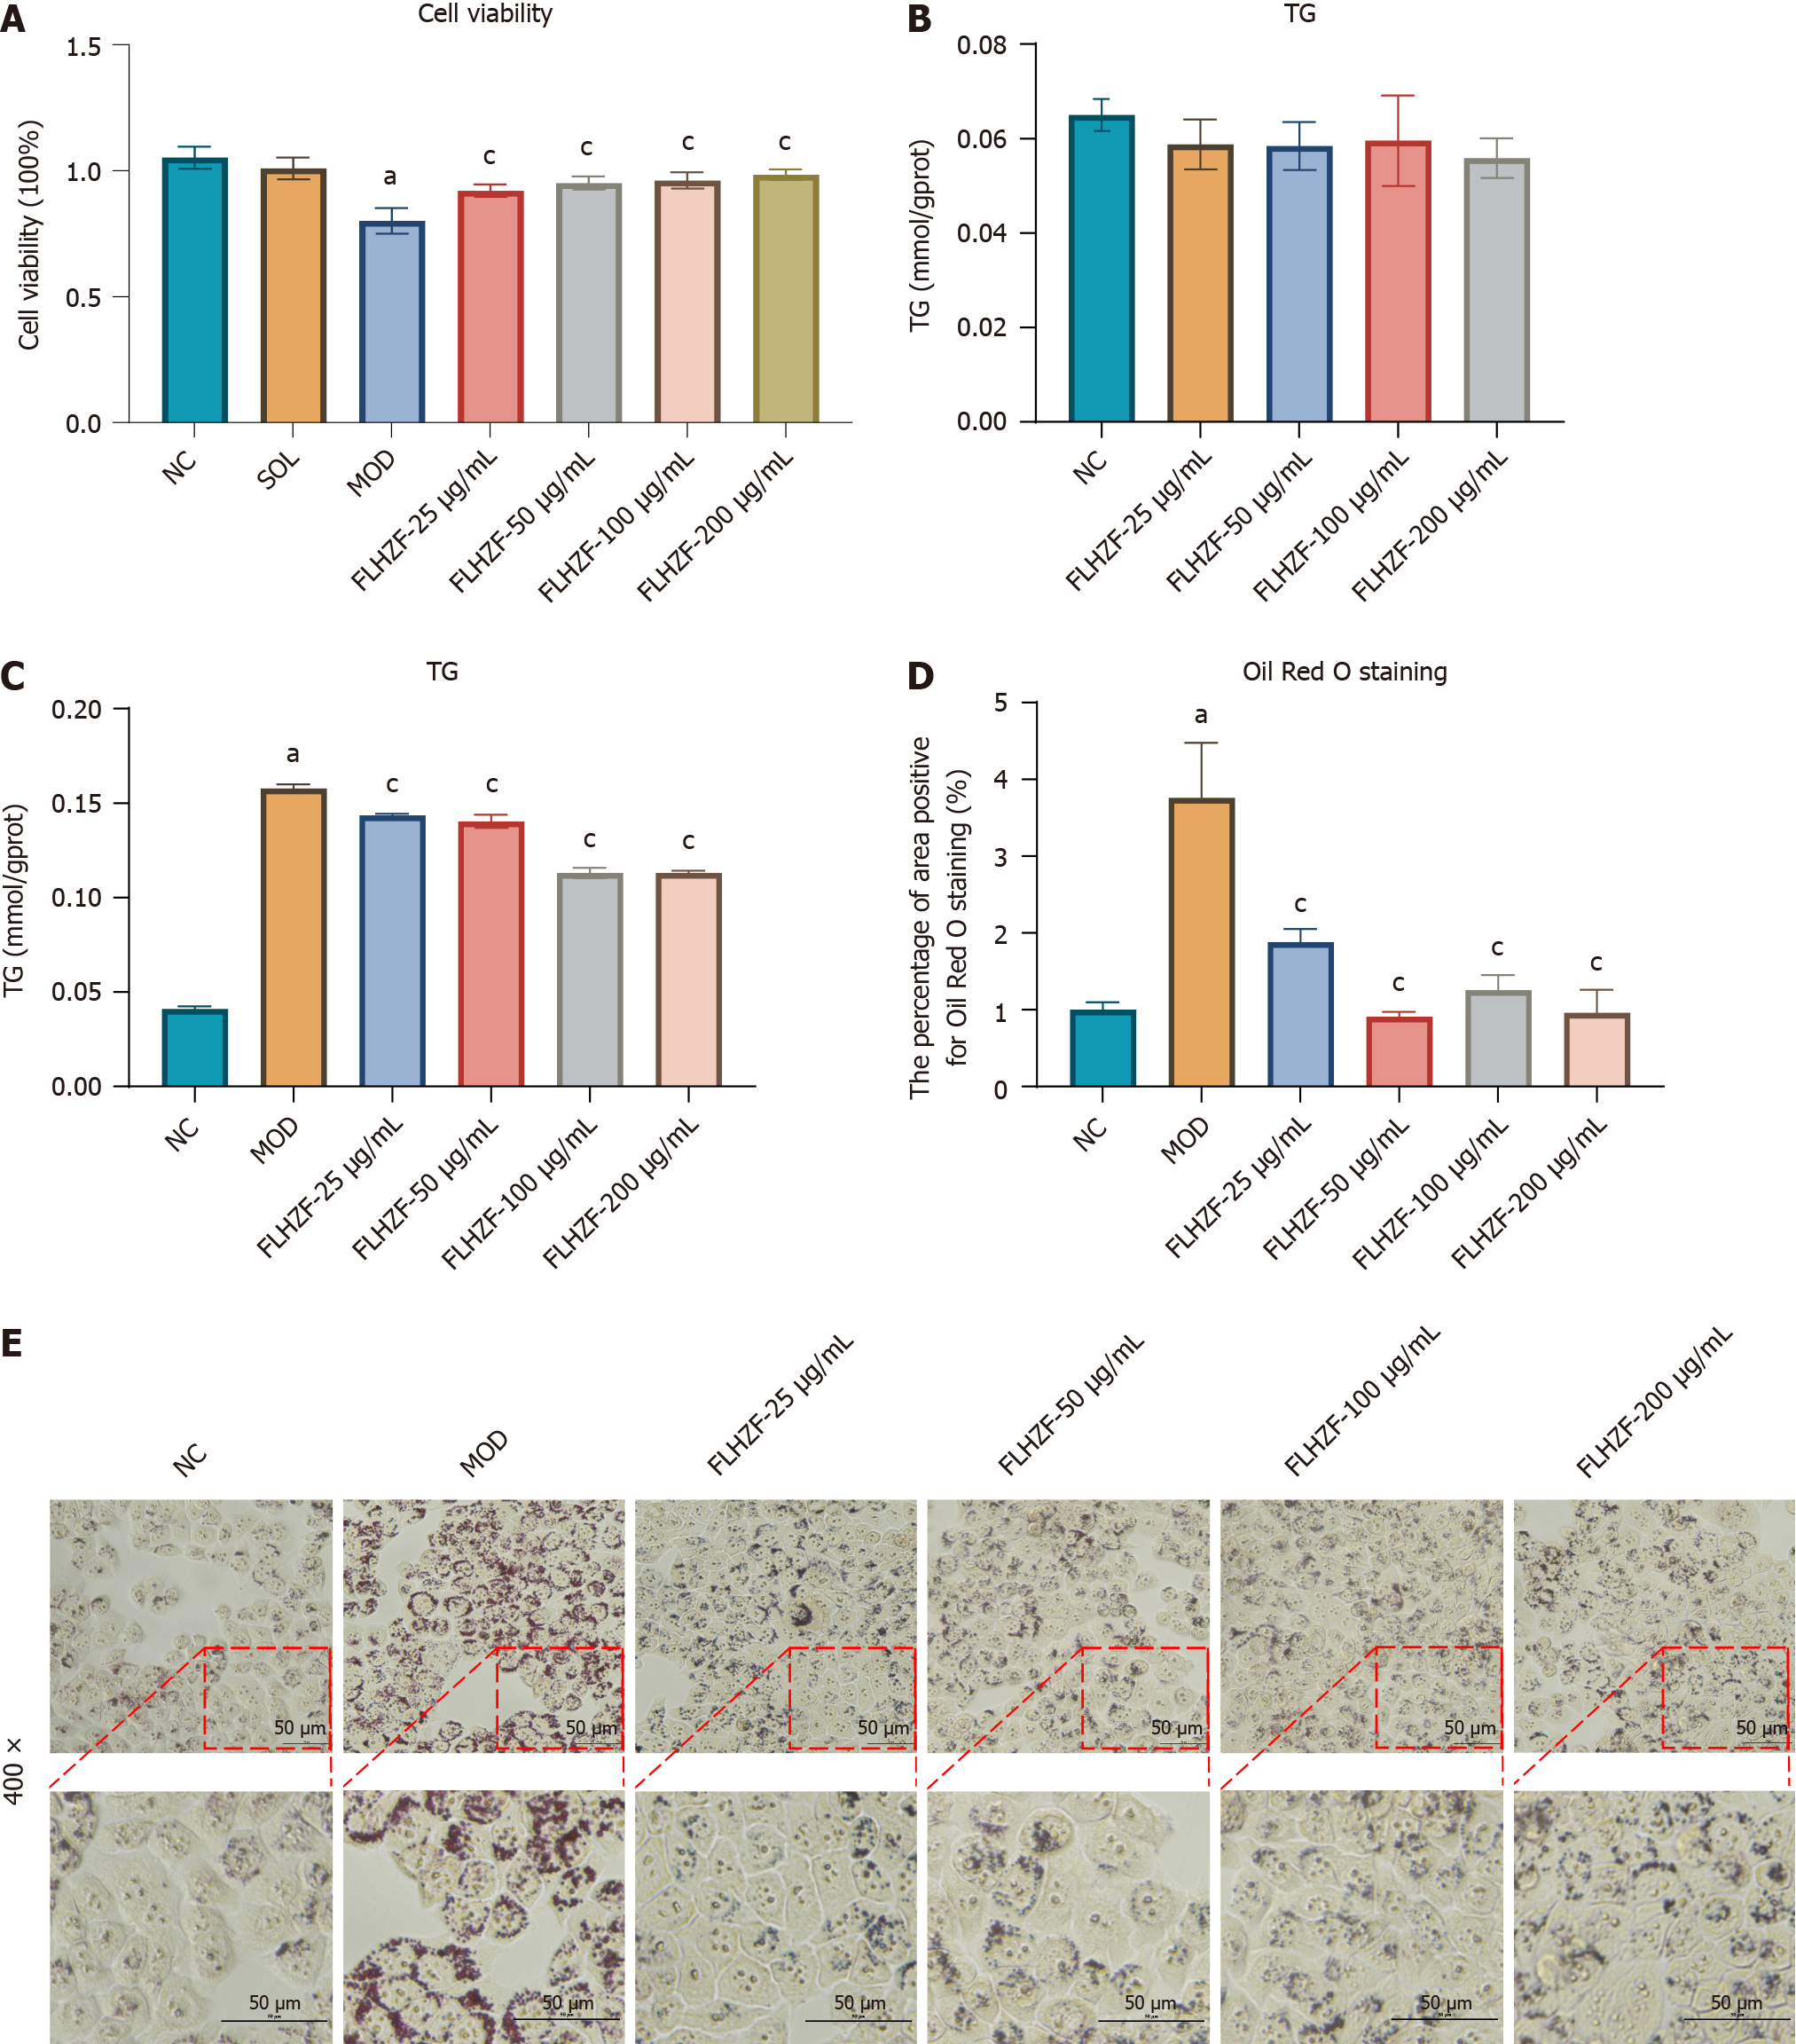
Figure 1 Fanlian Huazhuo Formula group reduced lipid droplets deposition in HepG2 cells induced by free fatty acid.
A: Cell viability with Fanlian Huazhuo Formula group (FLHZF) treatment in free fatty acids (FFAs)-induced HepG2 cells tested by cell counting kit-8 (n = 3); B: Cell triglyceride (TG) content without or with FLHZF treatment in HepG2 cells (n = 3); C: Cell TG content with FLHZF treatment in FFA-induced HepG2 cells (n = 3); D: Percentage of area positive for Oil Red O staining in HepG2 cells (n = 3); E: Representative images of FFA-induced HepG2 cells of Oil Red O staining, magnification 400 ×. Data are presented as mean ± SE. aP < 0.05 vs NC group, cP < 0.05 vs MOD group. NC: Negative control group; SOL: Solvent group MOD: Model group; FLHZF: Fanlian Huazhuo Formula group; TG: Triglyceride.
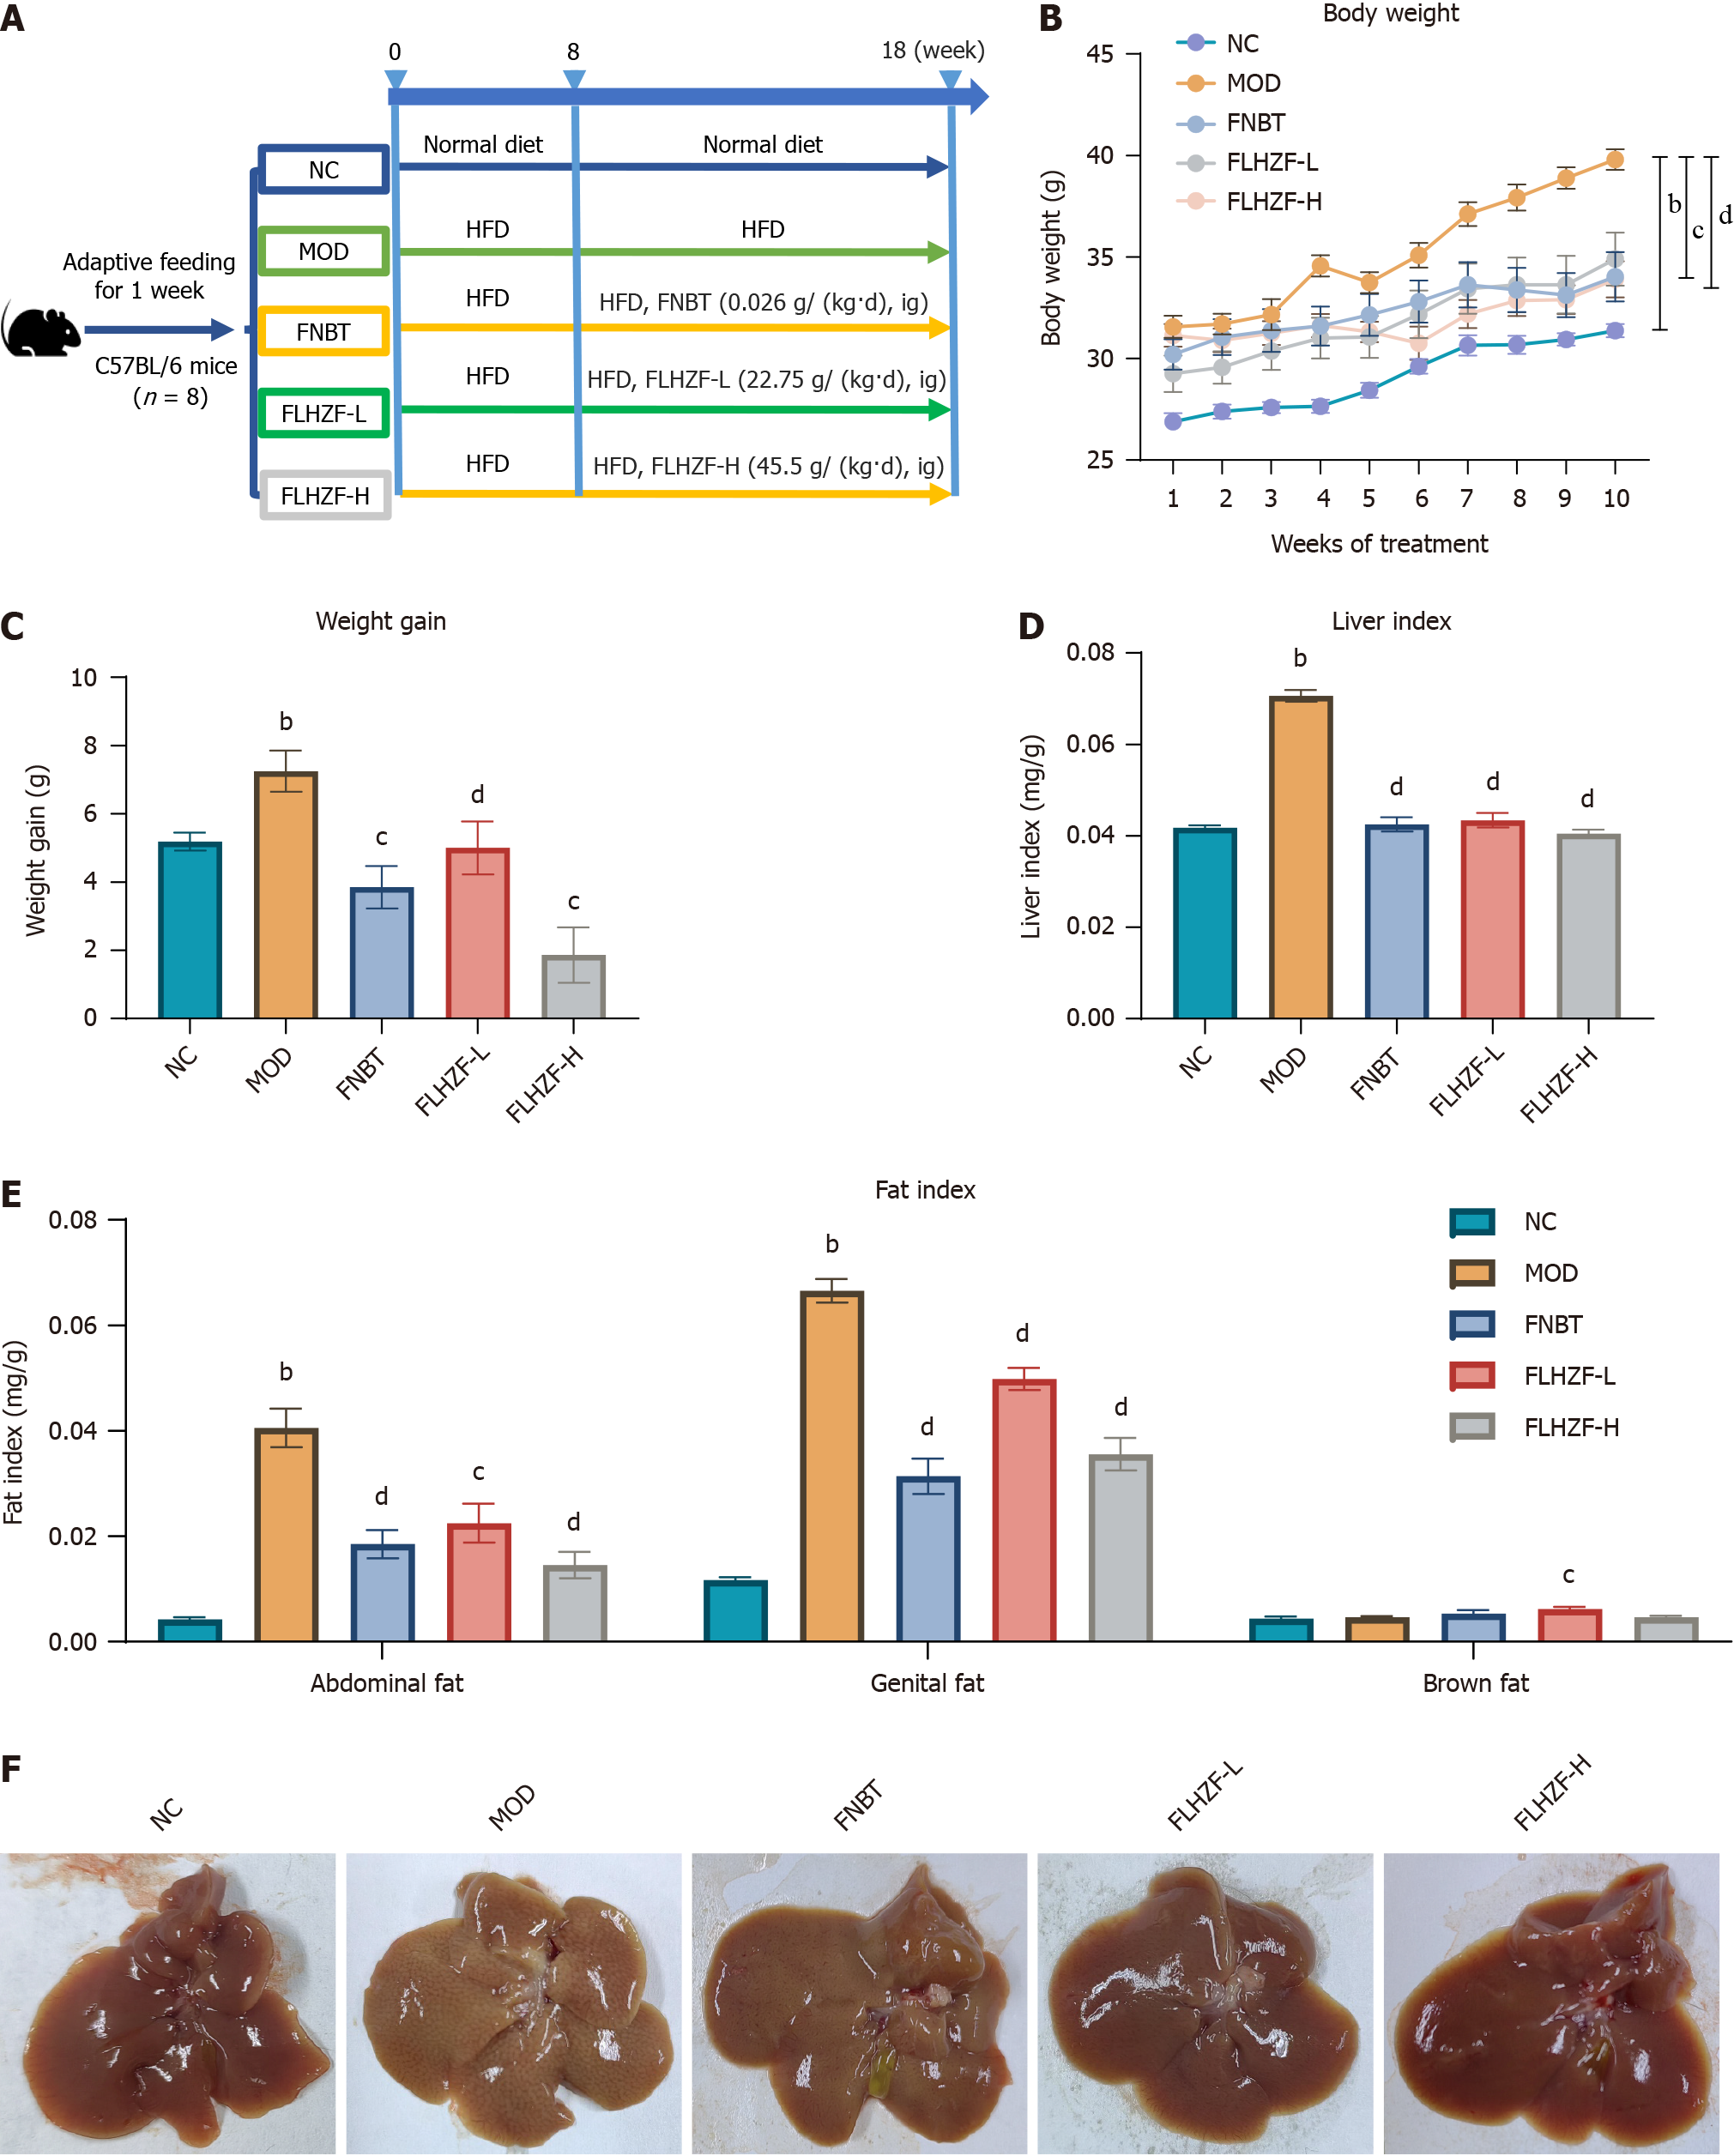
Figure 2 Effects of Fanlian Huazhuo Formula group on symptoms associated with nonalcoholic fatty liver disease mice.
A: Flow chart of animal experiment protocol; B: Body weight of mice once a week for 10 weeks (n = 8); C: Weight change (pre-treatment weight minus post-treatment weight) of mice (n = 8); D: Liver index of nonalcoholic fatty liver disease (NAFLD) mice (n = 8); E: Fat index of NAFLD mice (n = 8); F: Representative images of livers after 10 weeks intervention in mice. Data are presented as mean ± SE. bP < 0.01 vs NC group, cP < 0.05 vs MOD group, dP < 0.01 vs MOD group. NC: Negative control group; MOD: Model group; FNBT: Fenofibrate group; FLHZF-L: Low dose of Fanlian Huazhuo Formula group; FLHZF-H: High dose of Fanlian Huazhuo Formula group.
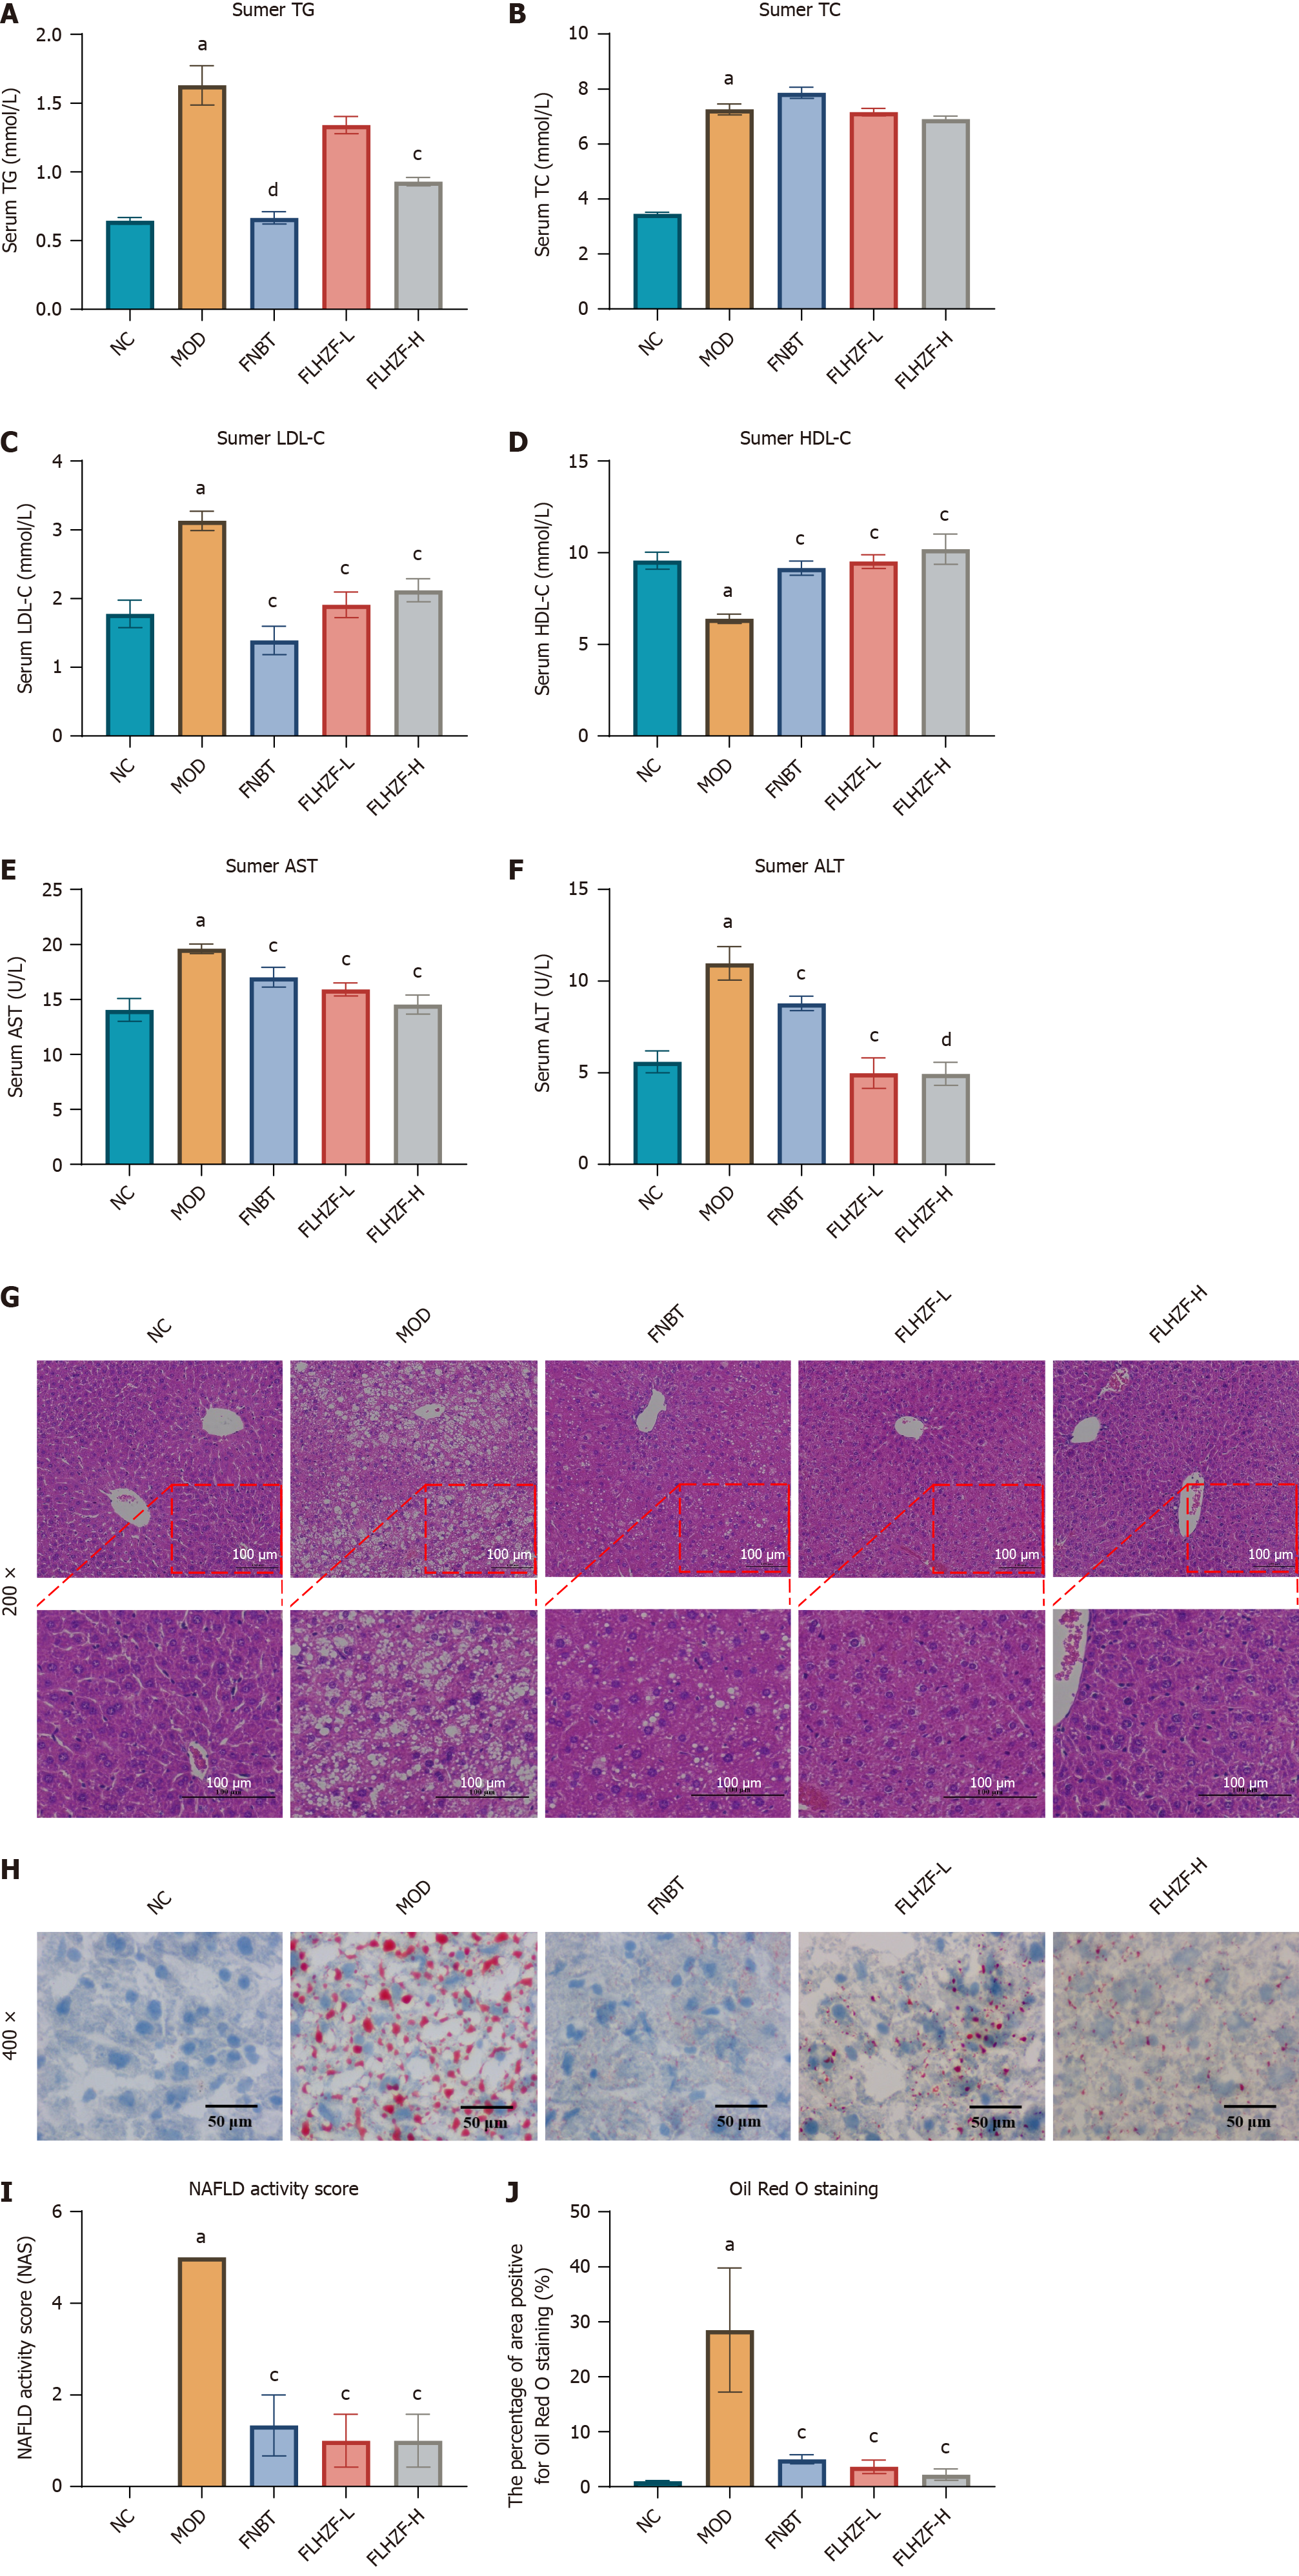
Figure 3 Effects of Fanlian Huazhuo Formula group on abnormal lipid levels and liver injuries in high-fat diet-induced mice.
A: Serum levels of triglyceride in each group (n = 8); B: Serum levels of total cholesterol in each group (n = 8); C: Serum levels of low-density lipoprotein cholesterol in each group (n = 8); D: Serum levels of high-density lipoprotein cholesterol in each group (n = 8); E and F: Liver injury markers of aspartate aminotransferase and alanine aminotransferase in each group (n = 8); G: Representative images of livers with hematoxylin and eosin (HE) staining in each group, magnification 200 ×; H: Representative images of livers with Oil Red O staining in each group, magnification 400 ×; I: Nonalcoholic fatty liver disease Activity Score of HE staining (n = 3); J: Percentage of area positive for Oil Red O staining in liver tissue (n = 3). Data are presented as mean ± SE. aP < 0.05 vs NC group, cP < 0.05 vs MOD group, dP < 0.01 vs MOD group. TG: Triglyceride; TC: Total cholesterol; LDL-C: Low-density lipoprotein cholesterol; HDL-C: High-density lipoprotein cholesterol; AST: Aspartate aminotransferase; ALT: Alanine aminotransferase; NC: Negative control group; NAFLD: Nonalcoholic fatty liver disease; MOD: Model group; FNBT: Fenofibrate group; FLHZF-L: Low dose of Fanlian Huazhuo Formula group; FLHZF-H: High dose of Fanlian Huazhuo Formula group.
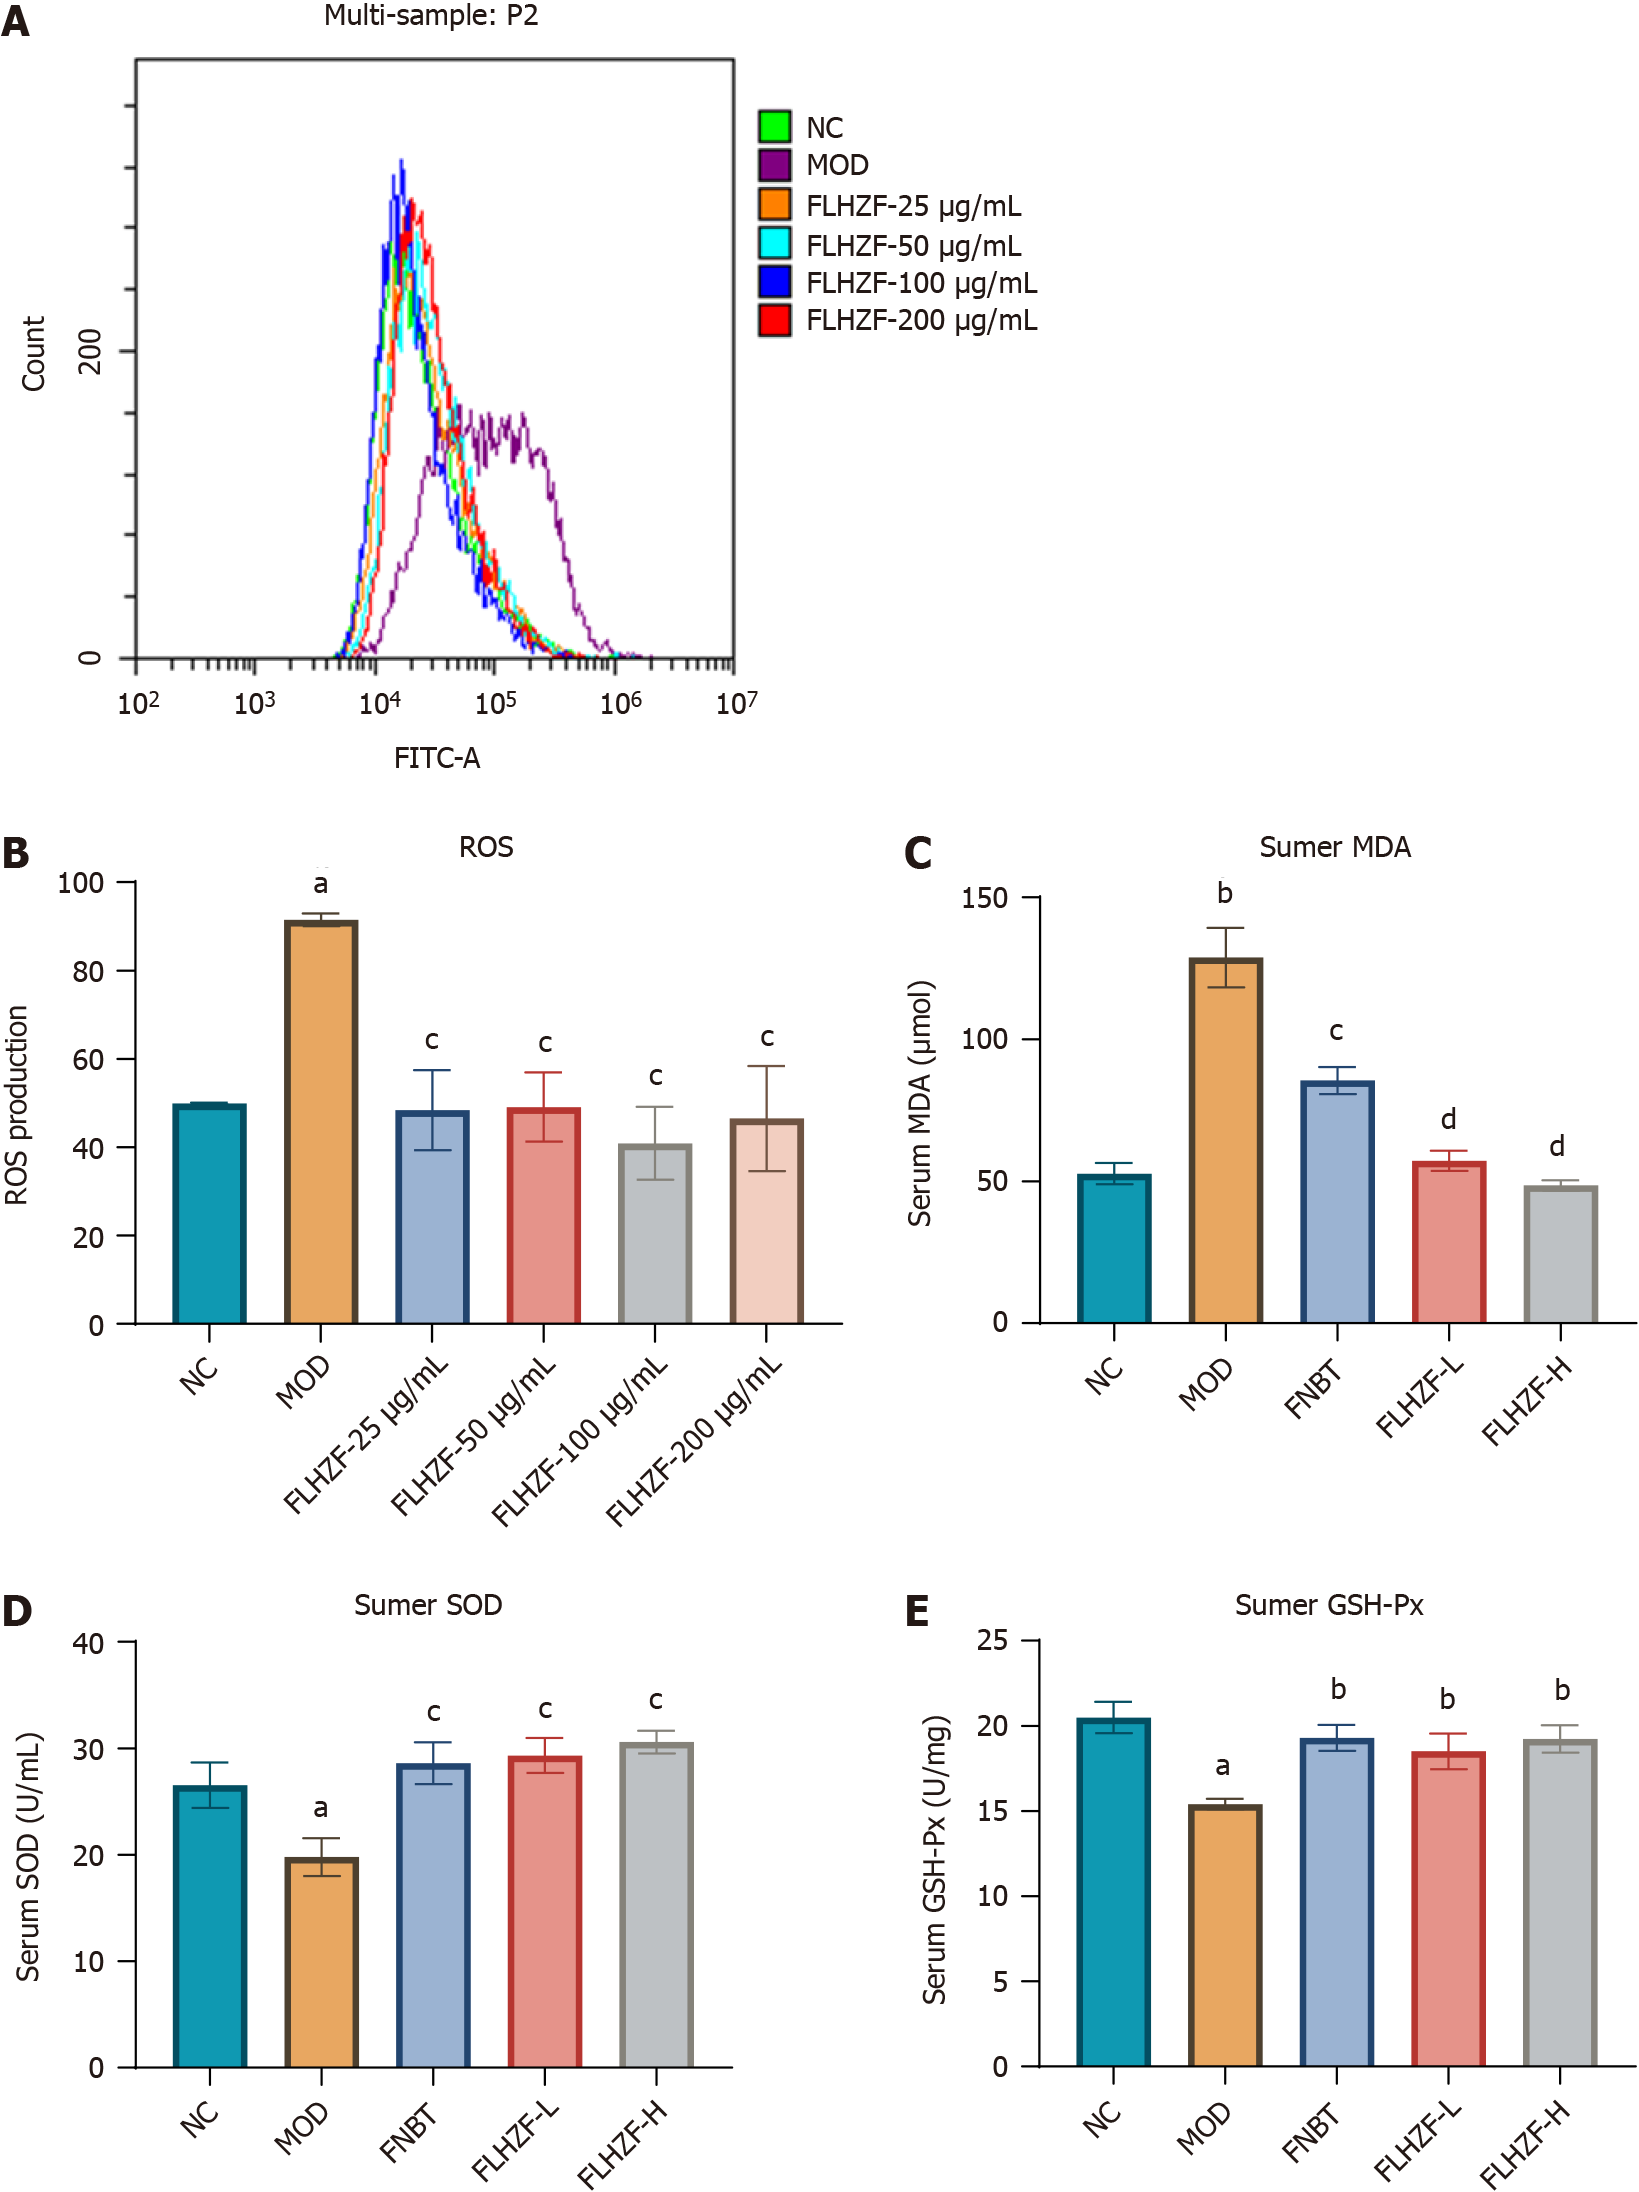
Figure 4 Fanlian Huazhuo Formula group reduced oxidative damage in vivo and in vitro.
A: Cell reactive oxygen species (ROS) content with Fanlian Huazhuo Formula group treatment in HepG2 cells induced by free fatty acid (n = 3); B: Quantitative result of cell ROS content (n = 3); C: Serum levels of malondialdehyde (n = 8); D: Serum levels of superoxide dismutase (n = 8); E: Serum levels of glutathione peroxidase (n = 8). Data are presented as mean ± SE. aP < 0.05 vs NC group, bP < 0.01 vs NC group, cP < 0.05 vs MOD group, dP < 0.01 vs MOD group. ROS: Reactive oxygen species; MDA: Malondialdehyde; SOD: Superoxide dismutase: GSH-Px: Glutathione peroxidase; NC: Negative control group; MOD: Model group; FNBT: Fenofibrate group; FLHZF-L: Low dose of Fanlian Huazhuo Formula group; FLHZF-H: High dose of Fanlian Huazhuo Formula group.
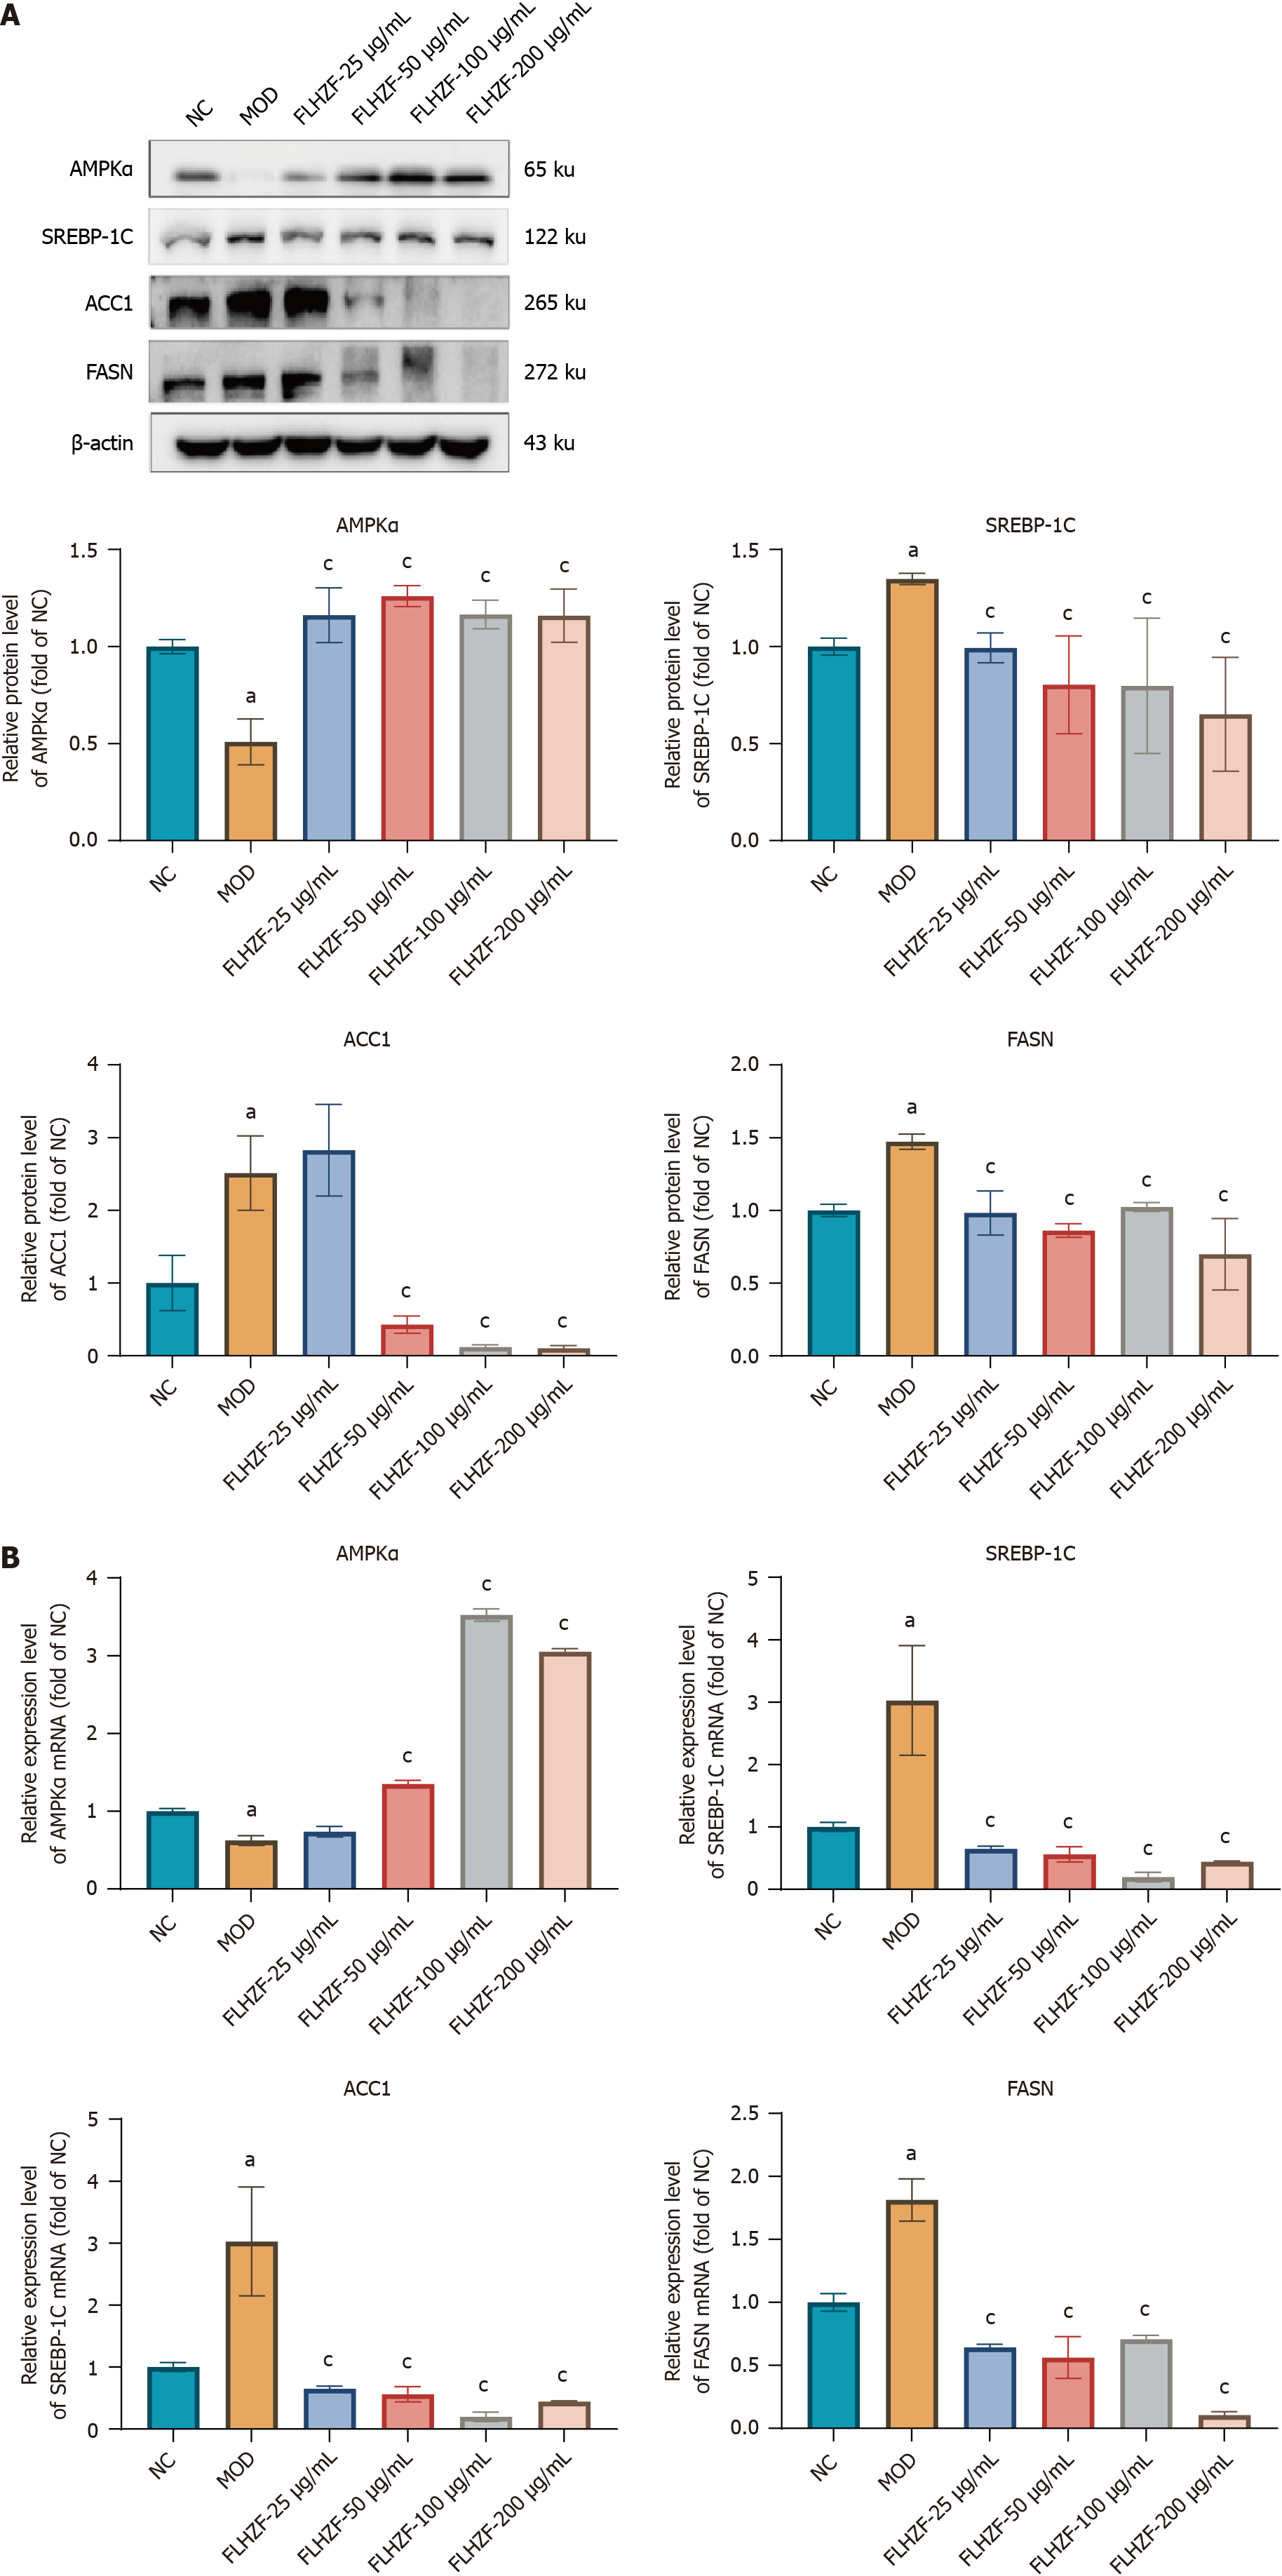
Figure 5 Fanlian Huazhuo Formula group regulated lipid synthesis signaling pathway in vitro.
A: Protein expression levels of AMPKα, SREBP-1C, ACC1, FASN and β-actin in HepG2 cells induced by free fatty acid (n = 3); B: Relative mRNA expression levels of AMPKα, SREBP-1C, ACC1 and FASN in HepG2 cells tested by real-time quantitative polymerase chain reaction (n = 3). Data are presented as mean ± SE. aP < 0.05 vs NC group, cP < 0.05 vs MOD group. NC: Negative control group; MOD: Model group; FLHZF: Fanlian Huazhuo Formula group.
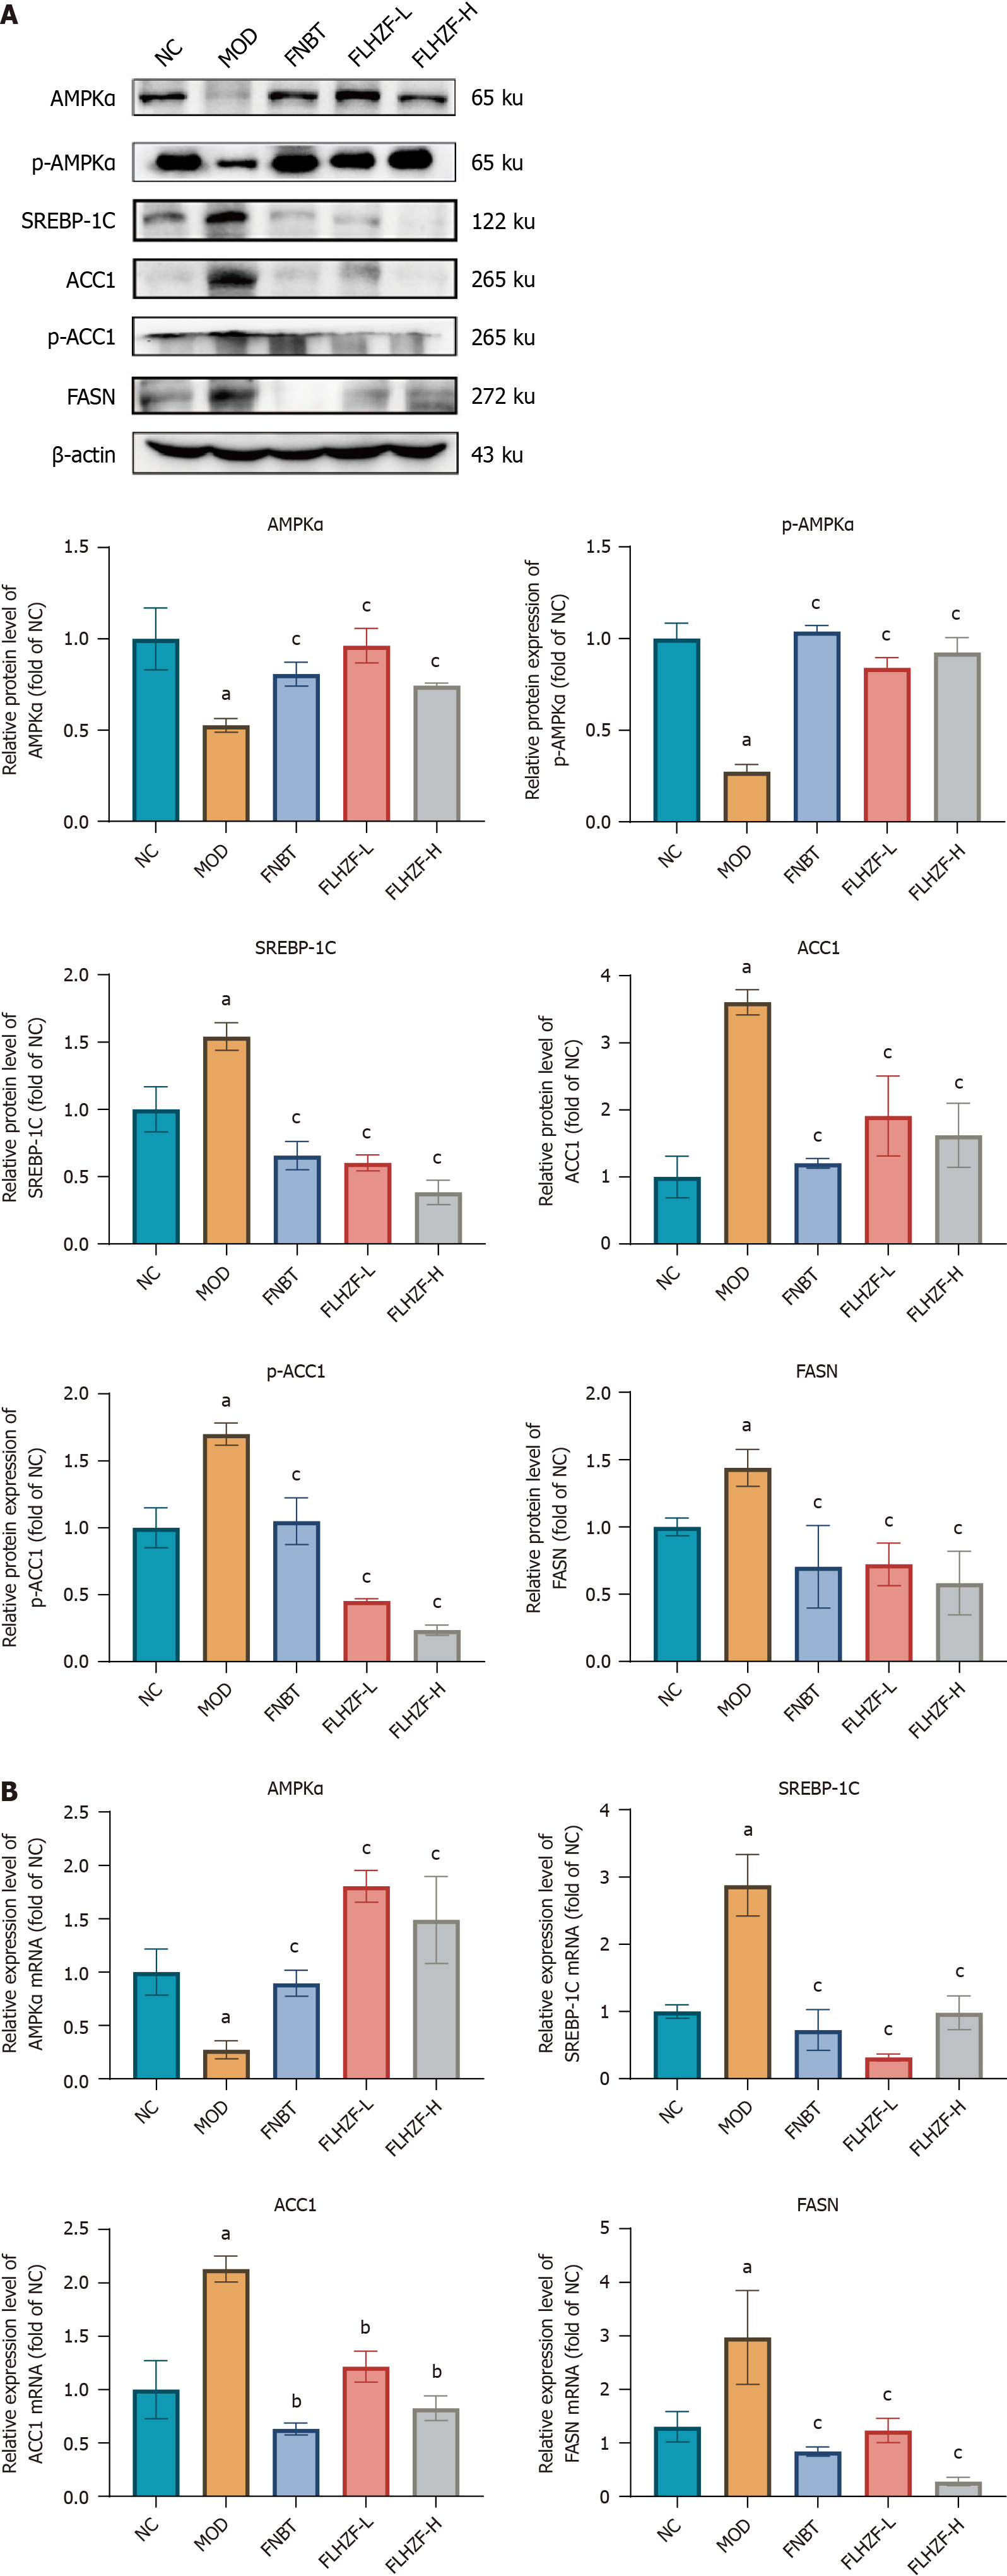
Figure 6 Fanlian Huazhuo Formula group regulated lipid synthesis signaling pathway in vivo.
A: Protein expression levels of AMPKα, SREBP-1C, ACC1 and FASN in mice liver (n = 3); B: Relative mRNA expression levels of AMPKα, SREBP-1C, ACC1 and FASN in mice liver (n = 3). Data are presented as mean ± SE. aP < 0.05 vs NC group, bP < 0.01 vs NC group, cP < 0.05 vs MOD group. NC: Negative control group; MOD: Model group; FNBT: Fenofibrate group; FLHZF-L: Low dose of Fanlian Huazhuo Formula group; FLHZF-H: High dose of Fanlian Huazhuo Formula group.
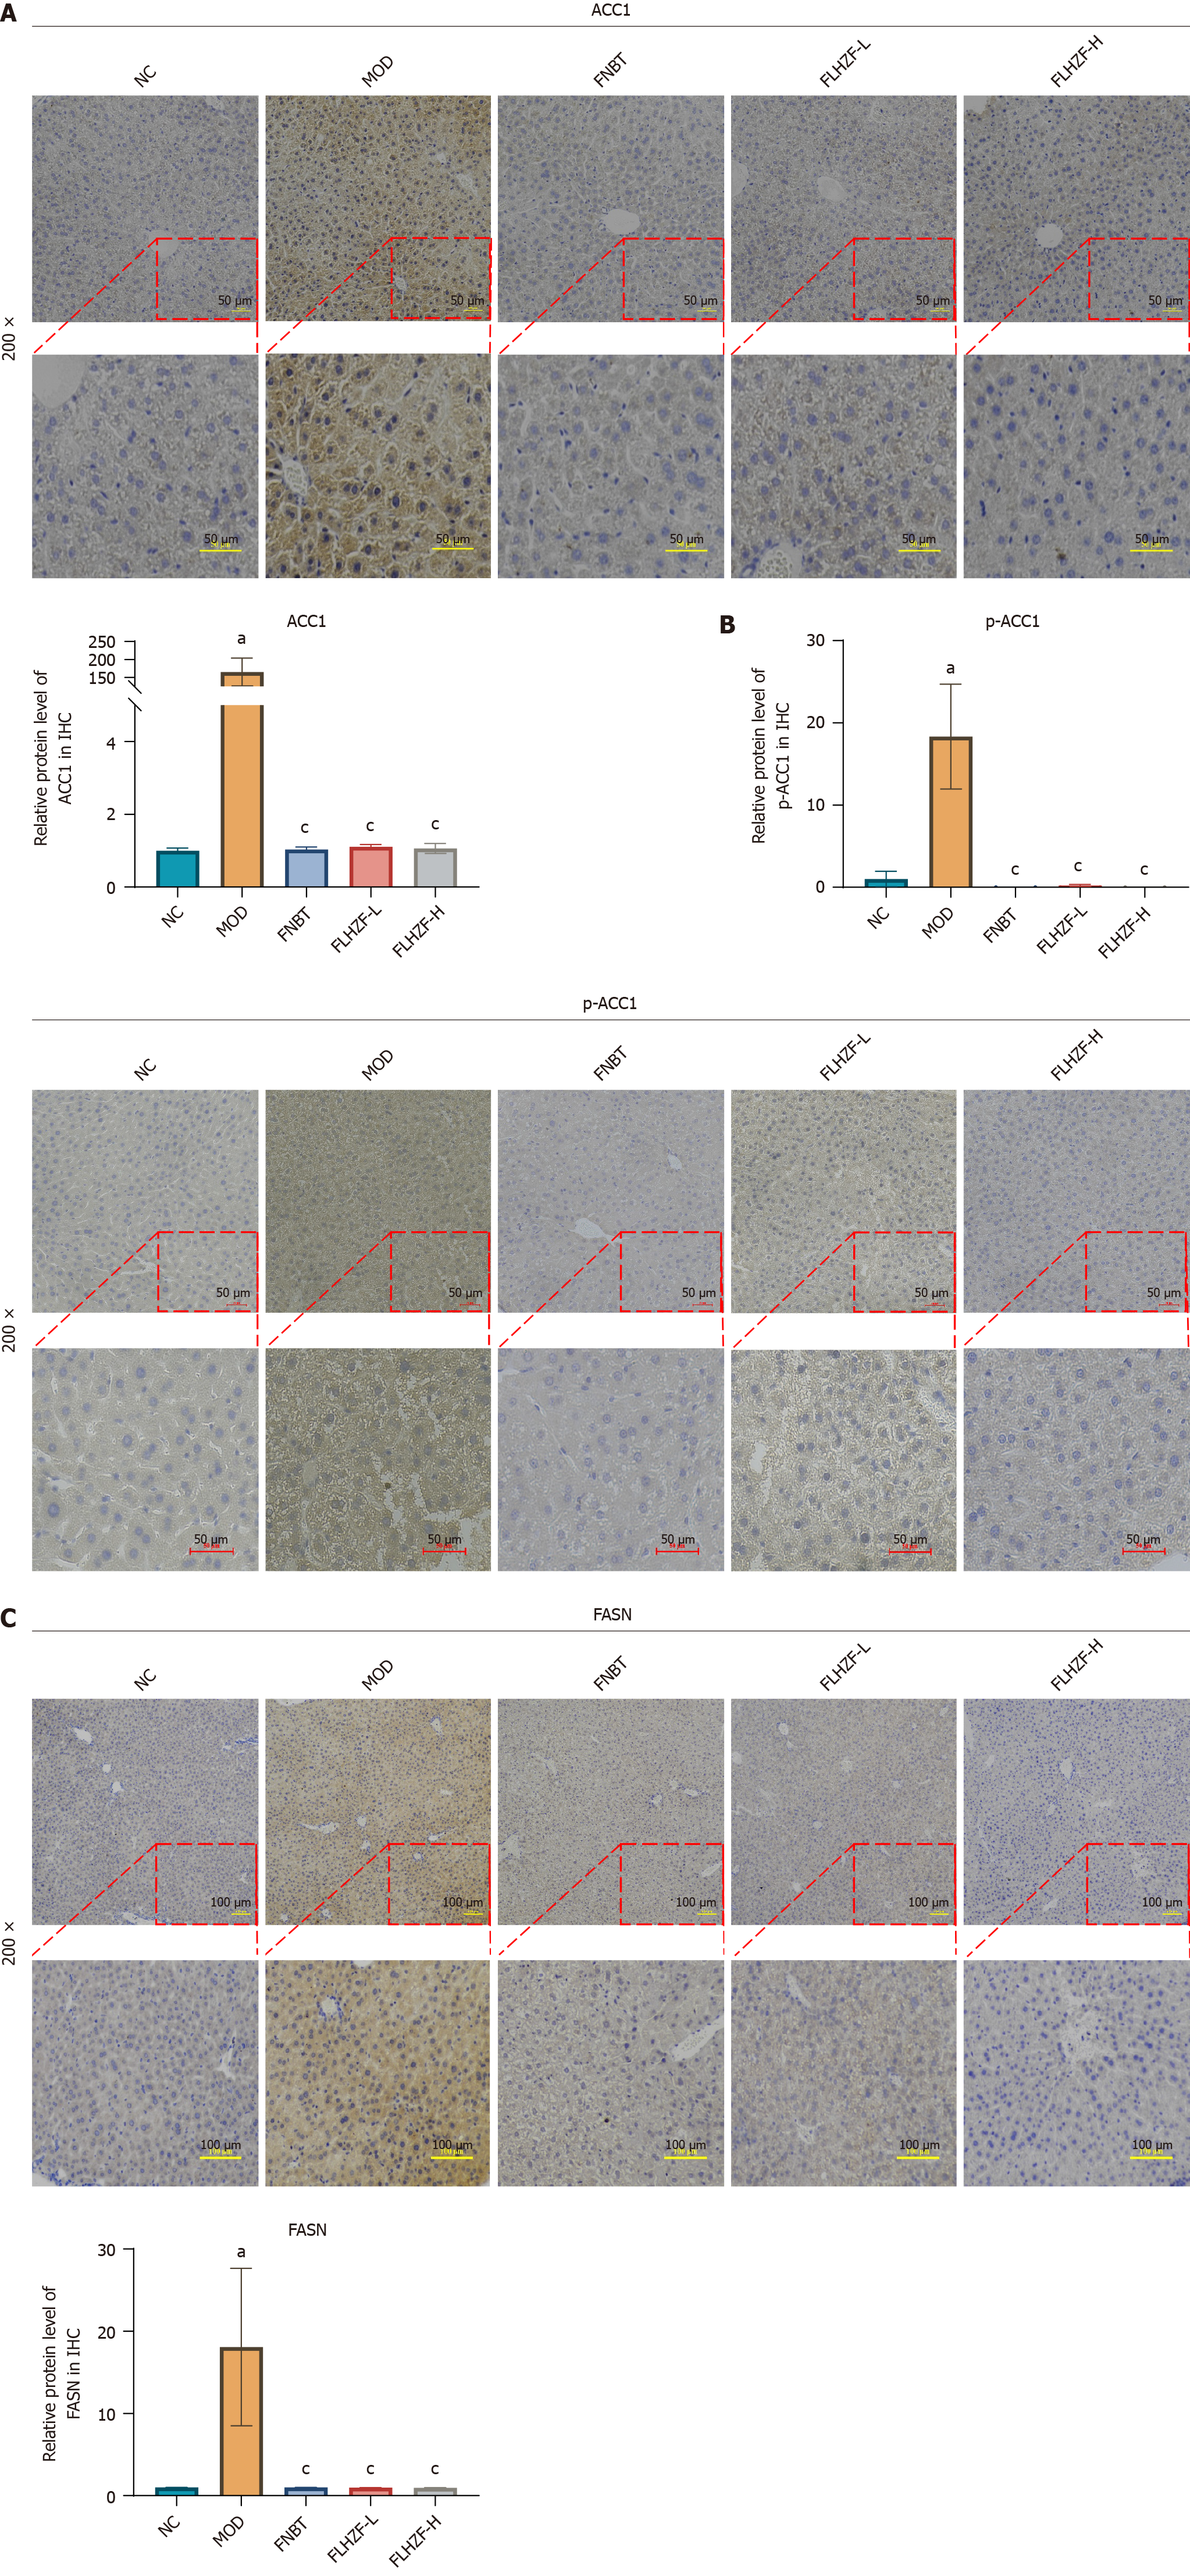
Figure 7 Fanlian Huazhuo Formula group regulated lipid synthesis signaling pathway in vivo.
Representative images and quantification from immunohistochemistry for protein in mice liver, magnification 200 × (n = 3). A: ACC1; B: p-ACC1; C: FASN. Data are presented as mean ± SE. aP < 0.05 vs NC group, cP < 0.05 vs MOD group. NC: Negative control group; MOD: Model group; FNBT: Fenofibrate group; FLHZF-L: Low dose of Fanlian Huazhuo Formula group; FLHZF-H: High dose of Fanlian Huazhuo Formula group.
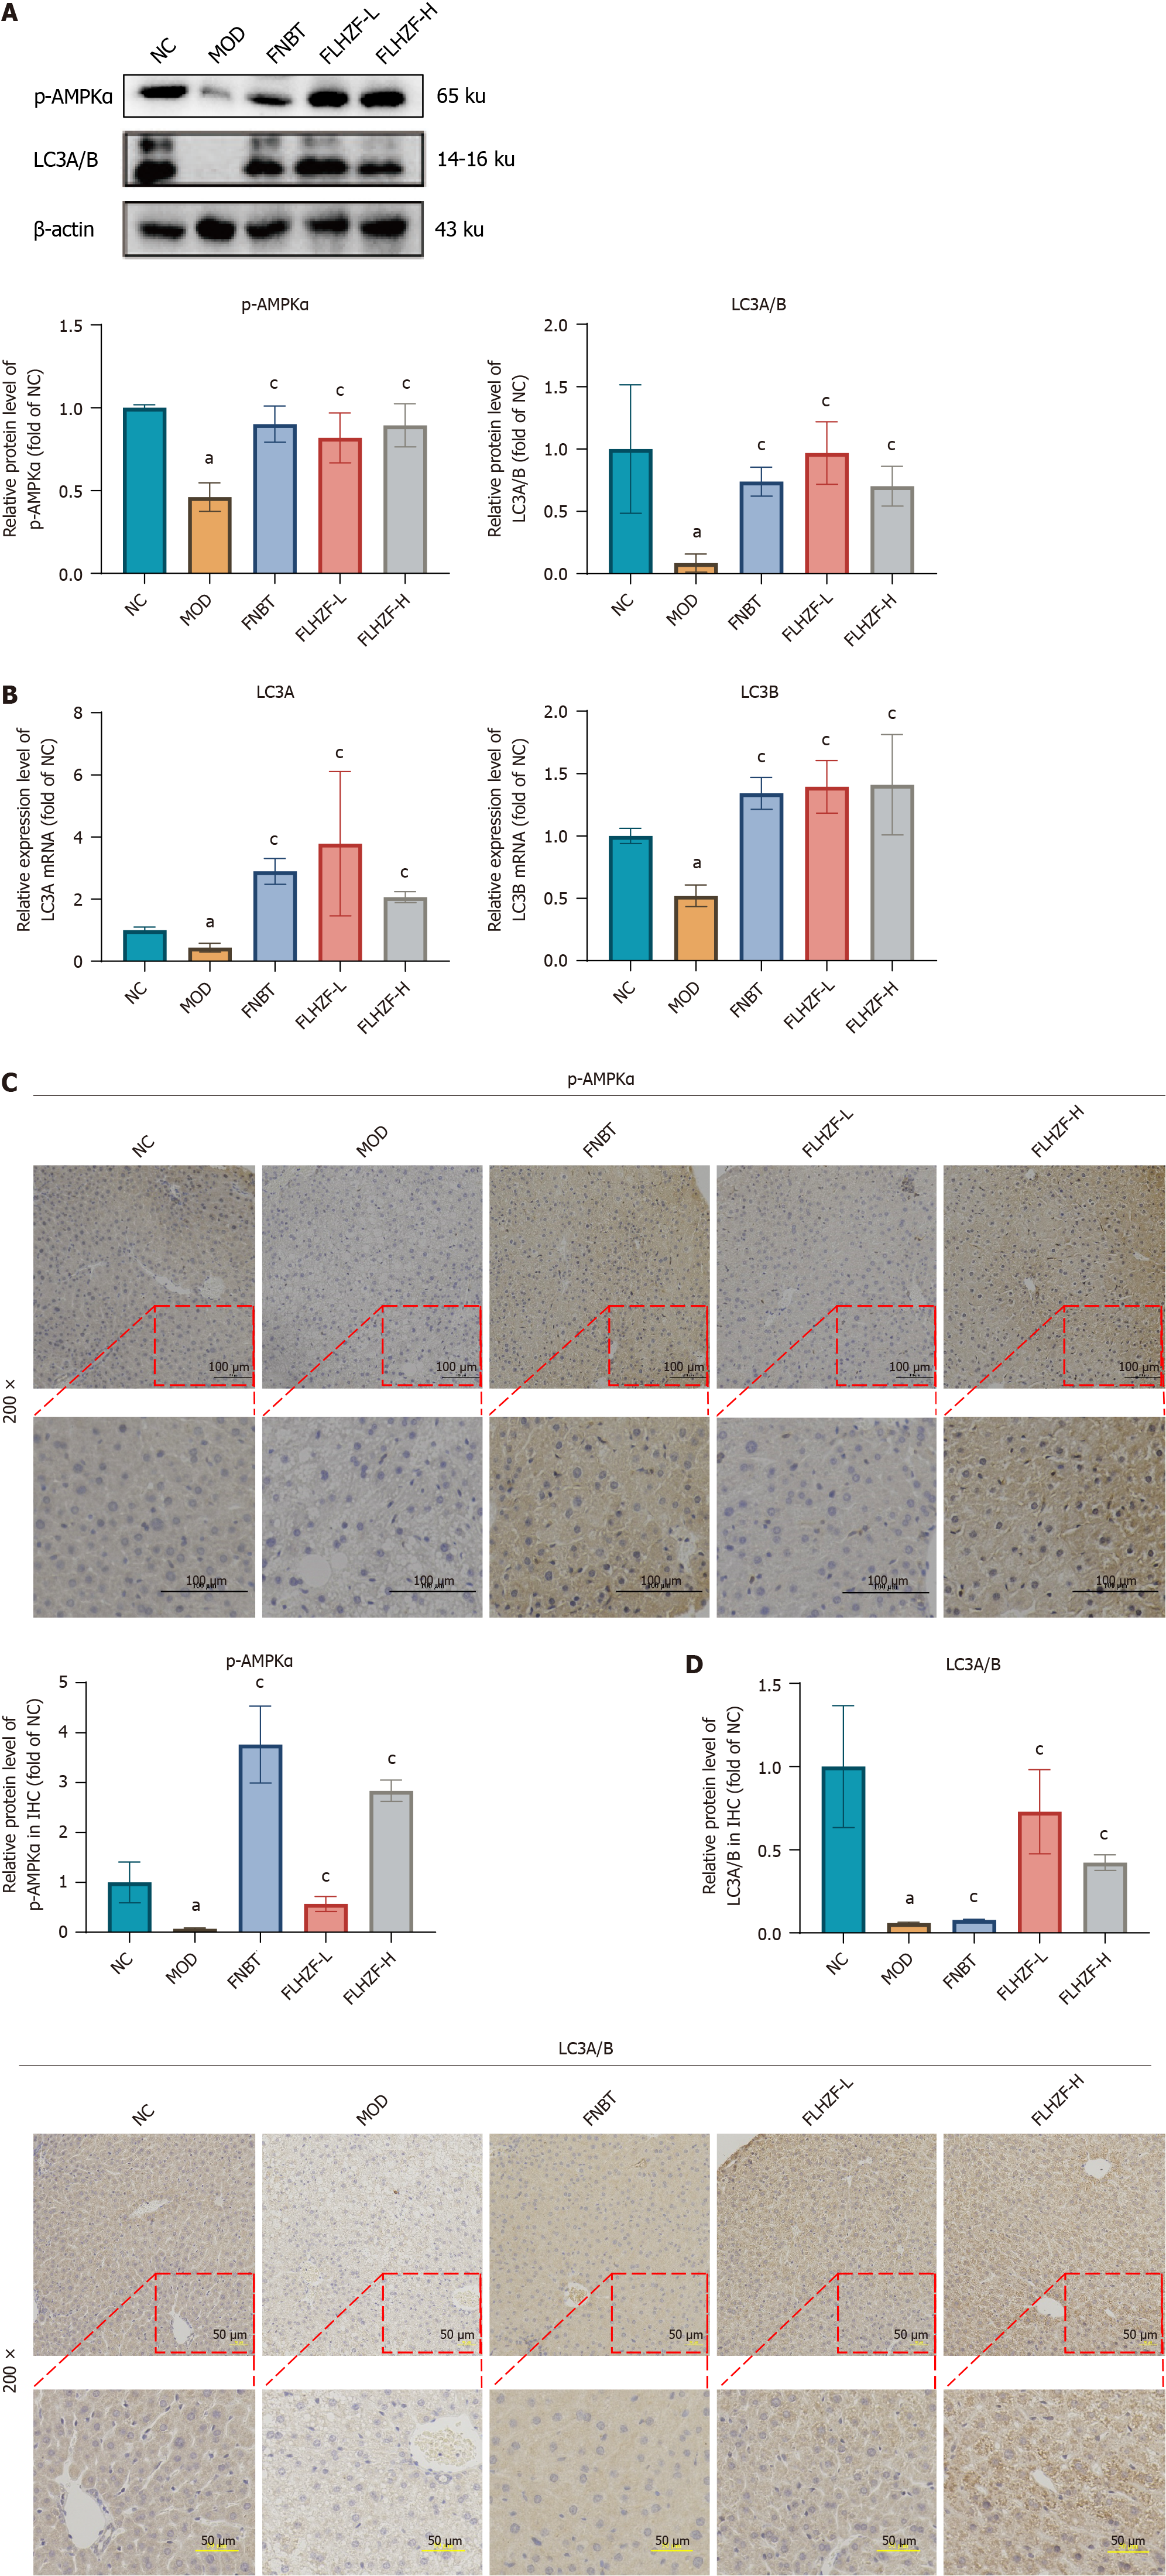
Figure 8 Fanlian Huazhuo Formula group regulated autophagy in mice induced by high-fat diet.
A: Protein expression levels of LC3A/B and p-AMPKα in mice liver which were normalized by β-actin (n = 3); B: Relative mRNA expression levels of LC3A and LC3B in mice liver (n = 3); C: Representative images from immunohistochemistry for protein p-AMPKα in mice liver, magnification 200 × (n = 3); D: Representative images from immunohistochemistry for protein LC3A/B in mice liver, magnification 200 × (n = 3). Data are presented as mean ± SE. aP < 0.05 vs NC group, cP < 0.05 vs MOD group. NC: Negative control group; MOD: Model group; FNBT: Fenofibrate group; FLHZF-L: Low dose of Fanlian Huazhuo Formula group; FLHZF-H: High dose of Fanlian Huazhuo Formula group.
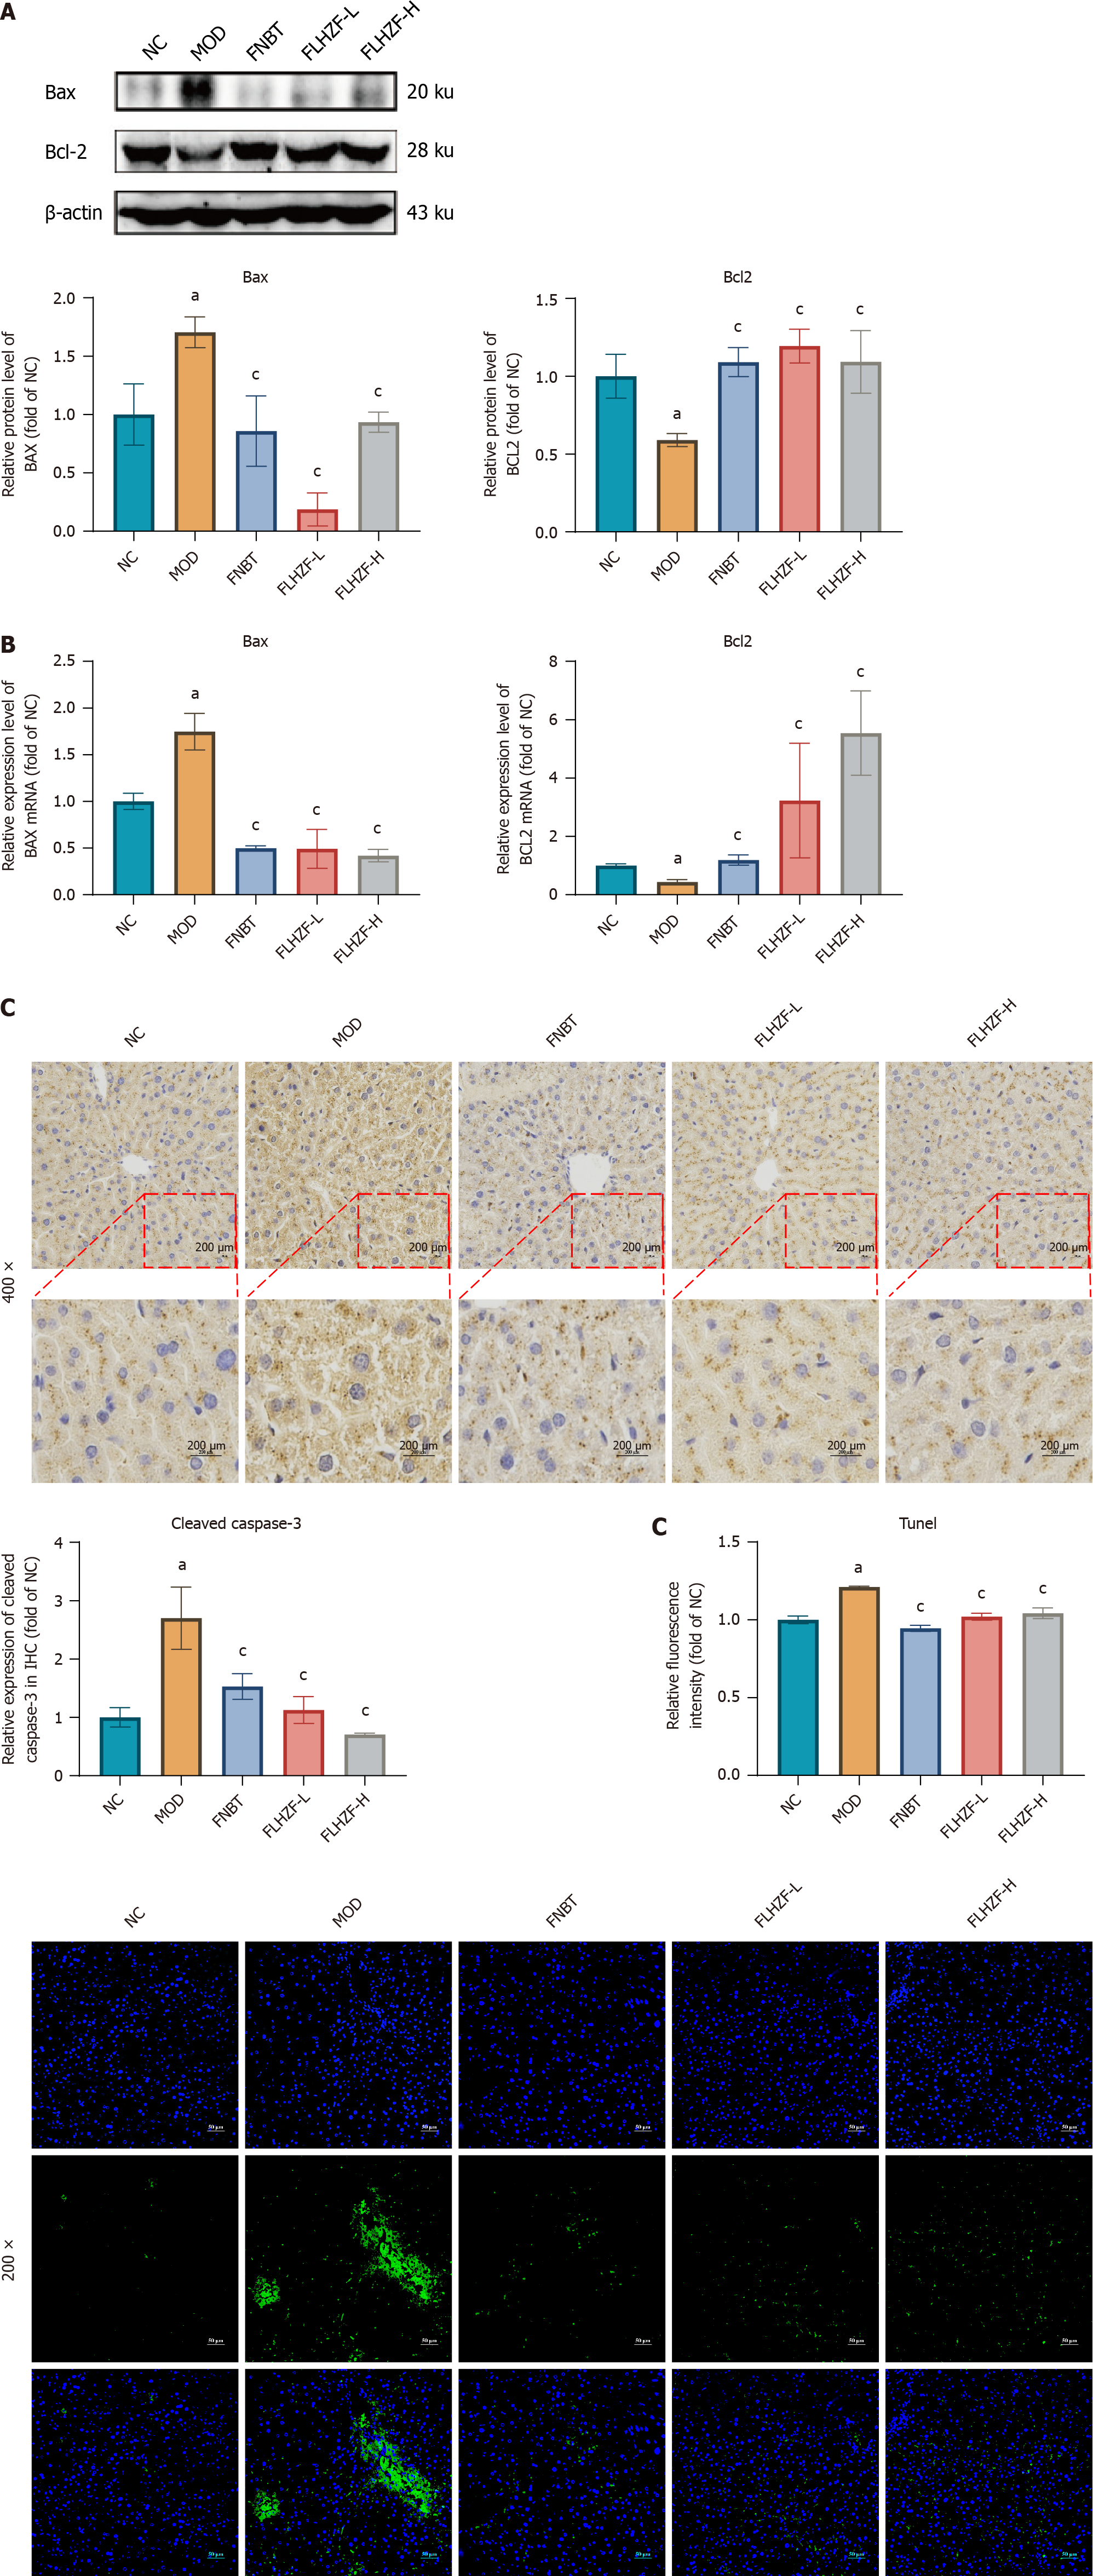
Figure 9 Fanlian Huazhuo Formula group reduced apoptosis in mice induced by high-fat diet.
A: Protein expression levels of Bax and Bcl-2 in mice liver (n = 3); B: Hepatic mRNA expression levels of Bax and Bcl-2 in mice liver (n = 3); C: Representative images and the quantification of immunohistochemistry for cleaved caspase-3 in mice liver, magnification 400 × (n = 3); D: Representative images and quantification of TUNEL staining of liver in mice, 200 × (n = 3). Data are presented as mean ± SE. aP < 0.05 vs NC group, cP < 0.05 vs MOD group. NC: Negative control group; MOD: Model group; FNBT: Fenofibrate group; FLHZF-L: Low dose of Fanlian Huazhuo Formula group; FLHZF-H: High dose of Fanlian Huazhuo Formula group.
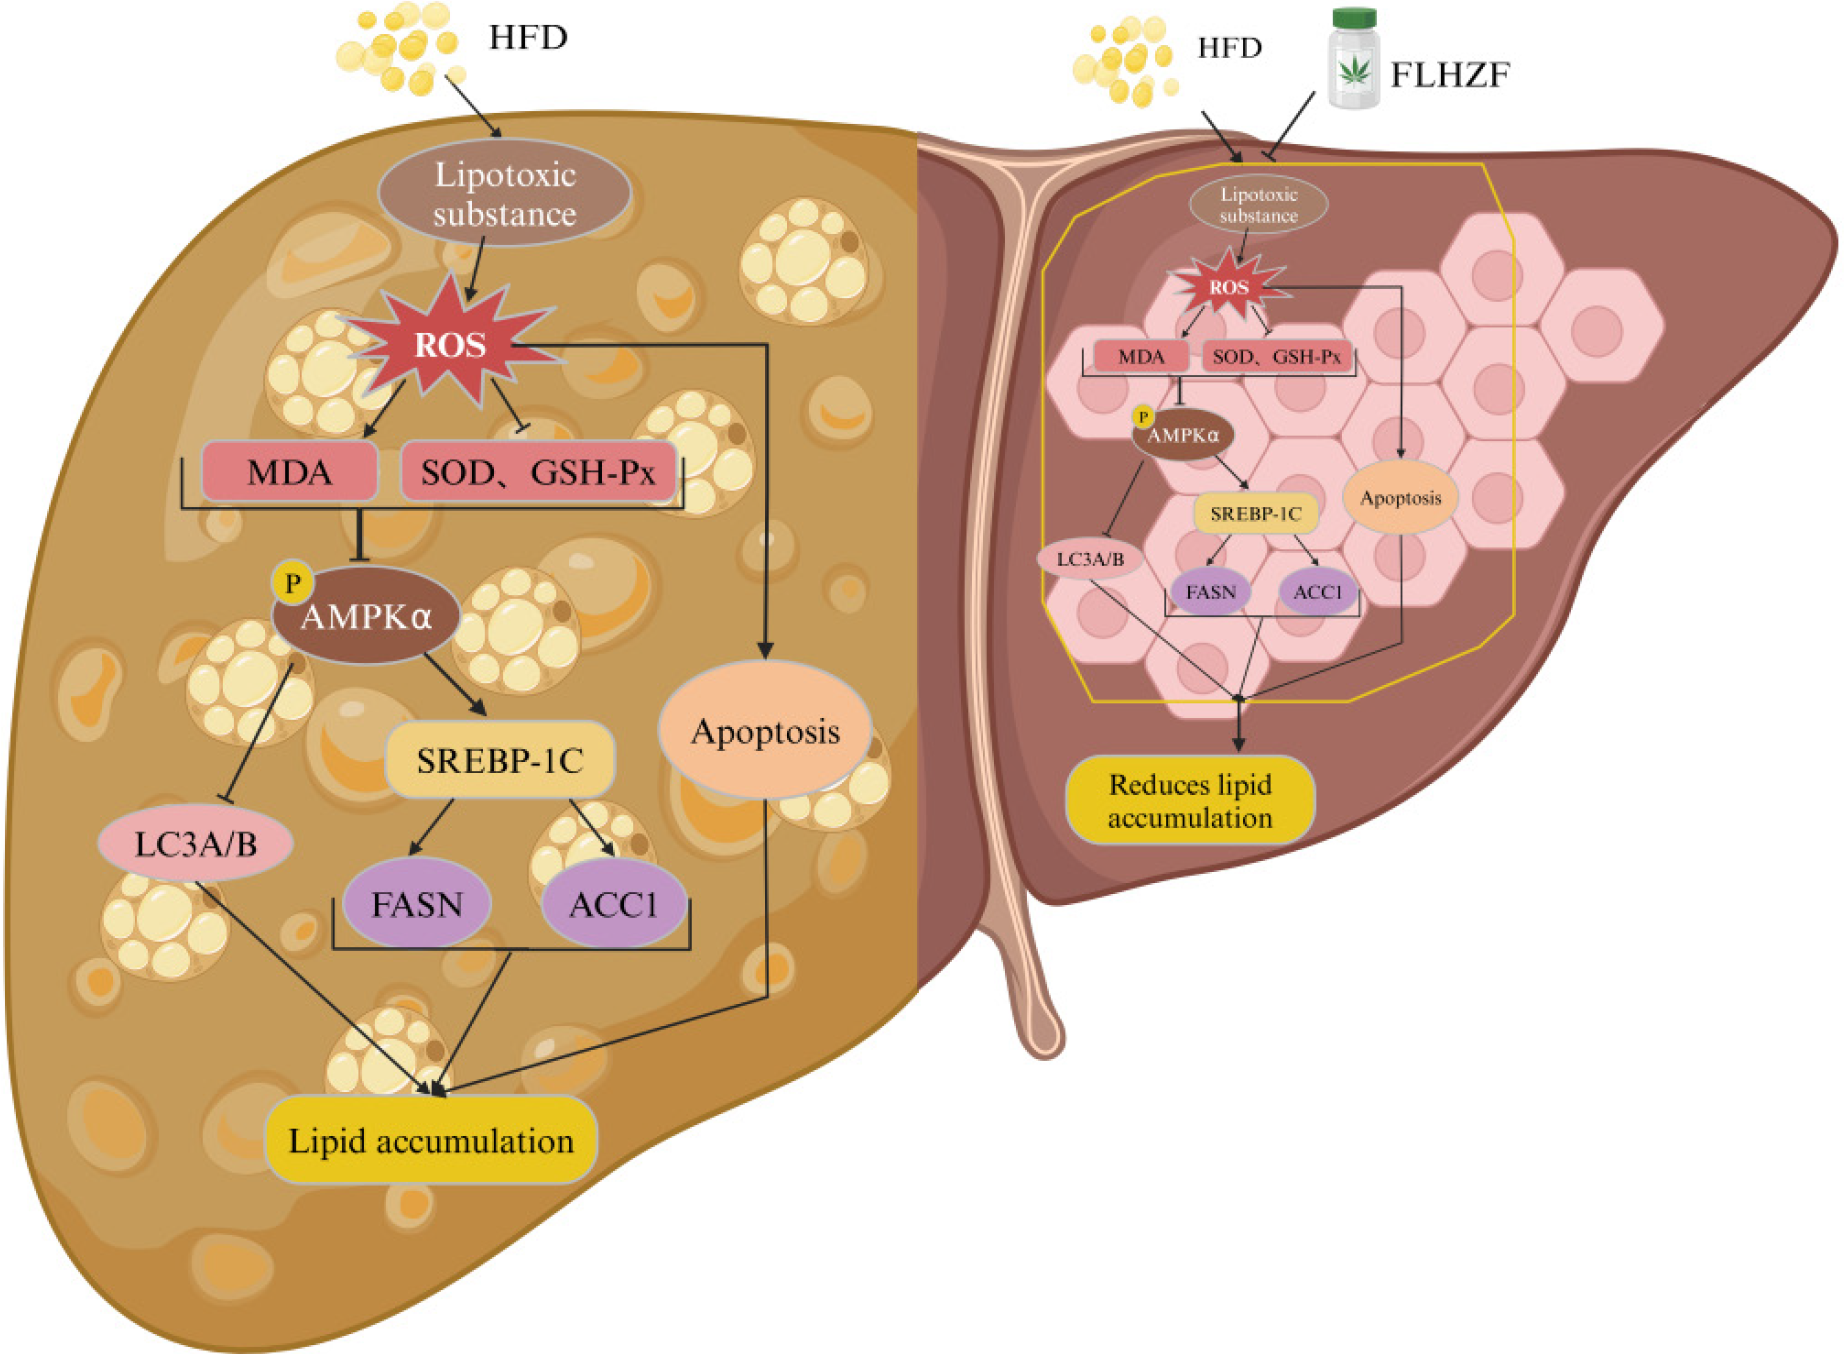
Figure 10 Diagrammatic representation of Fanlian Huazhuo Formula group protection against nonalcoholic fatty liver disease.
FLHZF: Fanlian Huazhuo Formula; NAFLD: Nonalcoholic fatty liver disease; HFD: High-fat diet; MDA: Malondialdehyde; SOD: Superoxide dismutase: GSH-Px: Glutathione peroxidase. This figure was created by BioRender.com (Supplementary material).
- Citation: Niu MY, Dong GT, Li Y, Luo Q, Cao L, Wang XM, Wang QW, Wang YT, Zhang Z, Zhong XW, Dai WB, Li LY. Fanlian Huazhuo Formula alleviates high-fat diet-induced non-alcoholic fatty liver disease by modulating autophagy and lipid synthesis signaling pathway. World J Gastroenterol 2024; 30(30): 3584-3608
- URL: https://www.wjgnet.com/1007-9327/full/v30/i30/3584.htm
- DOI: https://dx.doi.org/10.3748/wjg.v30.i30.3584


