Copyright
©The Author(s) 2024.
World J Gastroenterol. Jan 21, 2024; 30(3): 238-251
Published online Jan 21, 2024. doi: 10.3748/wjg.v30.i3.238
Published online Jan 21, 2024. doi: 10.3748/wjg.v30.i3.238
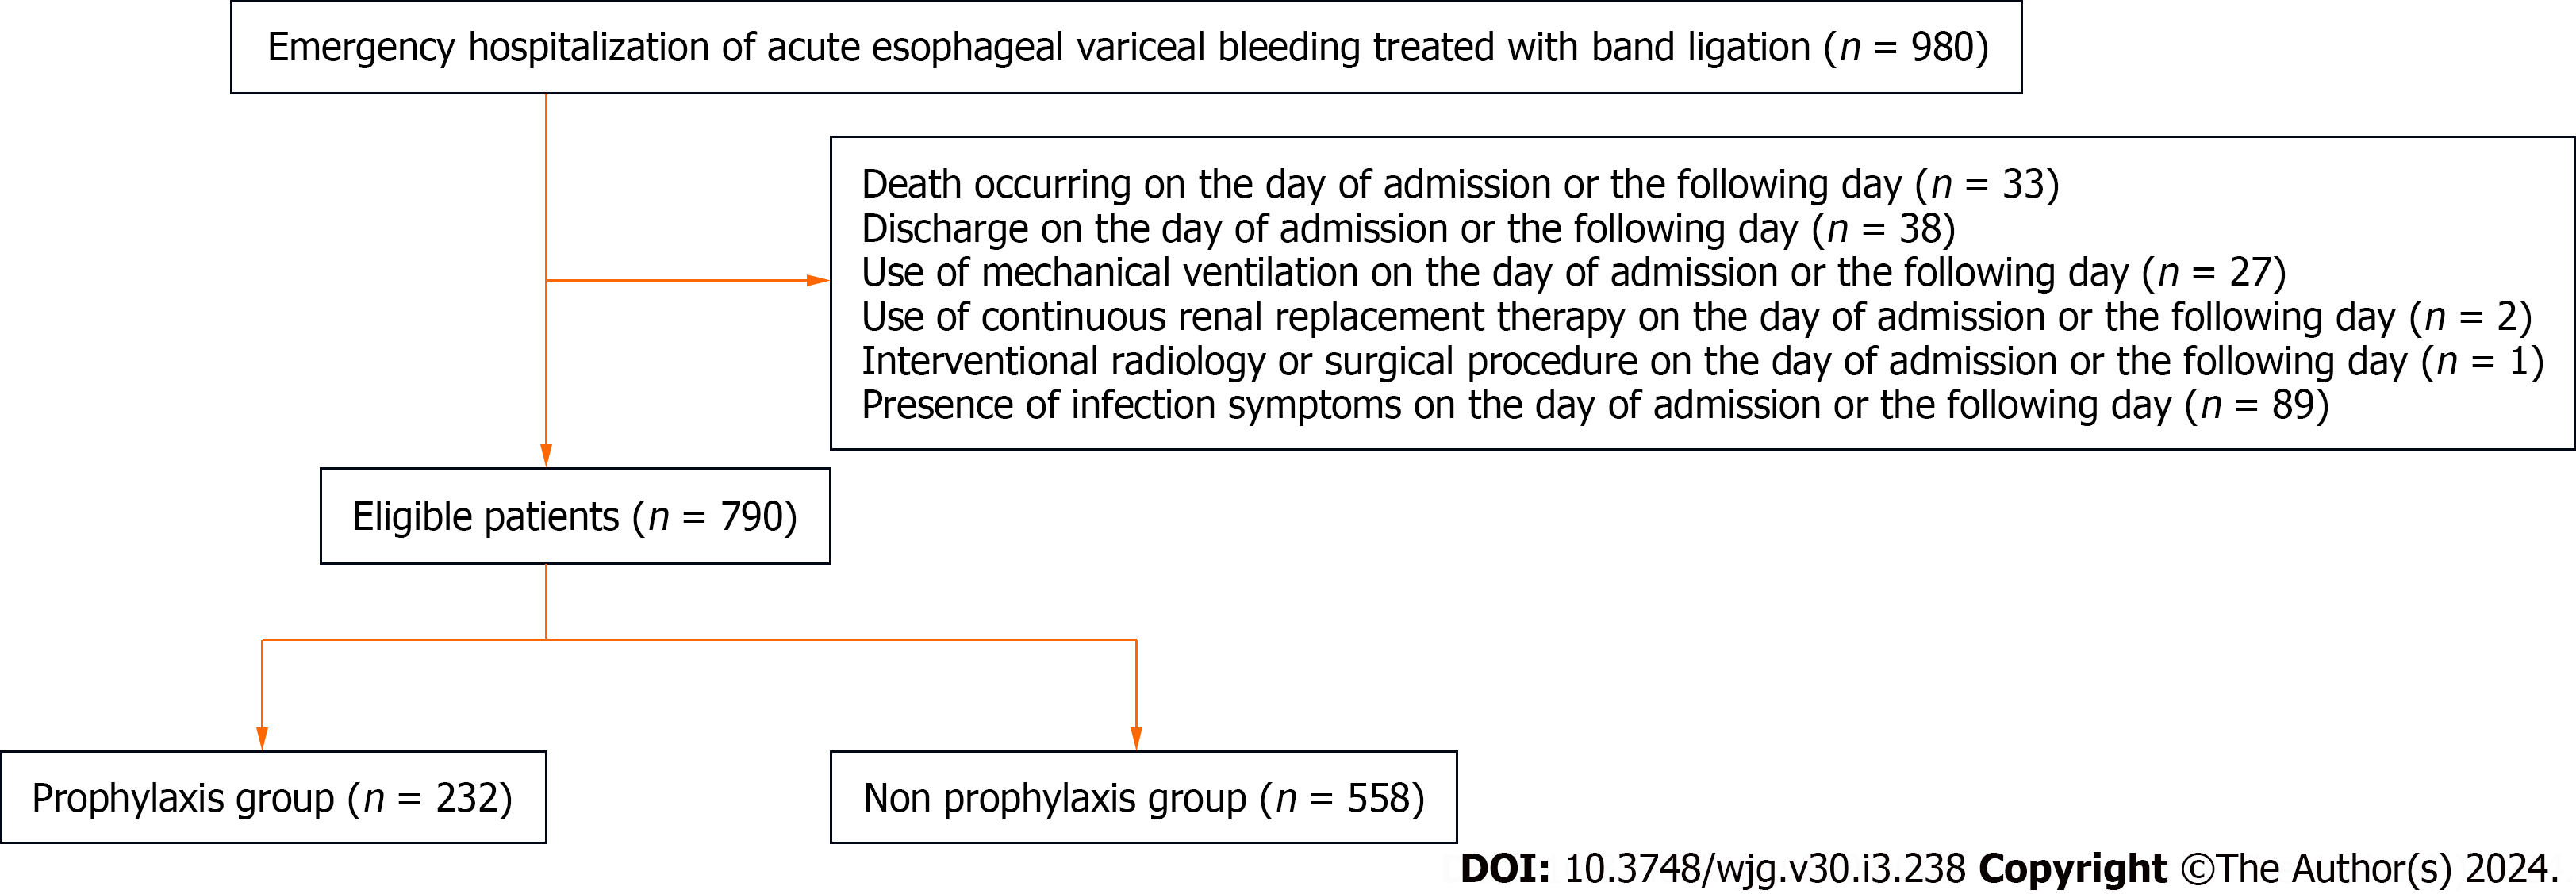
Figure 1 Patient flow.
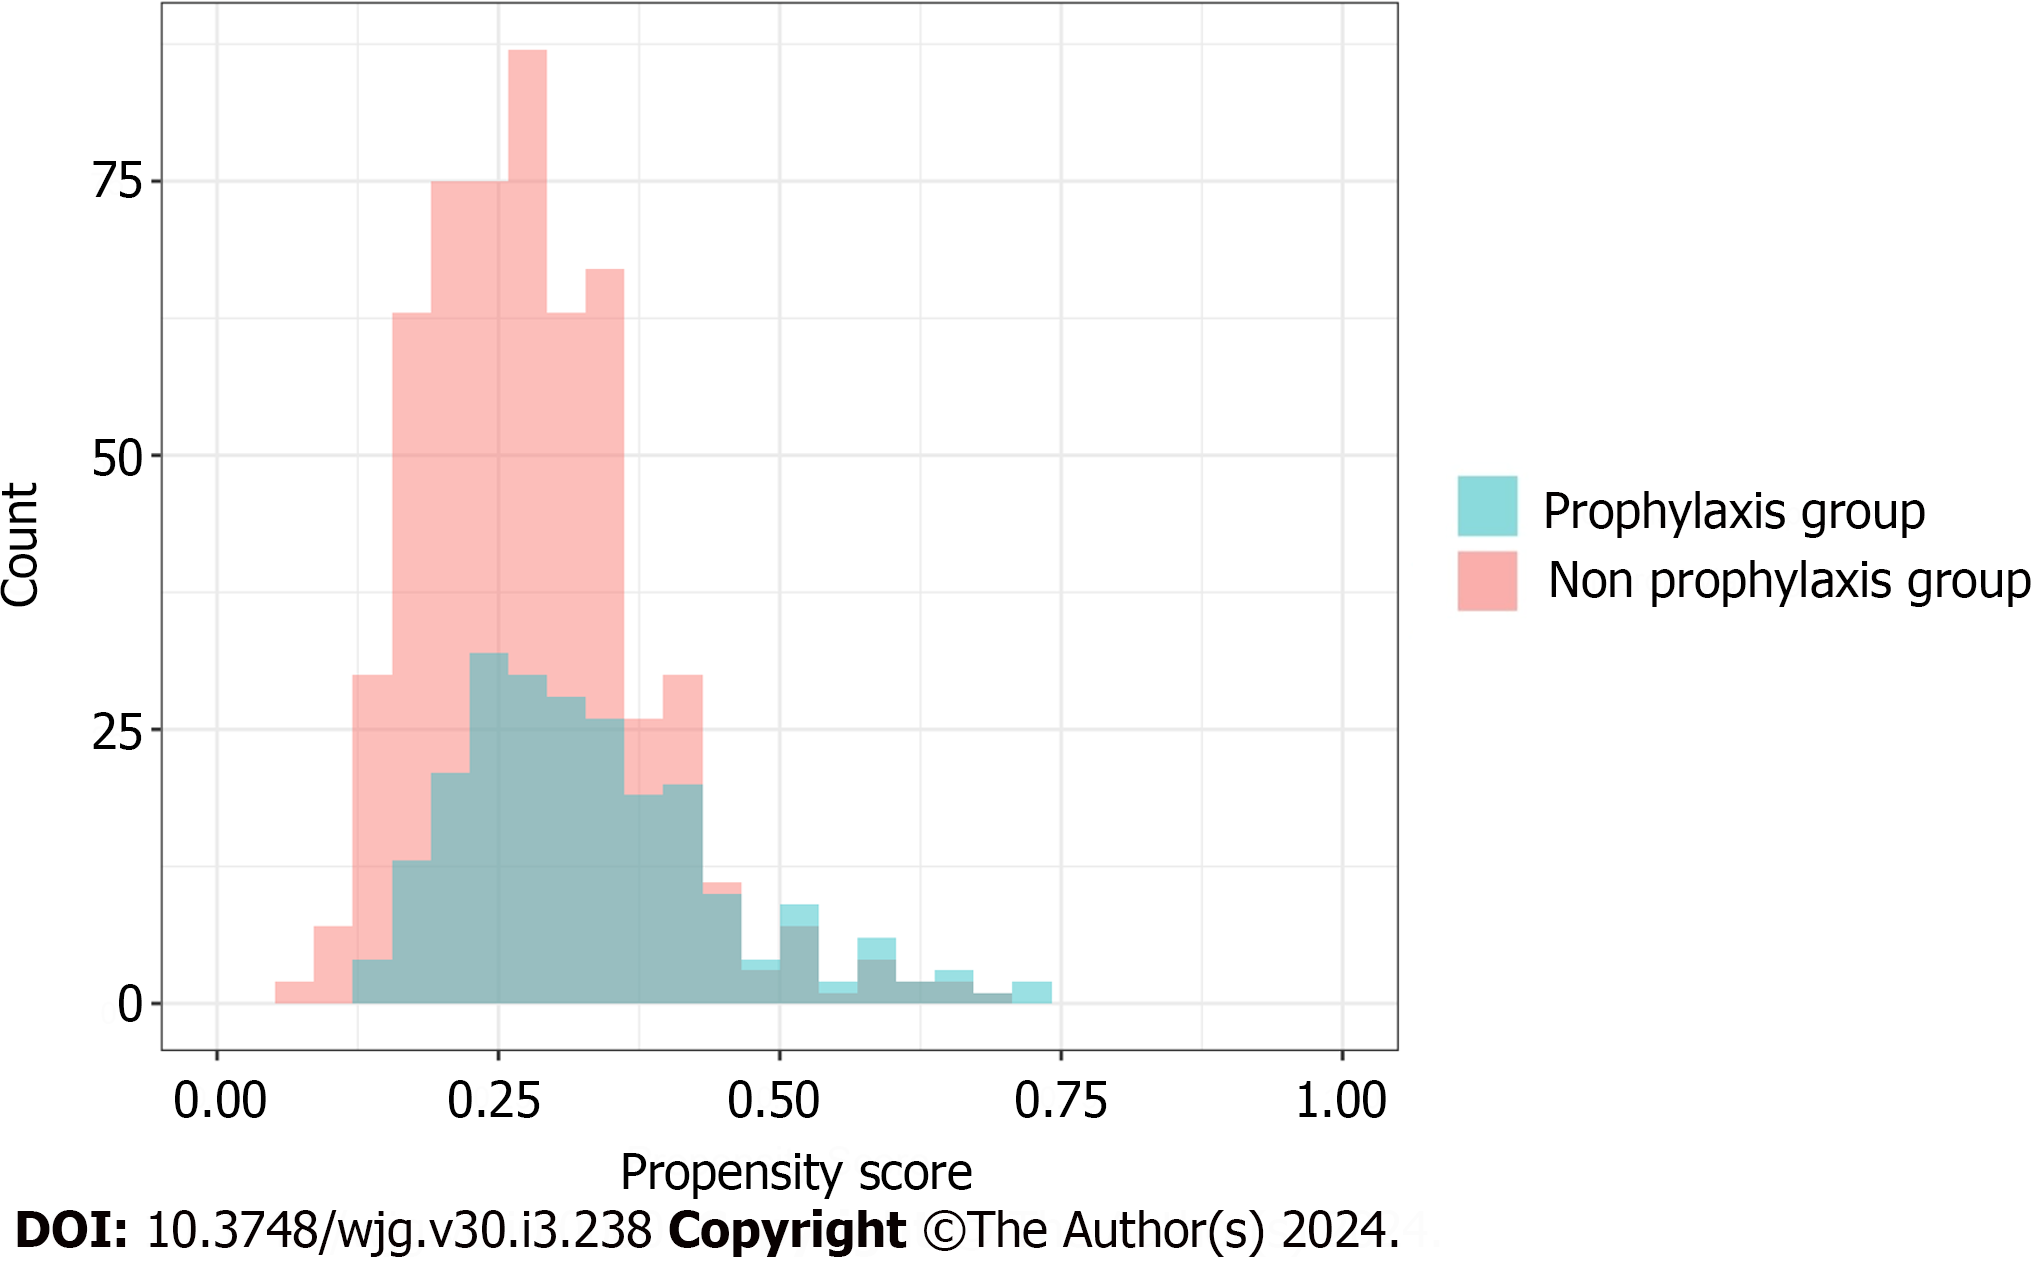
Figure 2 Overlap of the propensity score of each group.
Figure 3 Comparison of standardized mean difference before and after inverse probability of treatment weighting.
IPTW: Inverse probability of treatment weighting; RBC: Red blood cell; eGFR: Glomerular filtration rate; NSAIDs: Nonsteroidal anti-inflammatory drugs.
Figure 4 Comparison of standardized mean difference before and after propensity score matching.
RBC: Red blood cell; eGFR: Glomerular filtration rate; NSAIDs: Nonsteroidal anti-inflammatory drugs; PTW: Inverse probability of treatment weighting.
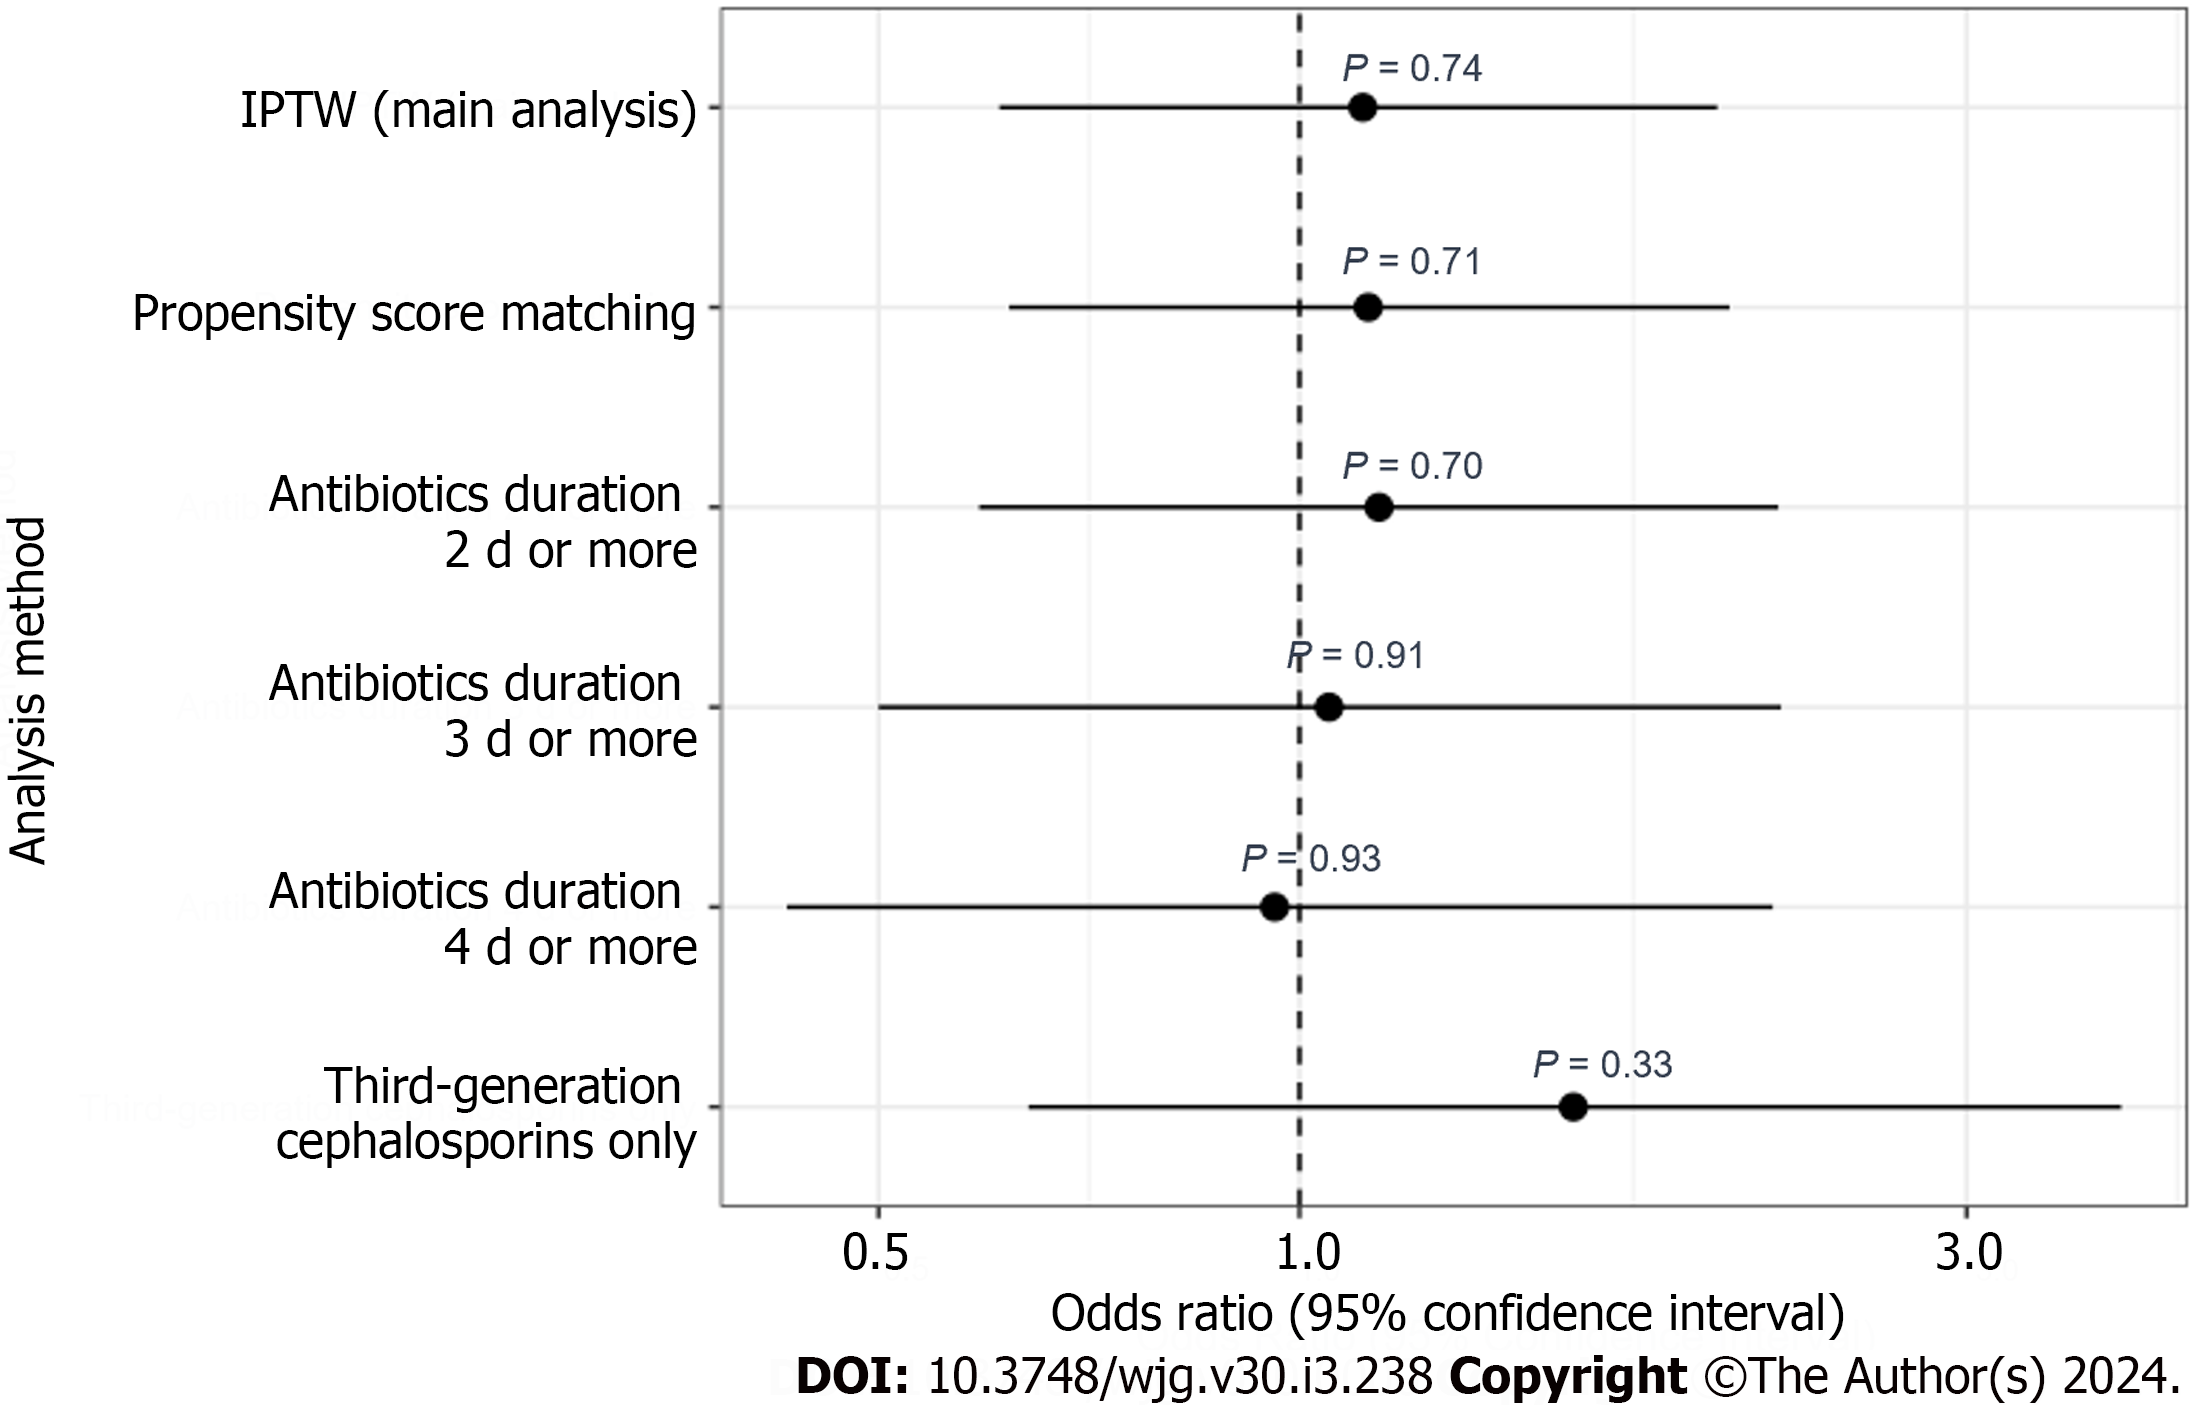
Figure 5 Forest plot of sensitivity analysis.
IPTW: Inverse probability of treatment weighting.
- Citation: Ichita C, Shimizu S, Goto T, Haruki U, Itoh N, Iwagami M, Sasaki A. Effectiveness of antibiotic prophylaxis for acute esophageal variceal bleeding in patients with band ligation: A large observational study. World J Gastroenterol 2024; 30(3): 238-251
- URL: https://www.wjgnet.com/1007-9327/full/v30/i3/238.htm
- DOI: https://dx.doi.org/10.3748/wjg.v30.i3.238


