Copyright
©The Author(s) 2024.
World J Gastroenterol. Aug 7, 2024; 30(29): 3511-3533
Published online Aug 7, 2024. doi: 10.3748/wjg.v30.i29.3511
Published online Aug 7, 2024. doi: 10.3748/wjg.v30.i29.3511
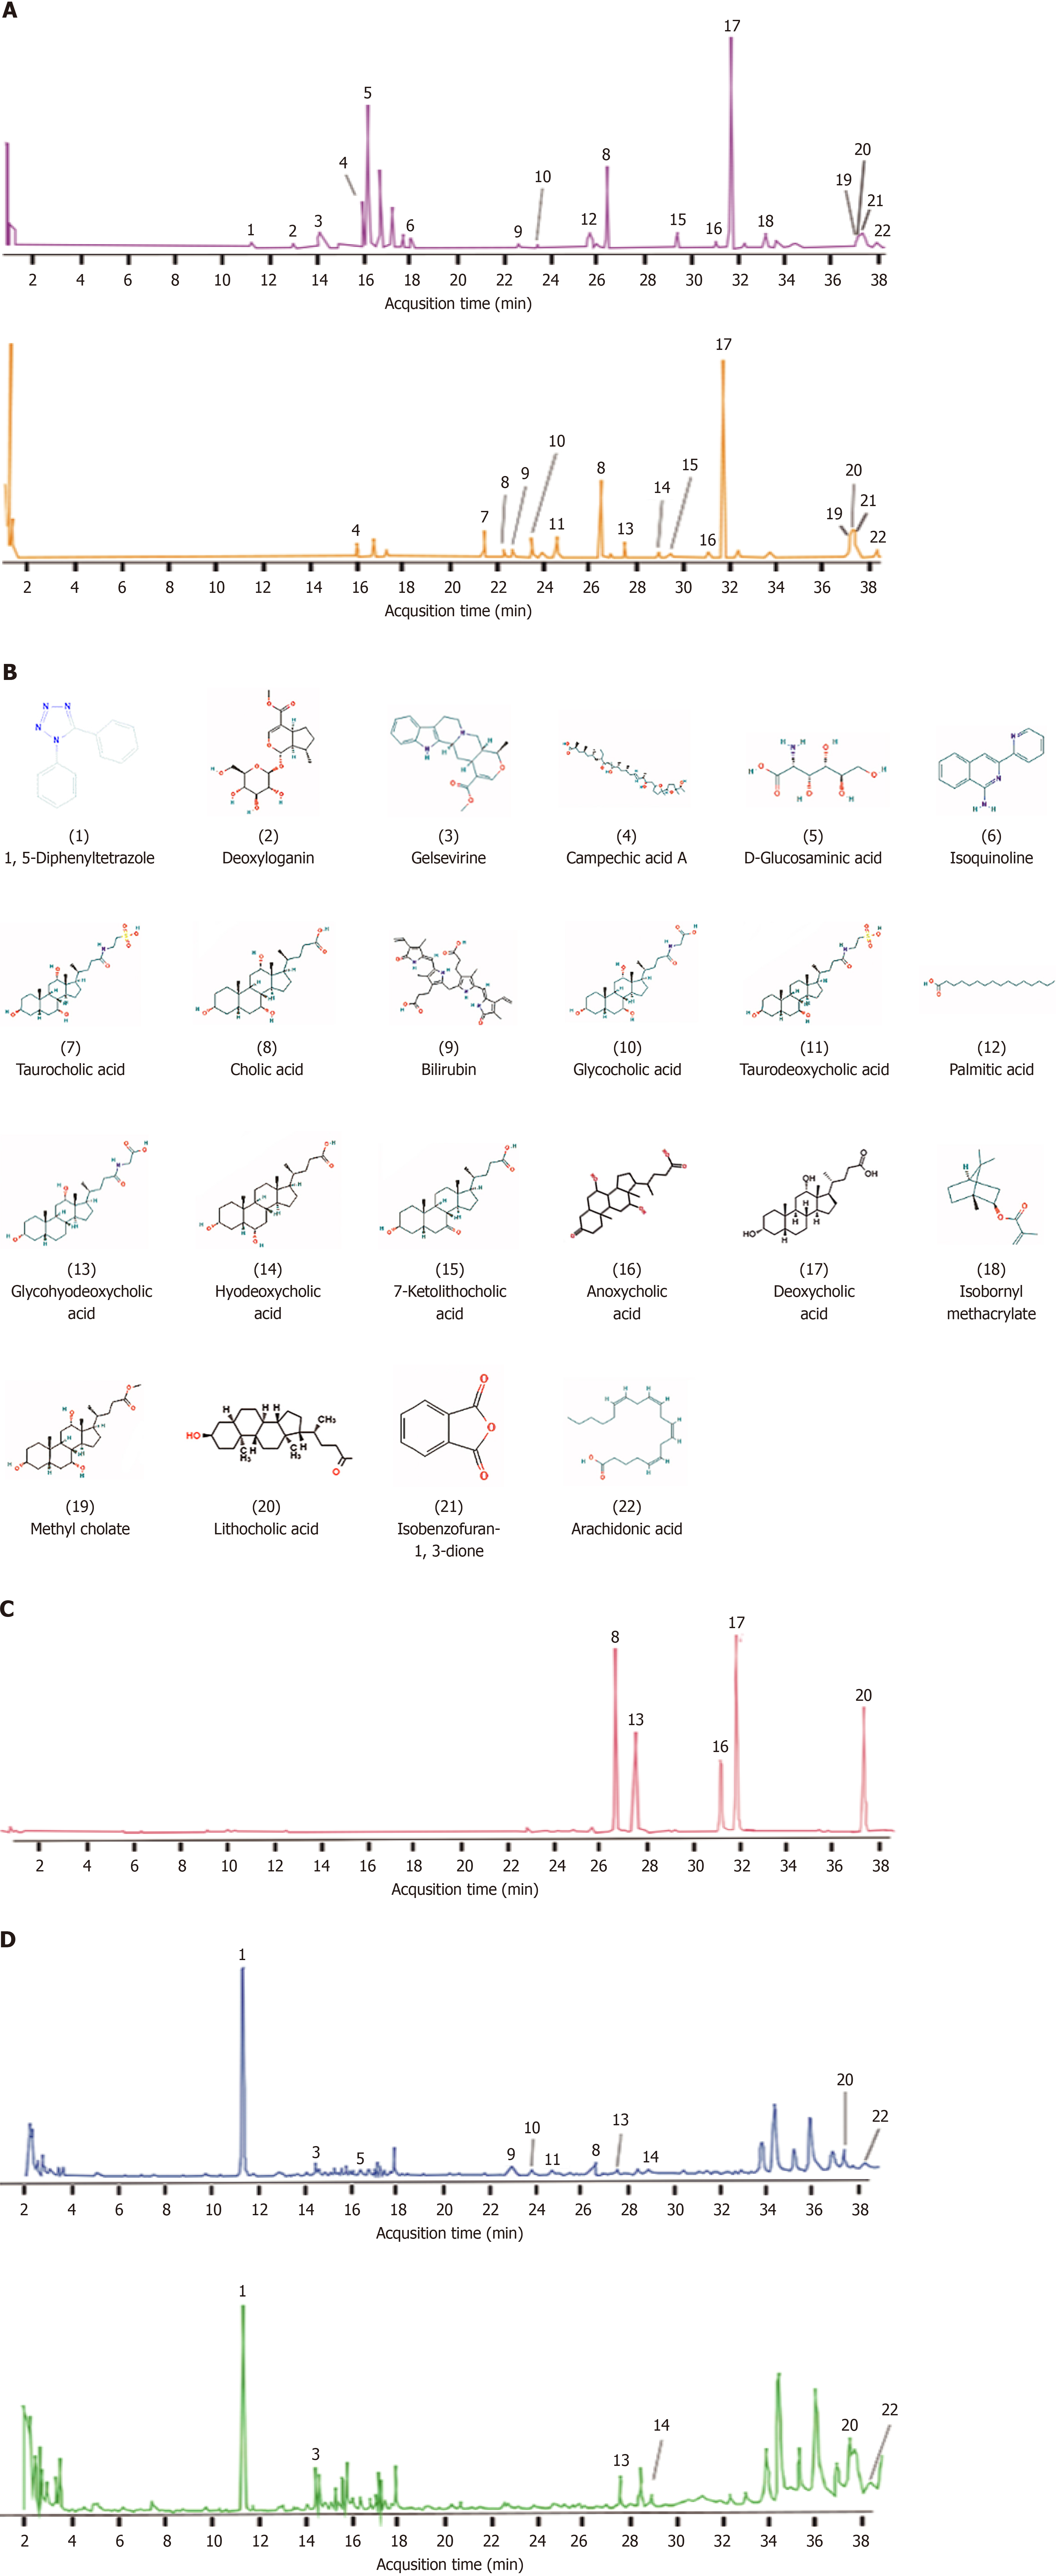
Figure 1 Analysis of pharmacodynamic material basis of Calculus bovis.
A: Positive and negative ion chromatograms of Calculus bovis (CB) extract; B: Structural diagrams of 22 components of CB; C: Ion chromatogram of the standardized substances of CB extract; D: Ion chromatograms of CB-enriched serum and blank serum.
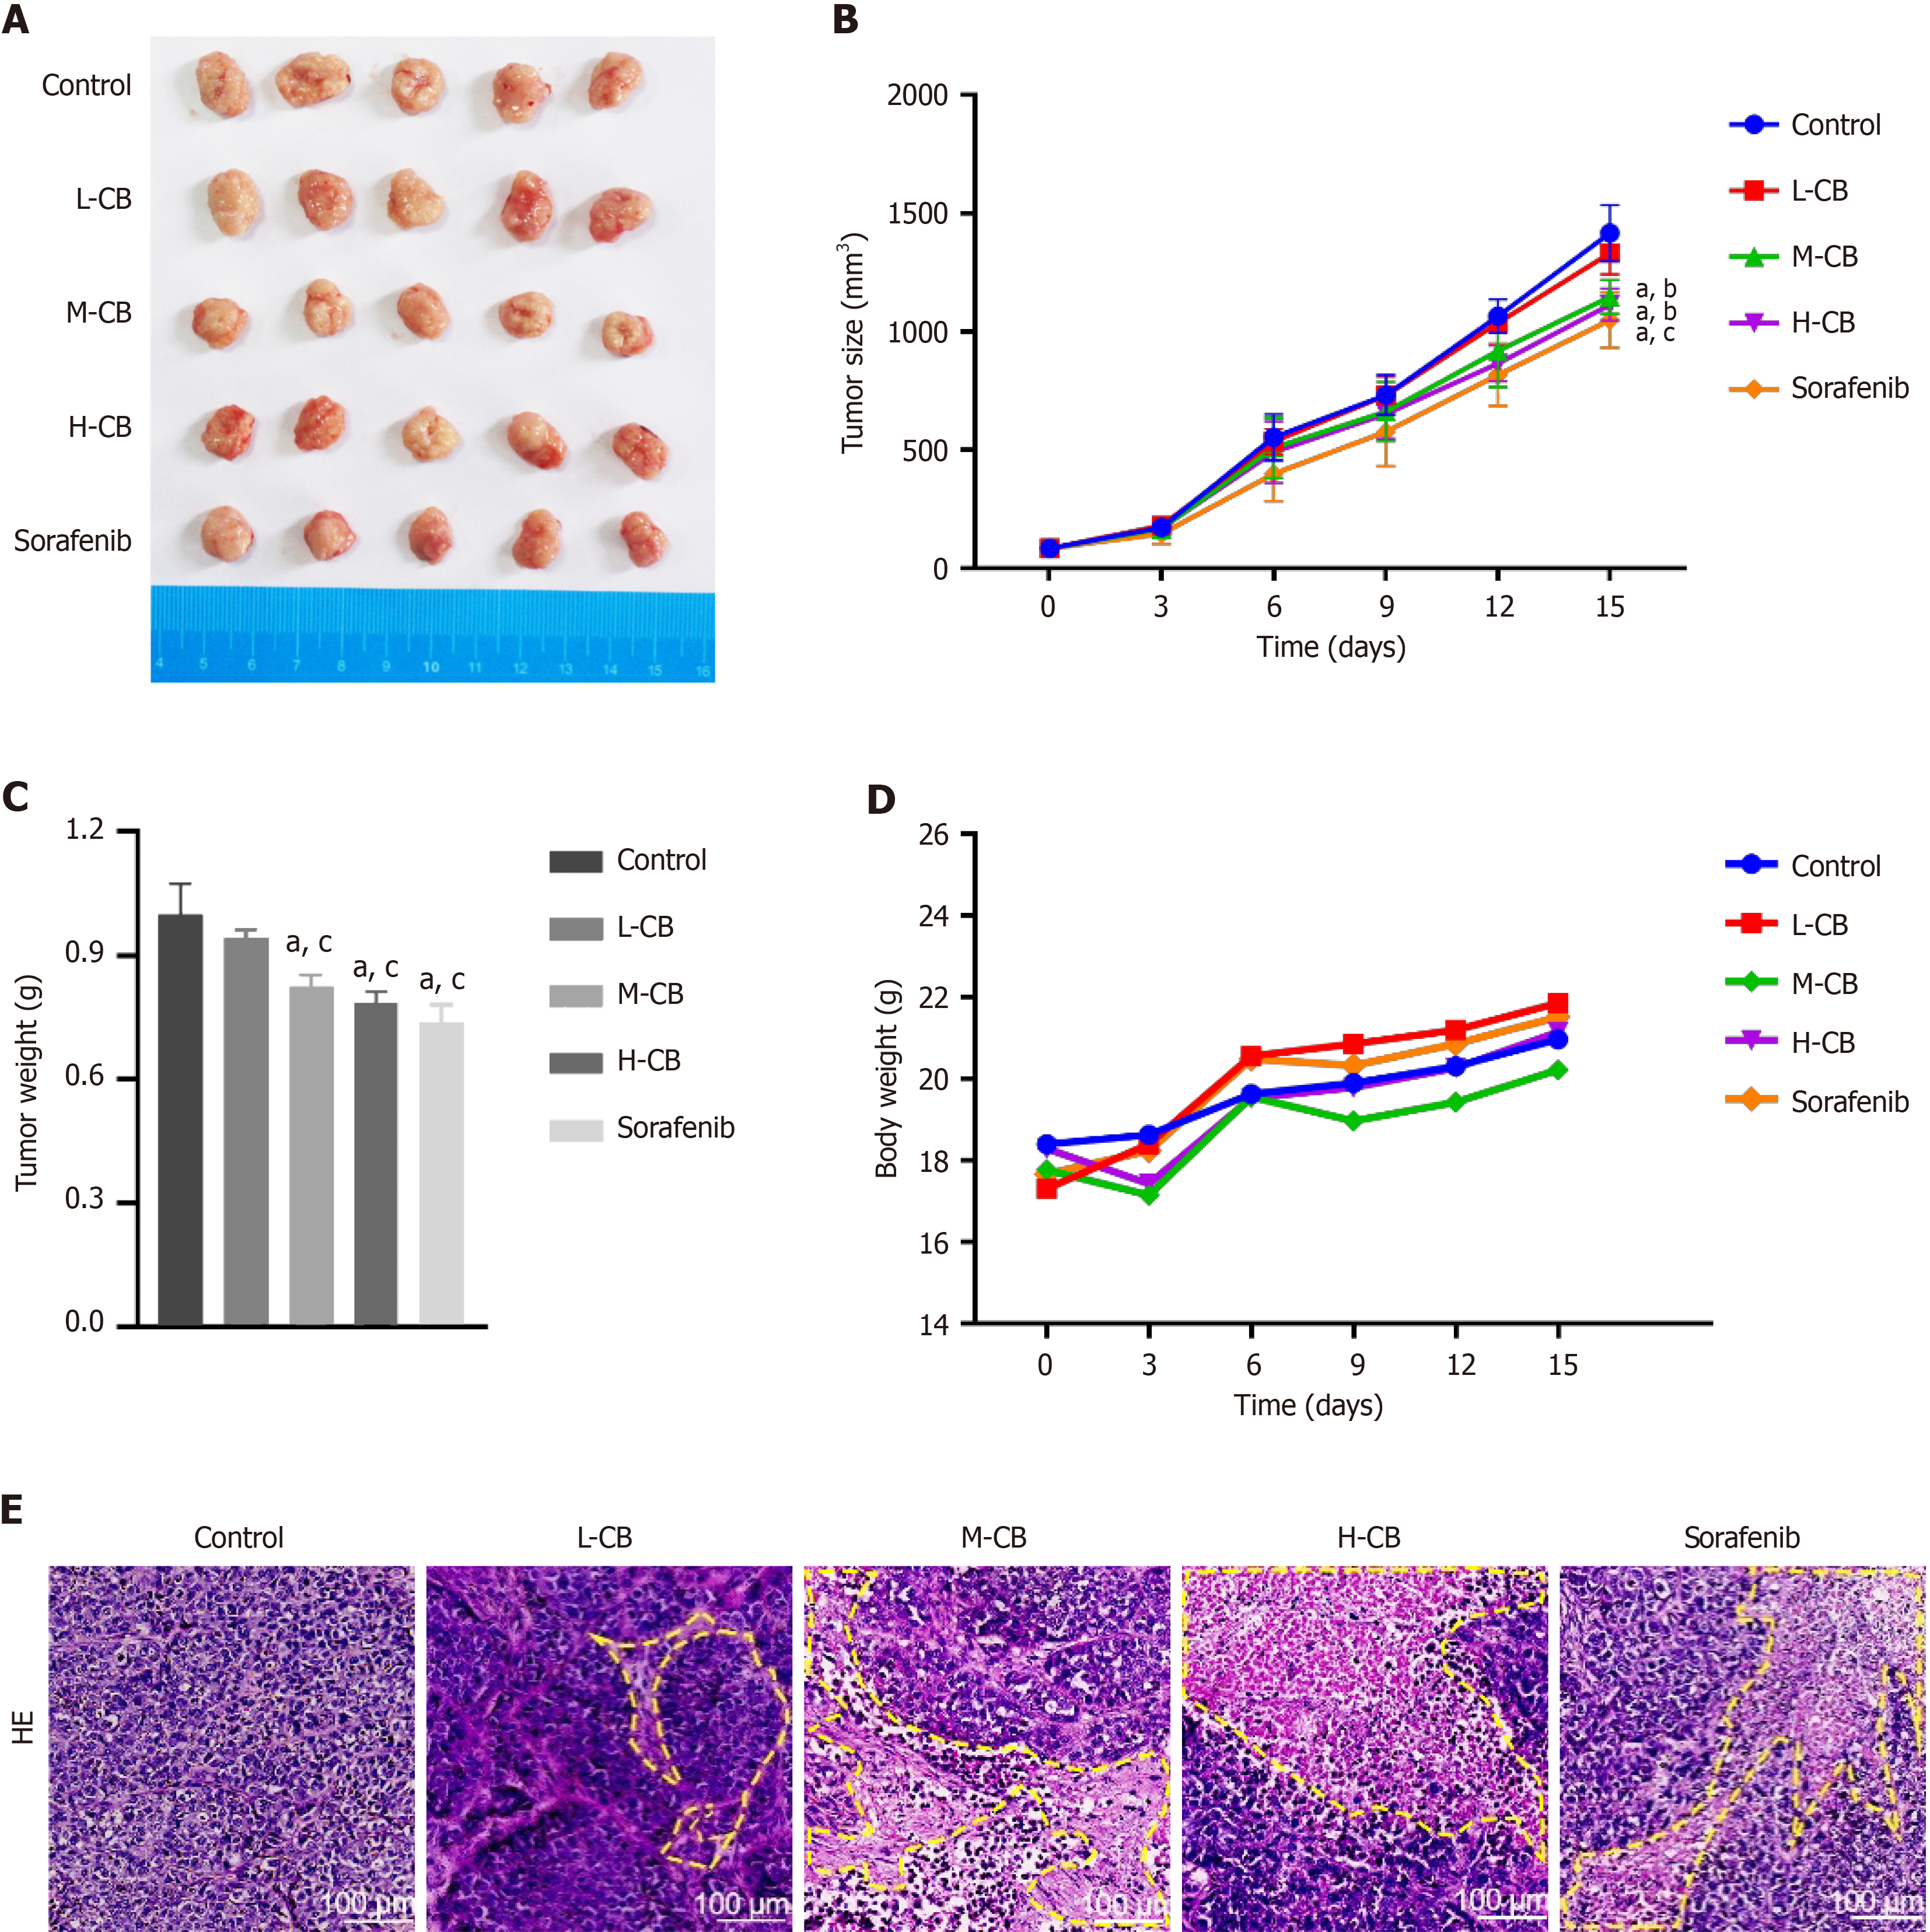
Figure 2 In vivo anti-tumor activity of Calculus bovis.
A: Pictures of tumors in each group after treatment; B: Tumor size changes in each group during treatment; C: Tumor weight of each group during treatment; D: Changes in weight of mice in each group during treatment; E: Hematoxylin-eosin staining results of tumor tissue sections in each group after treatment. Control: Model group. CB: Calculus bovis; L-CB: Low-dose CB group; M-CB: Medium-dose CB group; H-CB: High-dose CB group; Differences were assessed using one-way ANOVA and multiple comparisons were determined using Tukey's test. aP < 0.01 vs control, bP < 0.05 vs L-CB, cP < 0.01 vs L-CB.
Figure 3 Cyberpharmacological study on anti-liver cancer mechanism of active components of Calculus bovis based on UPLC-Q-TOF-MS analysis.
A: Intersection plot of potential targets of Calculus bovis (CB) and liver cancer targets; B: Component-target-disease interaction network of CB against liver cancer. The purple quadrilaterals represent the active components of CB; C: Protein-protein interaction network; D: Gene Ontology function analysis of CB against liver cancer; E: Kyoto Encyclopedia of Genes and Genomes pathway enrichment analysis of CB against liver cancer; F: Minimum binding energy of the active components of CB with core target proteins; G: Molecular docking diagram of some active components.
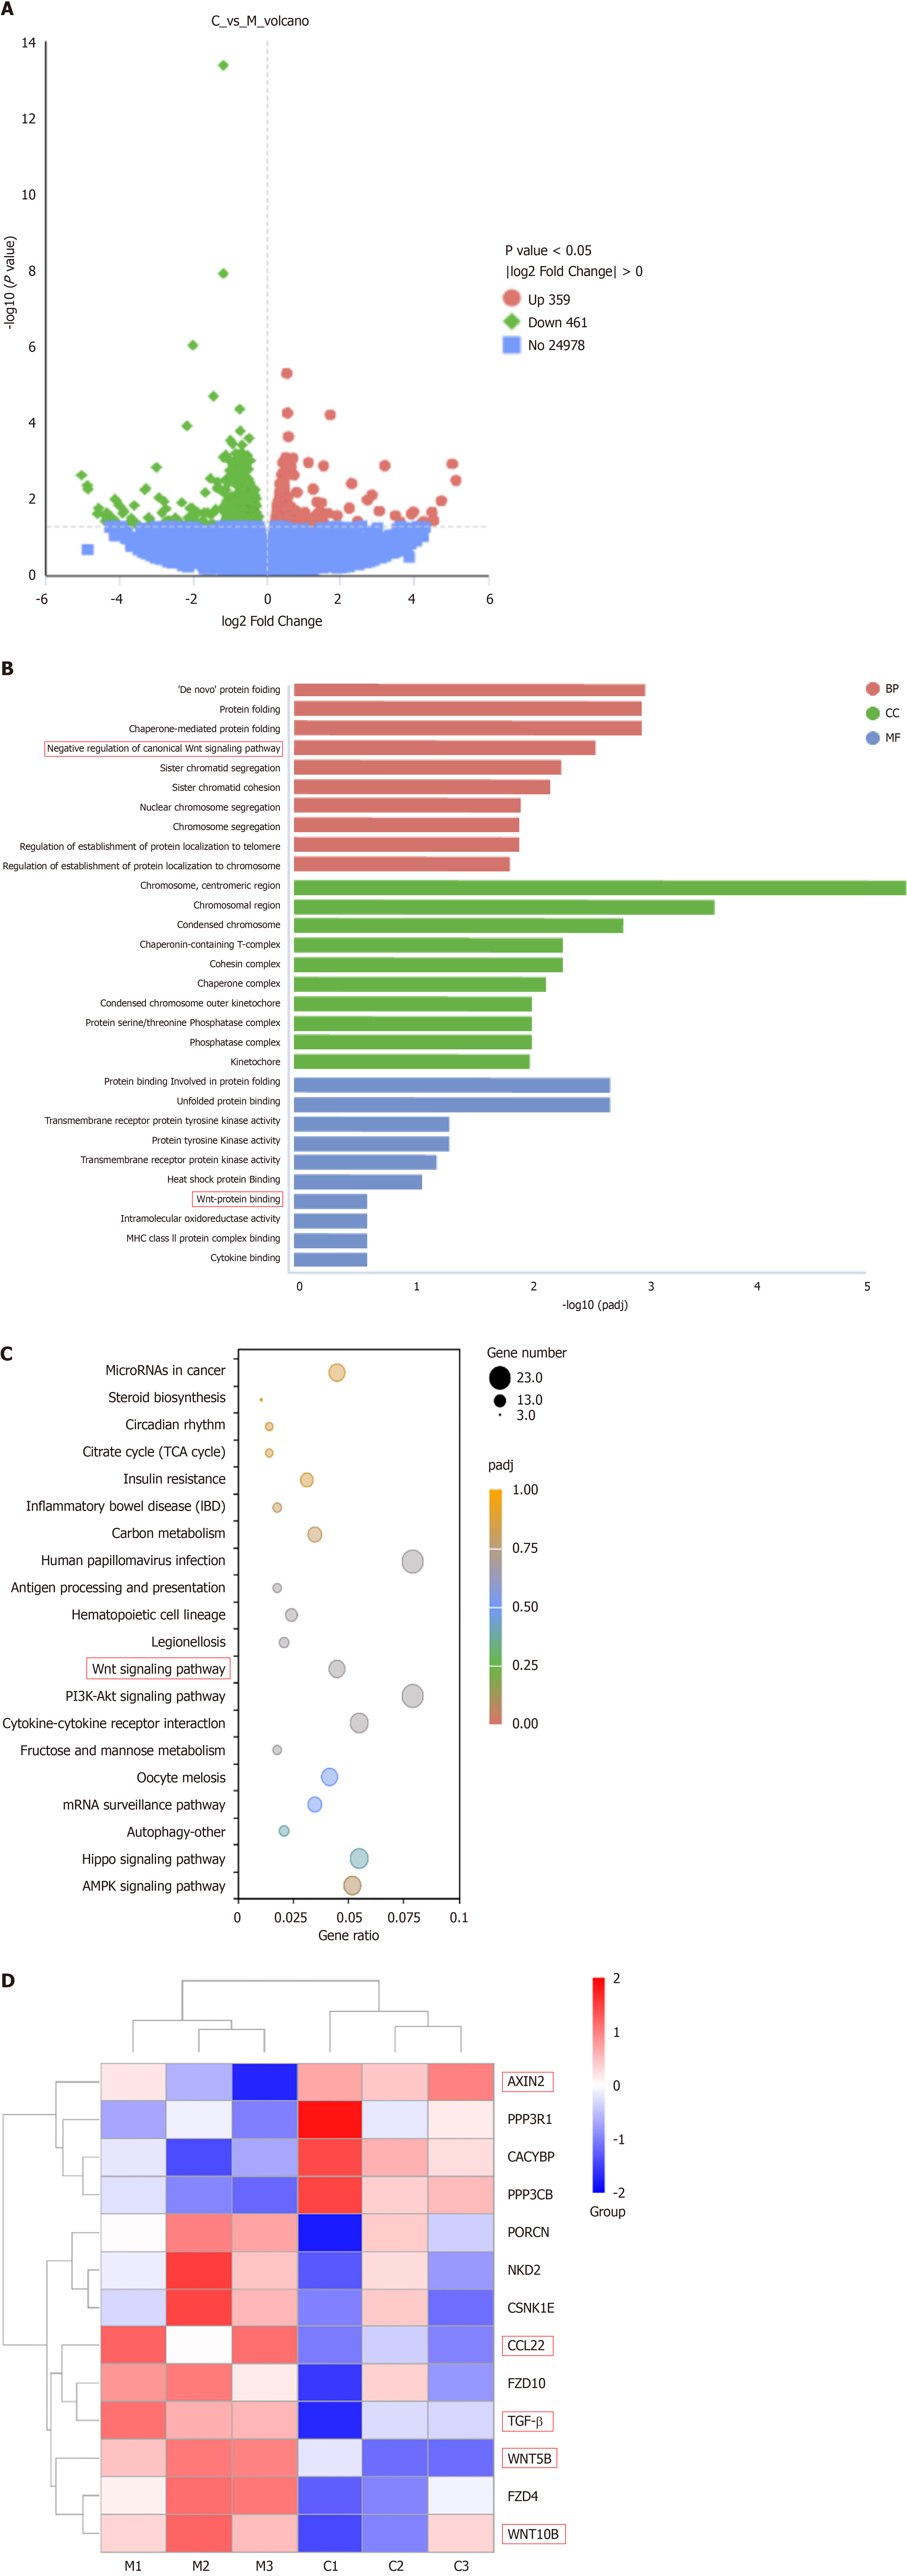
Figure 4 Differentially expressed genes between Calculus bovis-treated group and control group (q < 0.
05 and log2FlodChange > 0) after transcriptome sequences were analyzed by bioinformatics. A: Differential gene volcano plot between the Calculus bovis (CB)-treated and control groups; B: Histogram of Gene Ontology enrichment results of differentially expressed mRNAs in the CB-treated and control groups (top 10); C: Bubble plots of Kyoto Encyclopedia of Genes and Genomes enrichment results of differentially expressed mRNAs in the CB-treated and control groups (top 20); D: Heatmap of selected genes involved in the Wnt pathway.
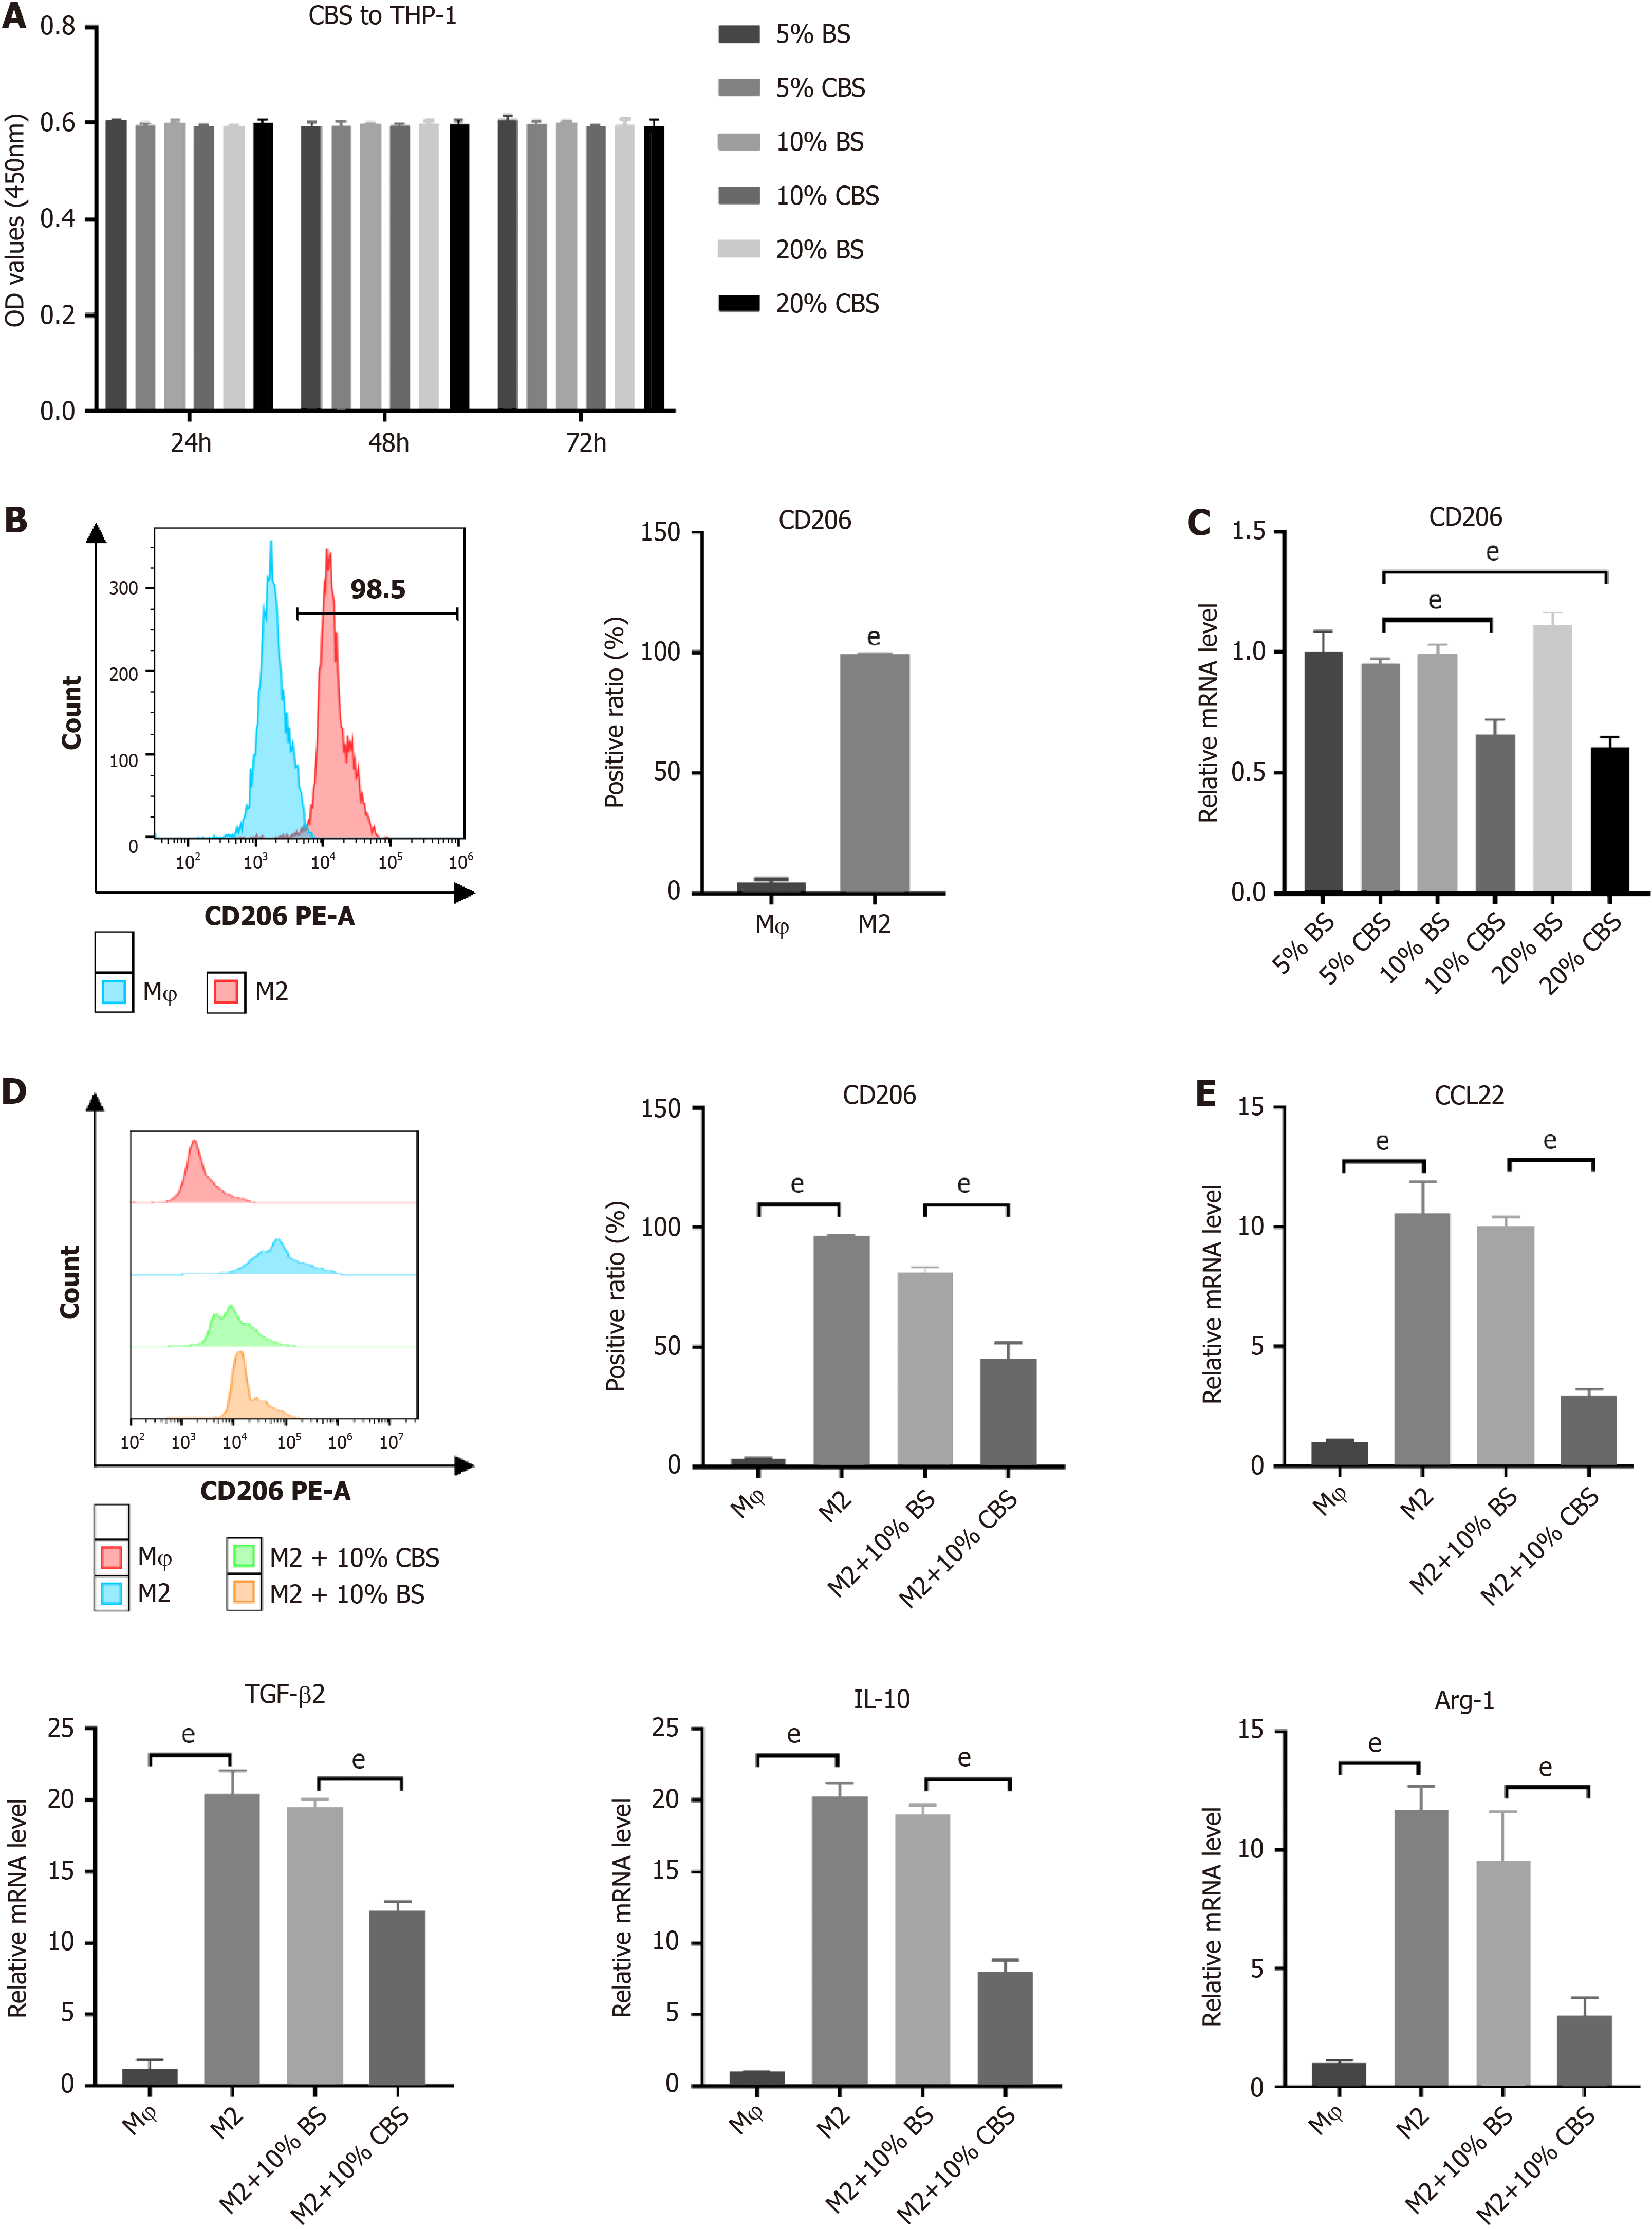
Figure 5 Calculus bovis-enriched serum inhibits polarization of M2 tumor-associated macrophages.
A: Cytotoxicity of Calculus bovis-enriched serum (CBS) on THP-1 cells by Cell Counting Kit-8 assay. The blank group served as a control; B: CD206 quantification in THP-1 cells after IL-4 and IL-13 induction by flow cytometry; C: The mRNA expression levels of CD206 after intervention of M2 tumor-associated macrophages (M2-TAMs) with different concentrations of blank serum and CBS; D: Quantification of CD206 in M2-TAMs after 10% (100 mL/L) CBS intervention by flow cytometry; E: The mRNA expression levels of CCL22, TGF-β2, IL-10, and Arg-1 after 10% (100 mL/L) CBS intervention in M2-TAMs. dP < 0.05, eP < 0.01. BS: Blank serum; CBS: CB-enriched serum.
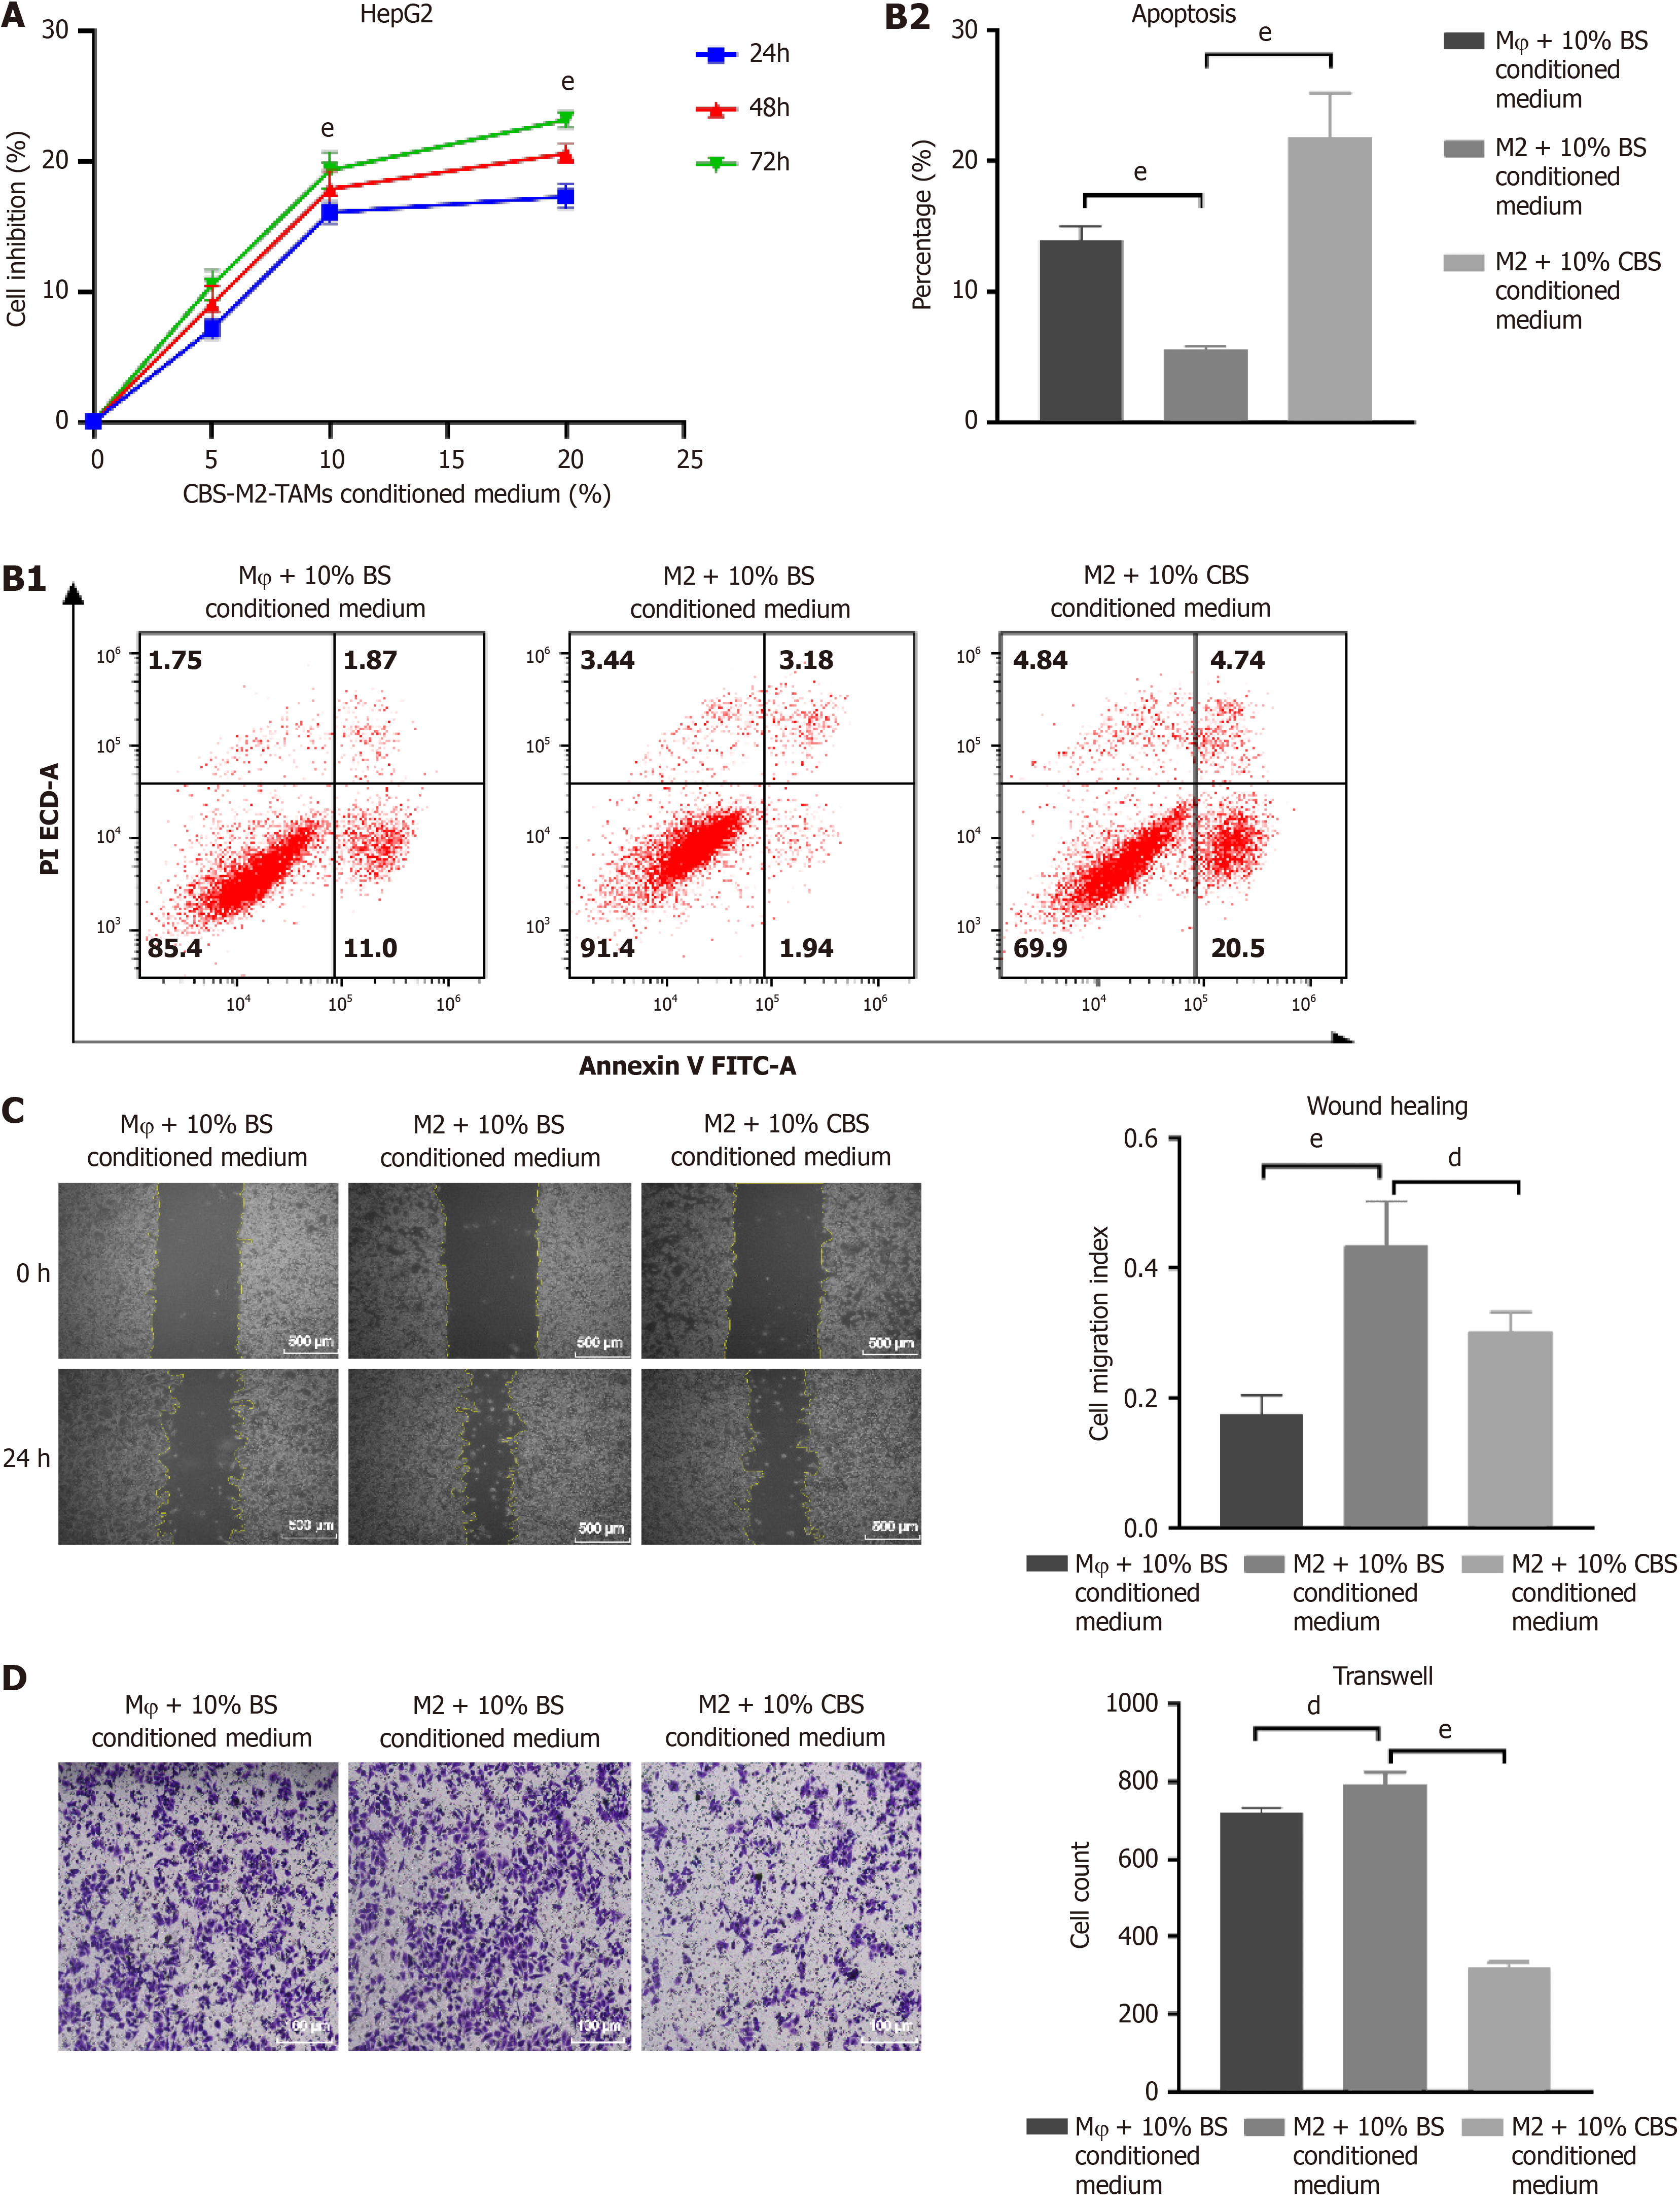
Figure 6 Calculus bovis-enriched serum inhibits polarization of M2 tumor-associated macrophages through the Wnt pathway and suppr
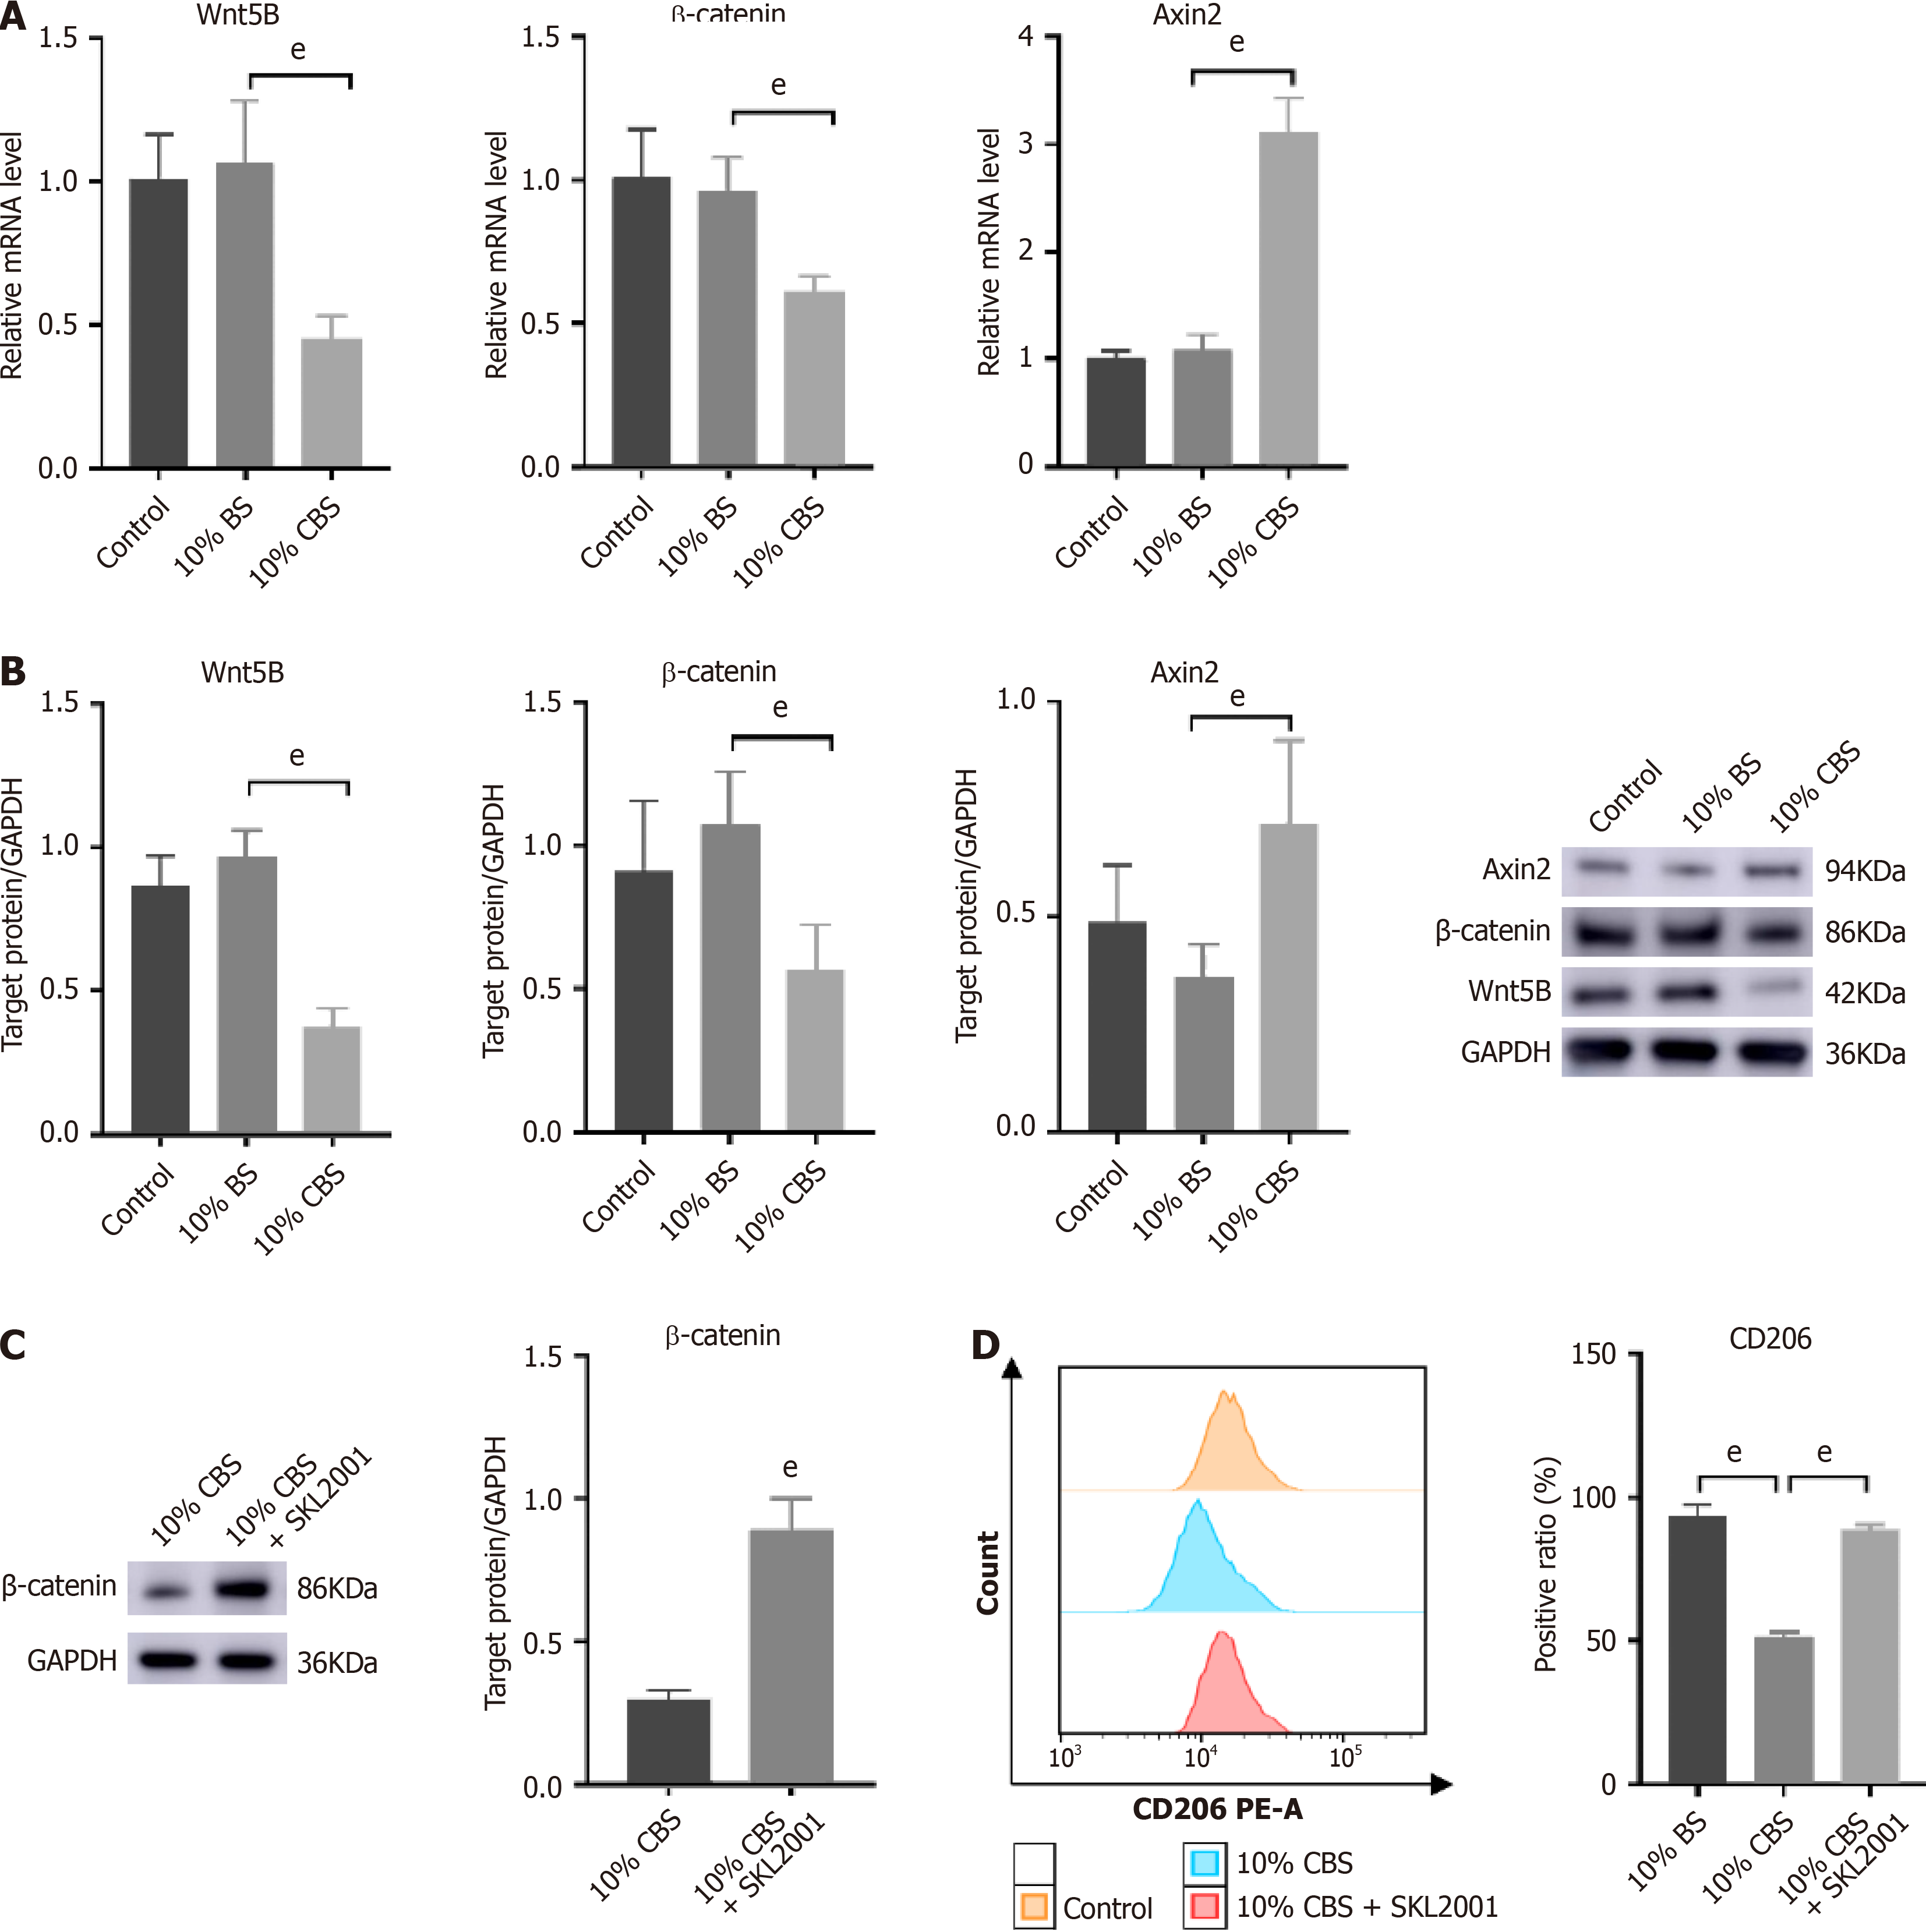
Figure 7 Calculus bovis-enriched serum inhibits polarization of M2 tumor-associated macrophages through the Wnt pathway to suppress against liver cancer.
A: Effect of Calculus bovis-enriched serum (CBS) on Wnt5B, β-catenin, and Axin2 mRNA levels in THP-1 cells detected by real-time reverse transcriptase-polymerase chain reaction; B: Effect of CBS on Wnt5B, β-catenin, and Axin2 protein levels in THP-1 cells detected by Western blot analysis; C: Effect of the Wnt pathway agonist SKL2001 on β-catenin protein expression; D: Changes in CD206 detected by flow cytometry in THP-1 cells after CBS combined with SKL2001 intervention for polarization. eP < 0.01.
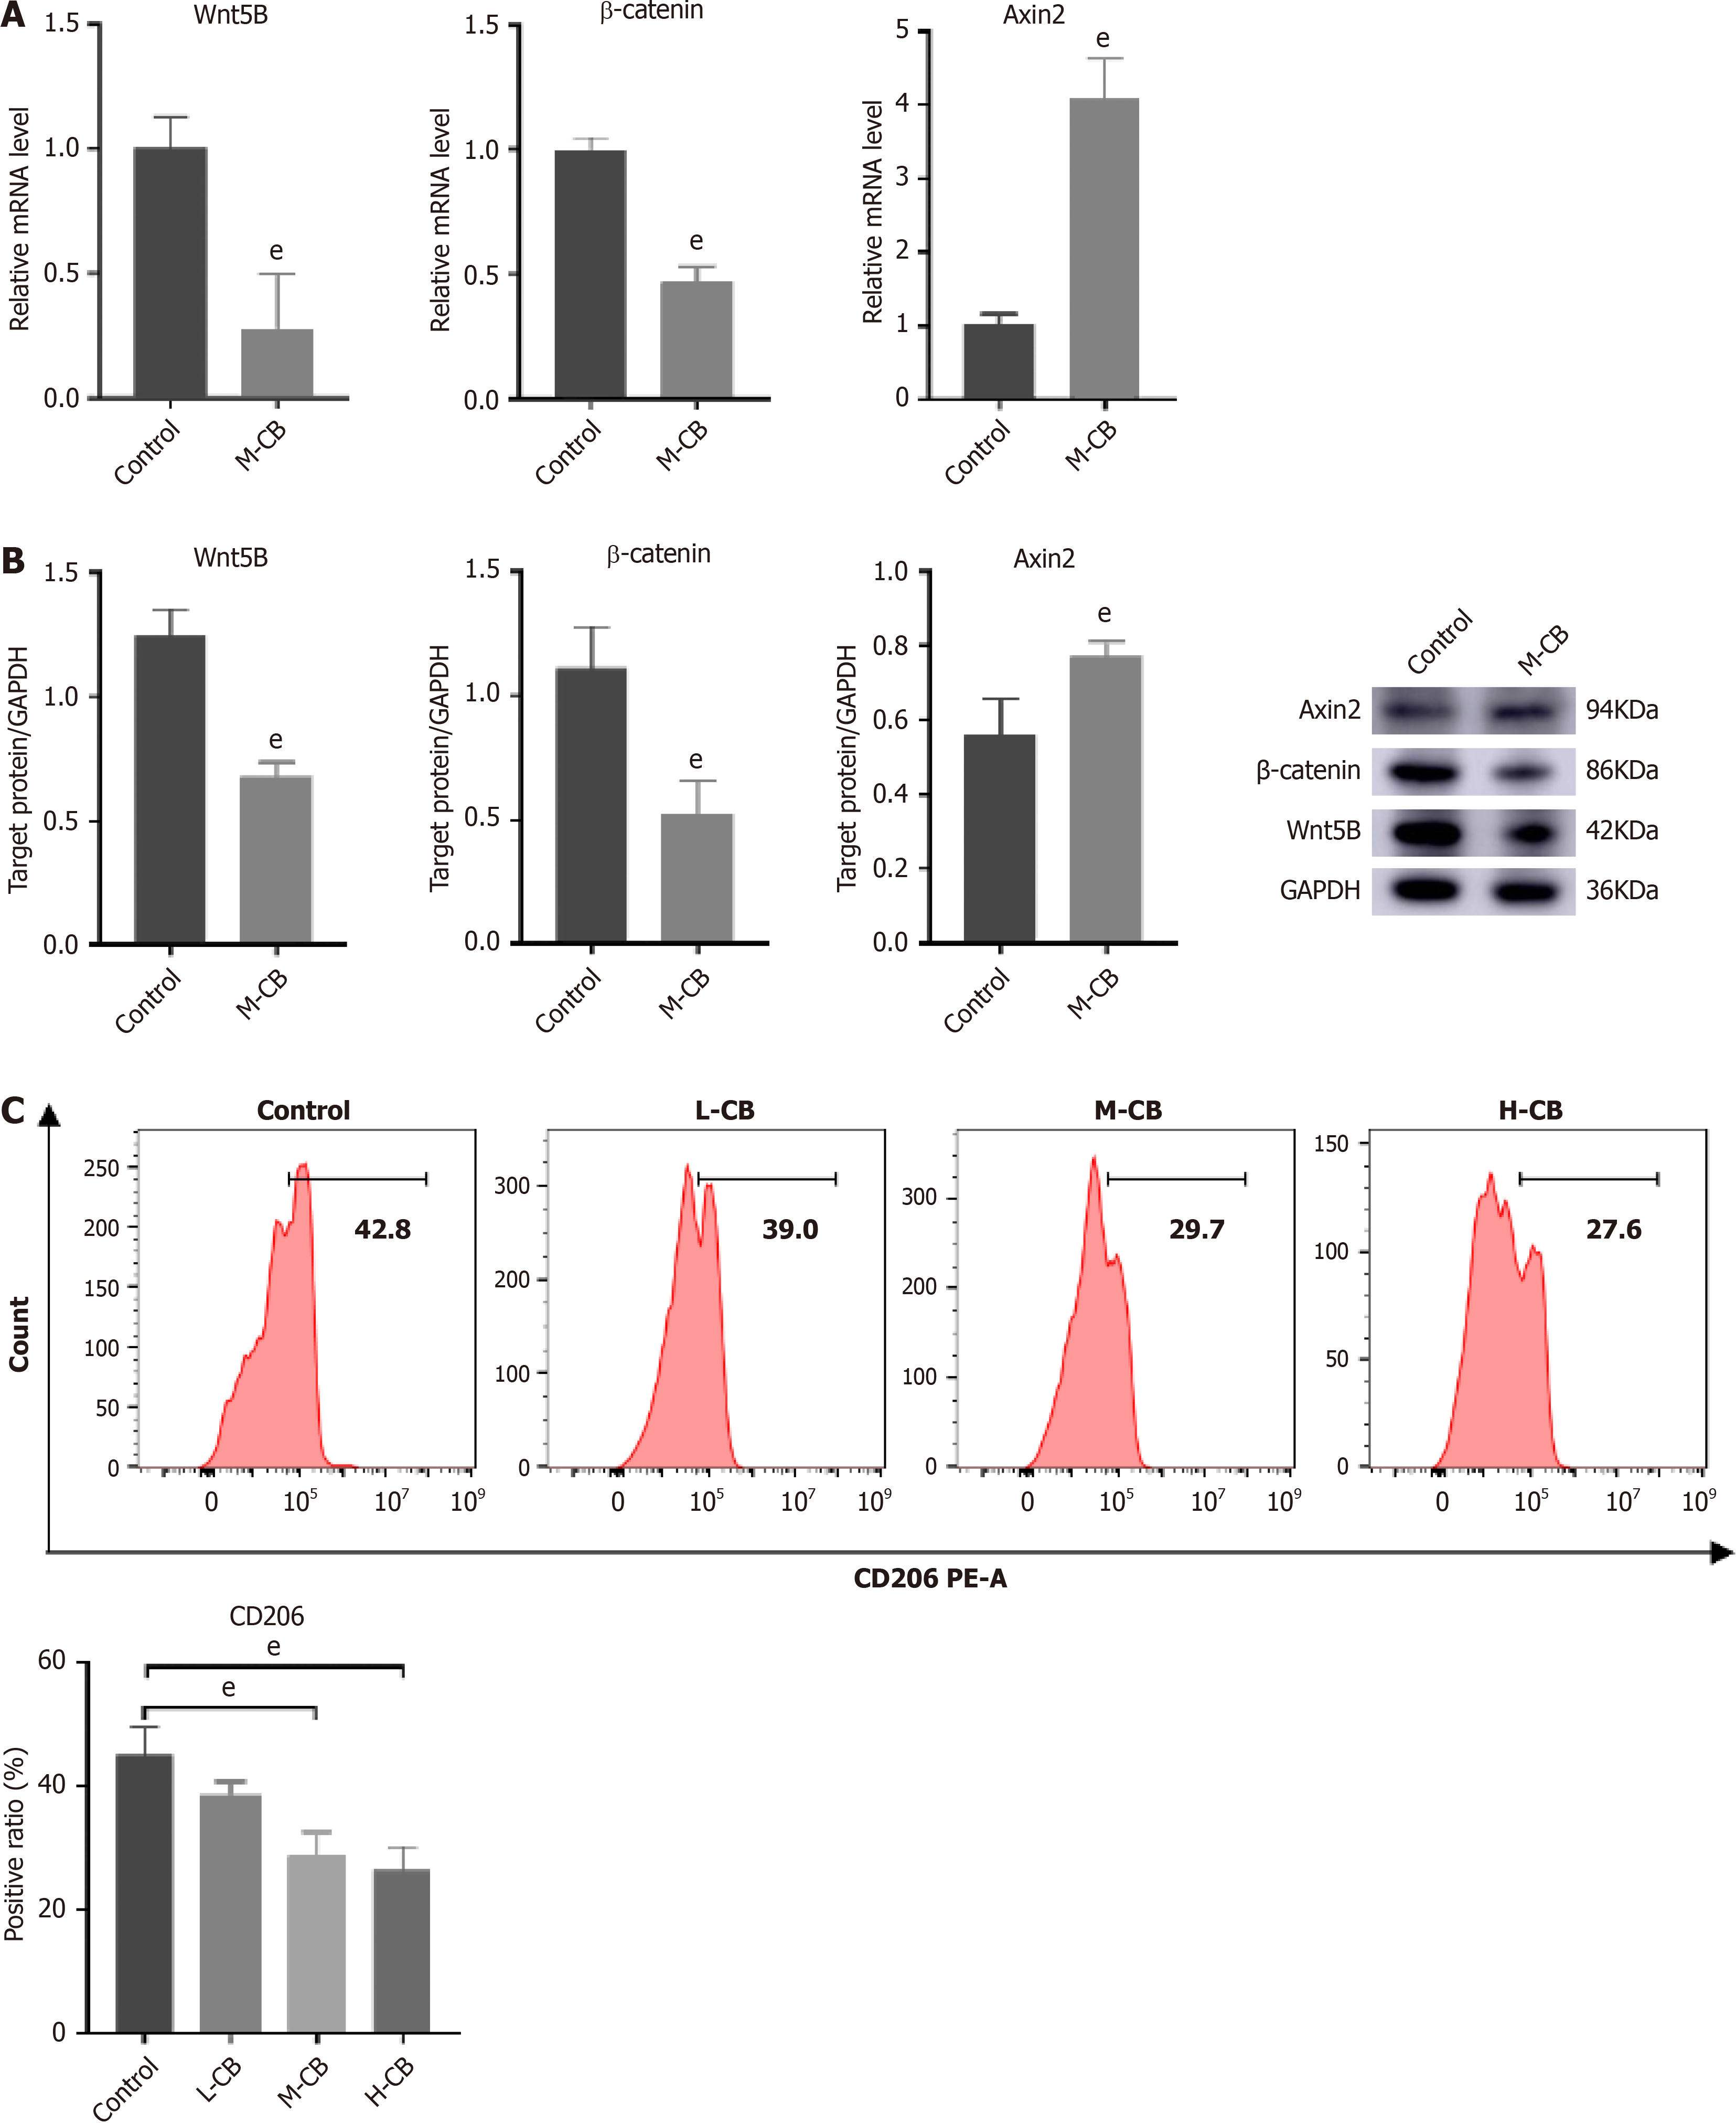
Figure 8 In vivo experimental validation of regulation of M2 macrophage polarization by Calculus bovis through the Wnt pathway.
A: Quantification of mRNA expression of Wnt5B, β-catenin, and Axin2 by real-time reverse transcriptase-polymerase chain reaction; B: Quantification of protein expression of Wnt5B, β-catenin, and Axin2 by Western blot analysis; C: Ratio of cells expressing CD206 molecules in tumor tissues analyzed by flow cytometry. eP < 0.01.
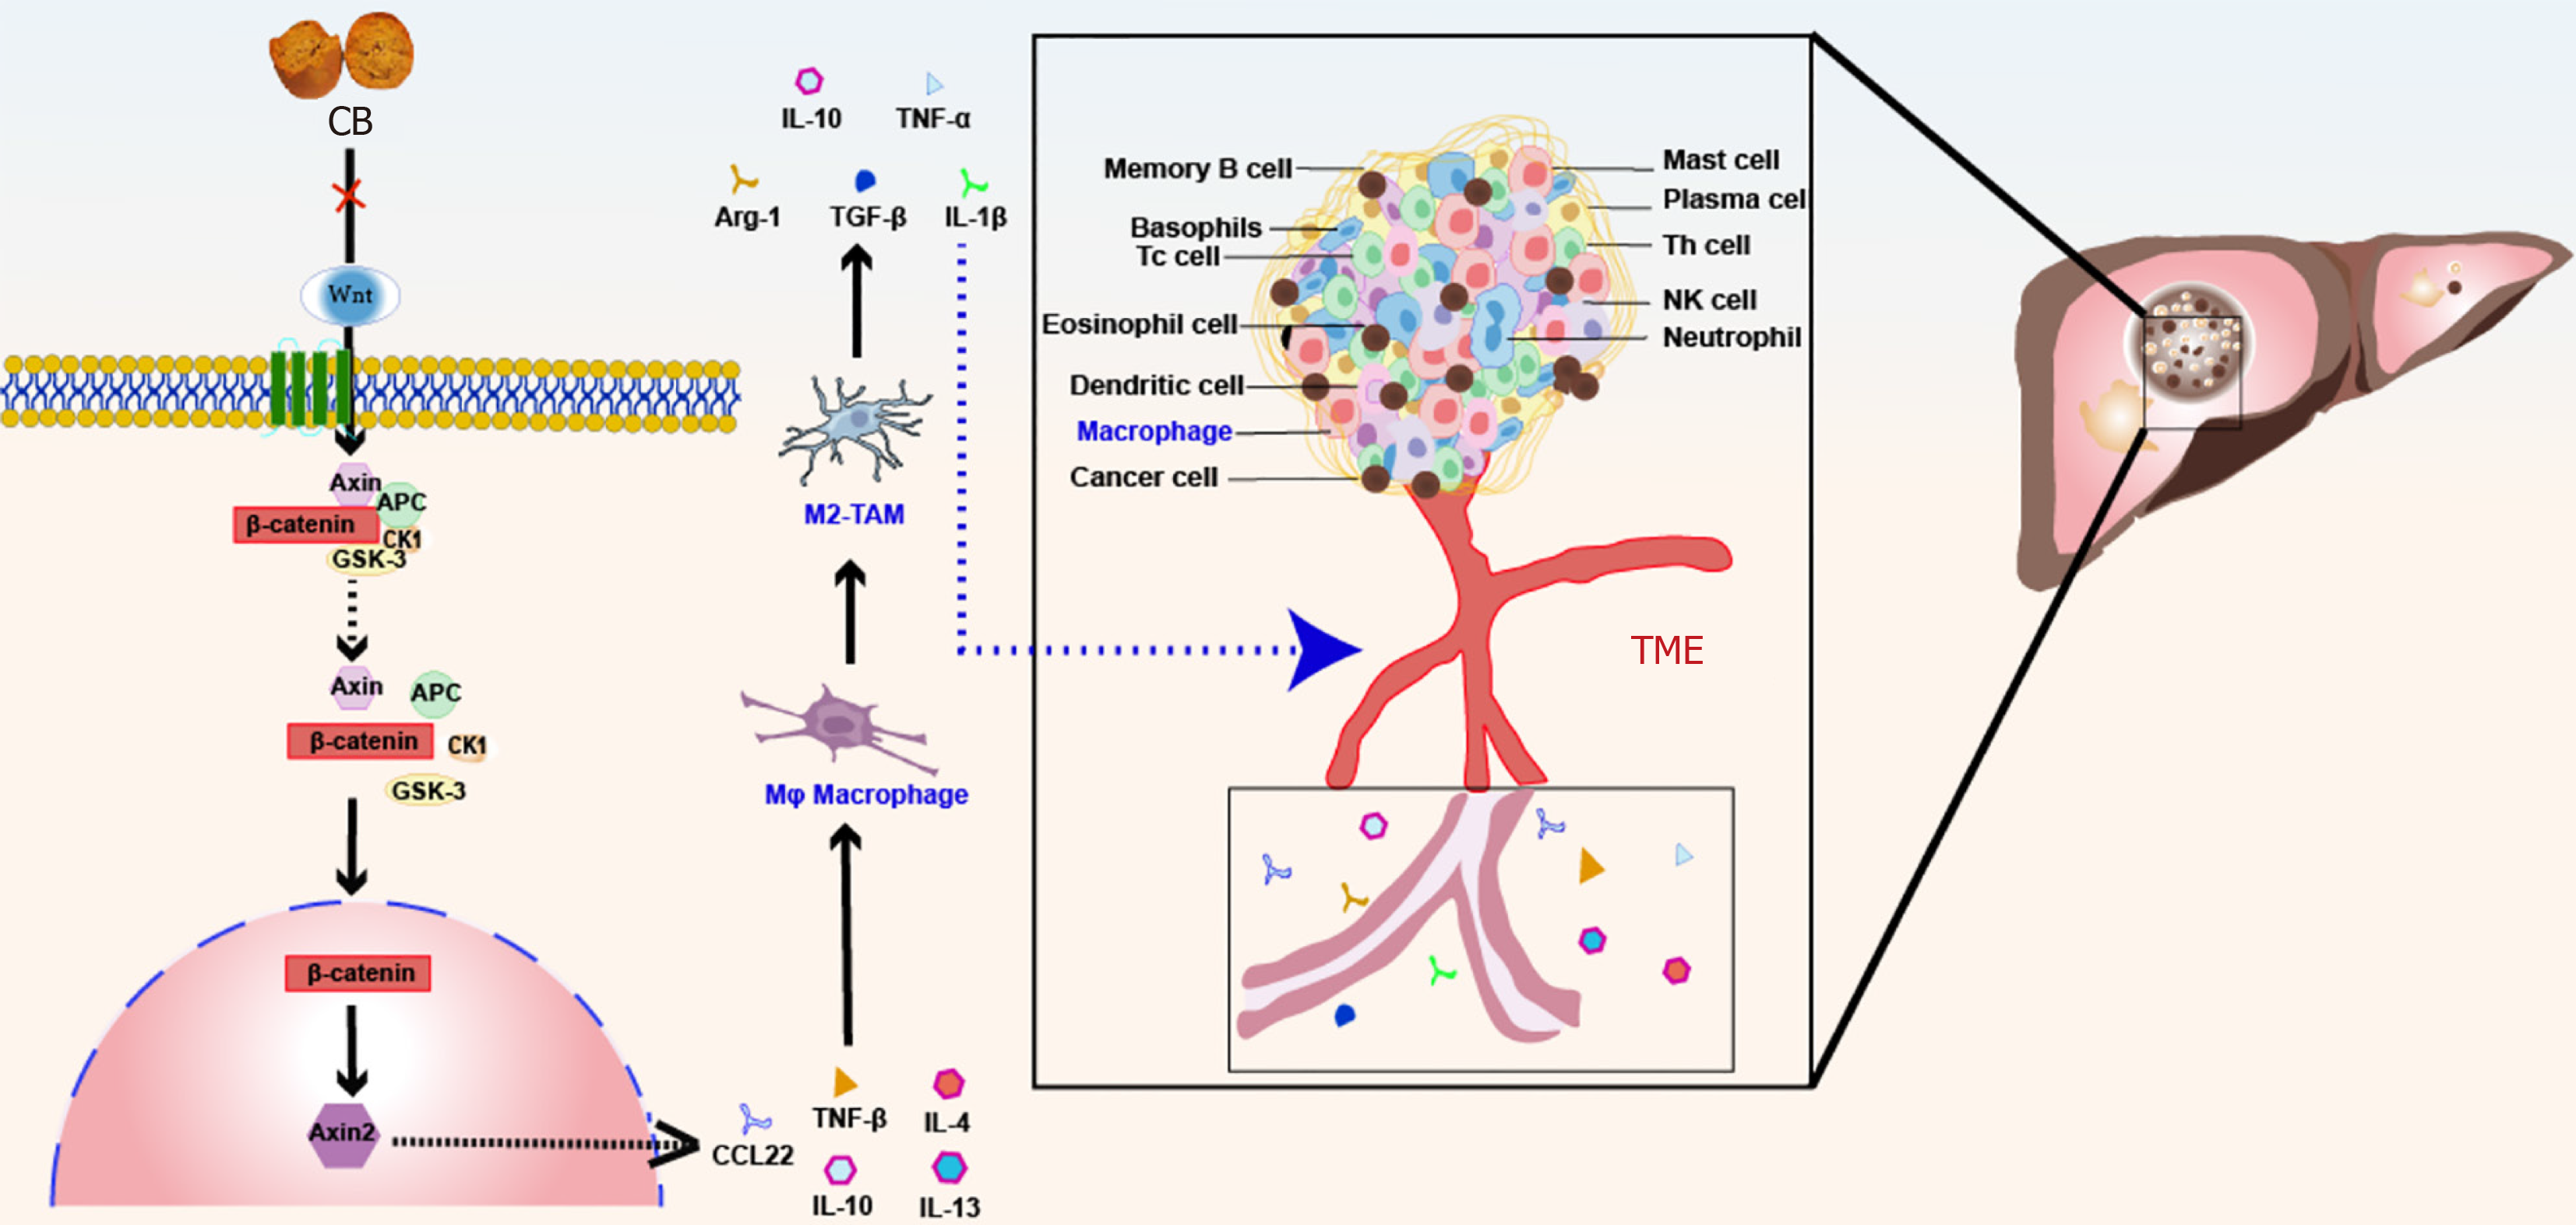
Figure 9 Schematic diagram of anti-liver cancer mechanism of Calculus bovis.
Calculus bovis exerts its anti-liver cancer effect by inhibiting the Wnt/β-catenin pathway and suppressing the polarization of M2 tumor-associated macrophage. M2-TAMs: M2 tumor-associated macrophages; TME: Tumor microenvironment.
- Citation: Huang Z, Meng FY, Lu LZ, Guo QQ, Lv CJ, Tan NH, Deng Z, Chen JY, Zhang ZS, Zou B, Long HP, Zhou Q, Tian S, Mei S, Tian XF. Calculus bovis inhibits M2 tumor-associated macrophage polarization via Wnt/β-catenin pathway modulation to suppress liver cancer. World J Gastroenterol 2024; 30(29): 3511-3533
- URL: https://www.wjgnet.com/1007-9327/full/v30/i29/3511.htm
- DOI: https://dx.doi.org/10.3748/wjg.v30.i29.3511


