Copyright
©The Author(s) 2024.
World J Gastroenterol. Jul 28, 2024; 30(28): 3403-3417
Published online Jul 28, 2024. doi: 10.3748/wjg.v30.i28.3403
Published online Jul 28, 2024. doi: 10.3748/wjg.v30.i28.3403
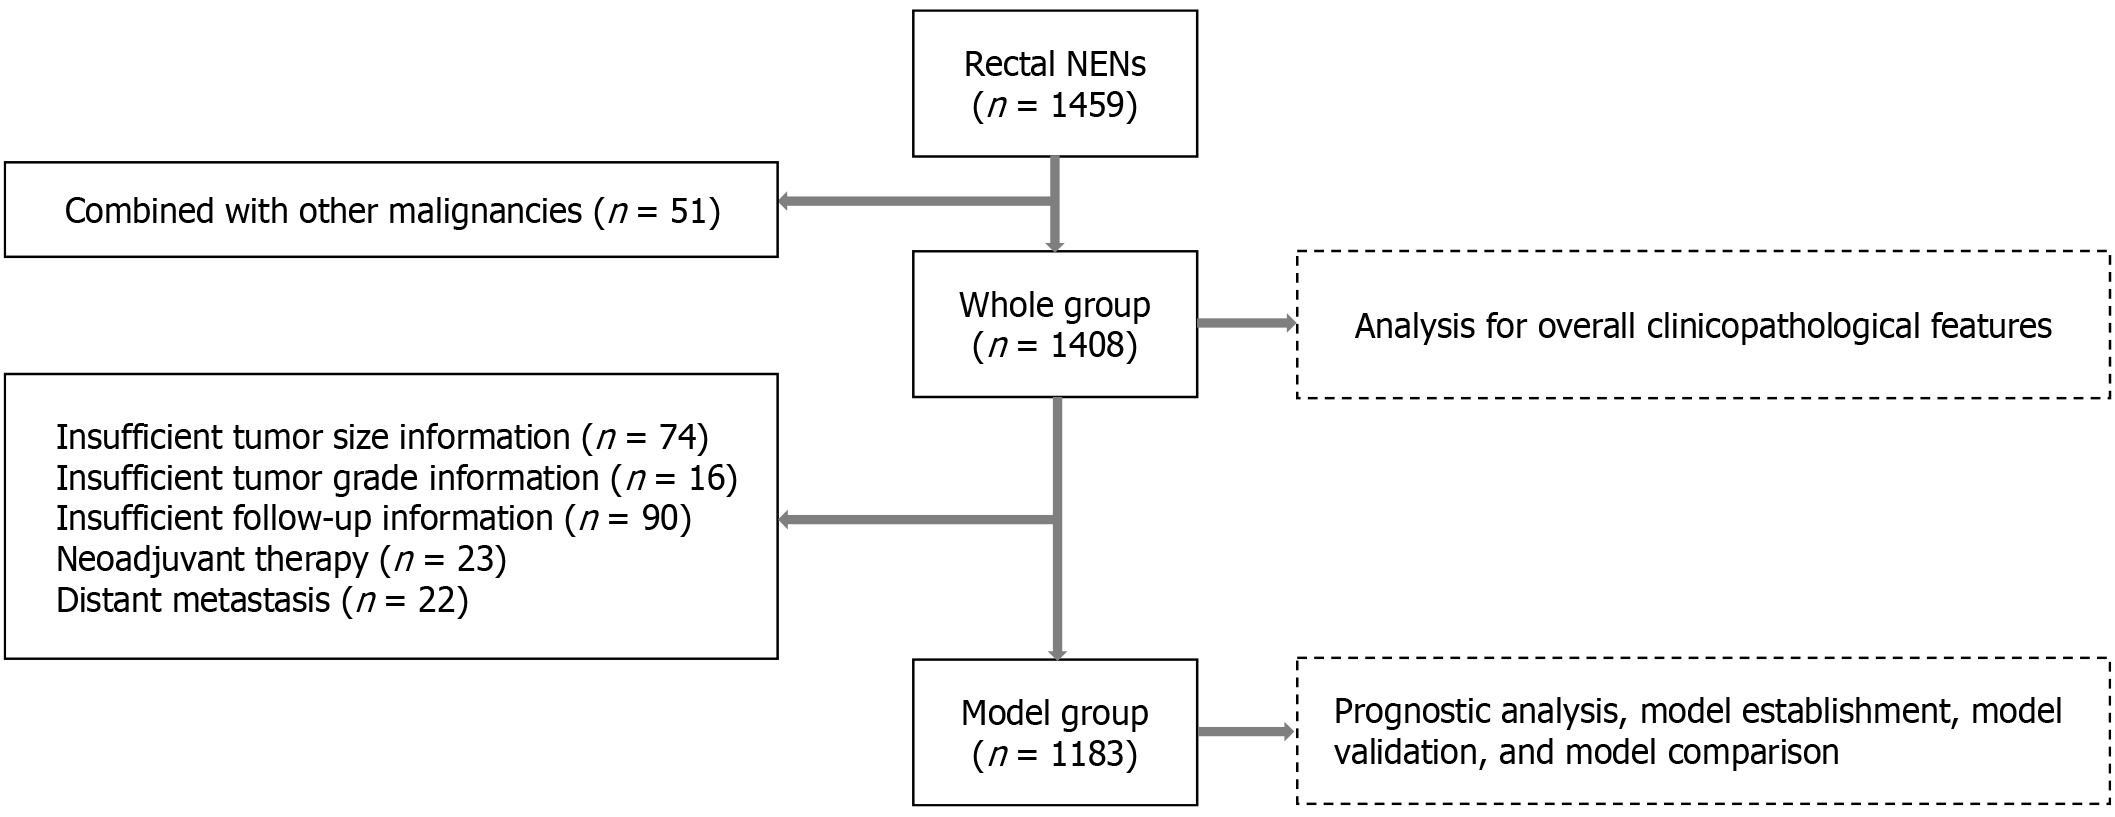
Figure 1 Patient selection flowchart.
NENs: Neuroendocrine neoplasms.
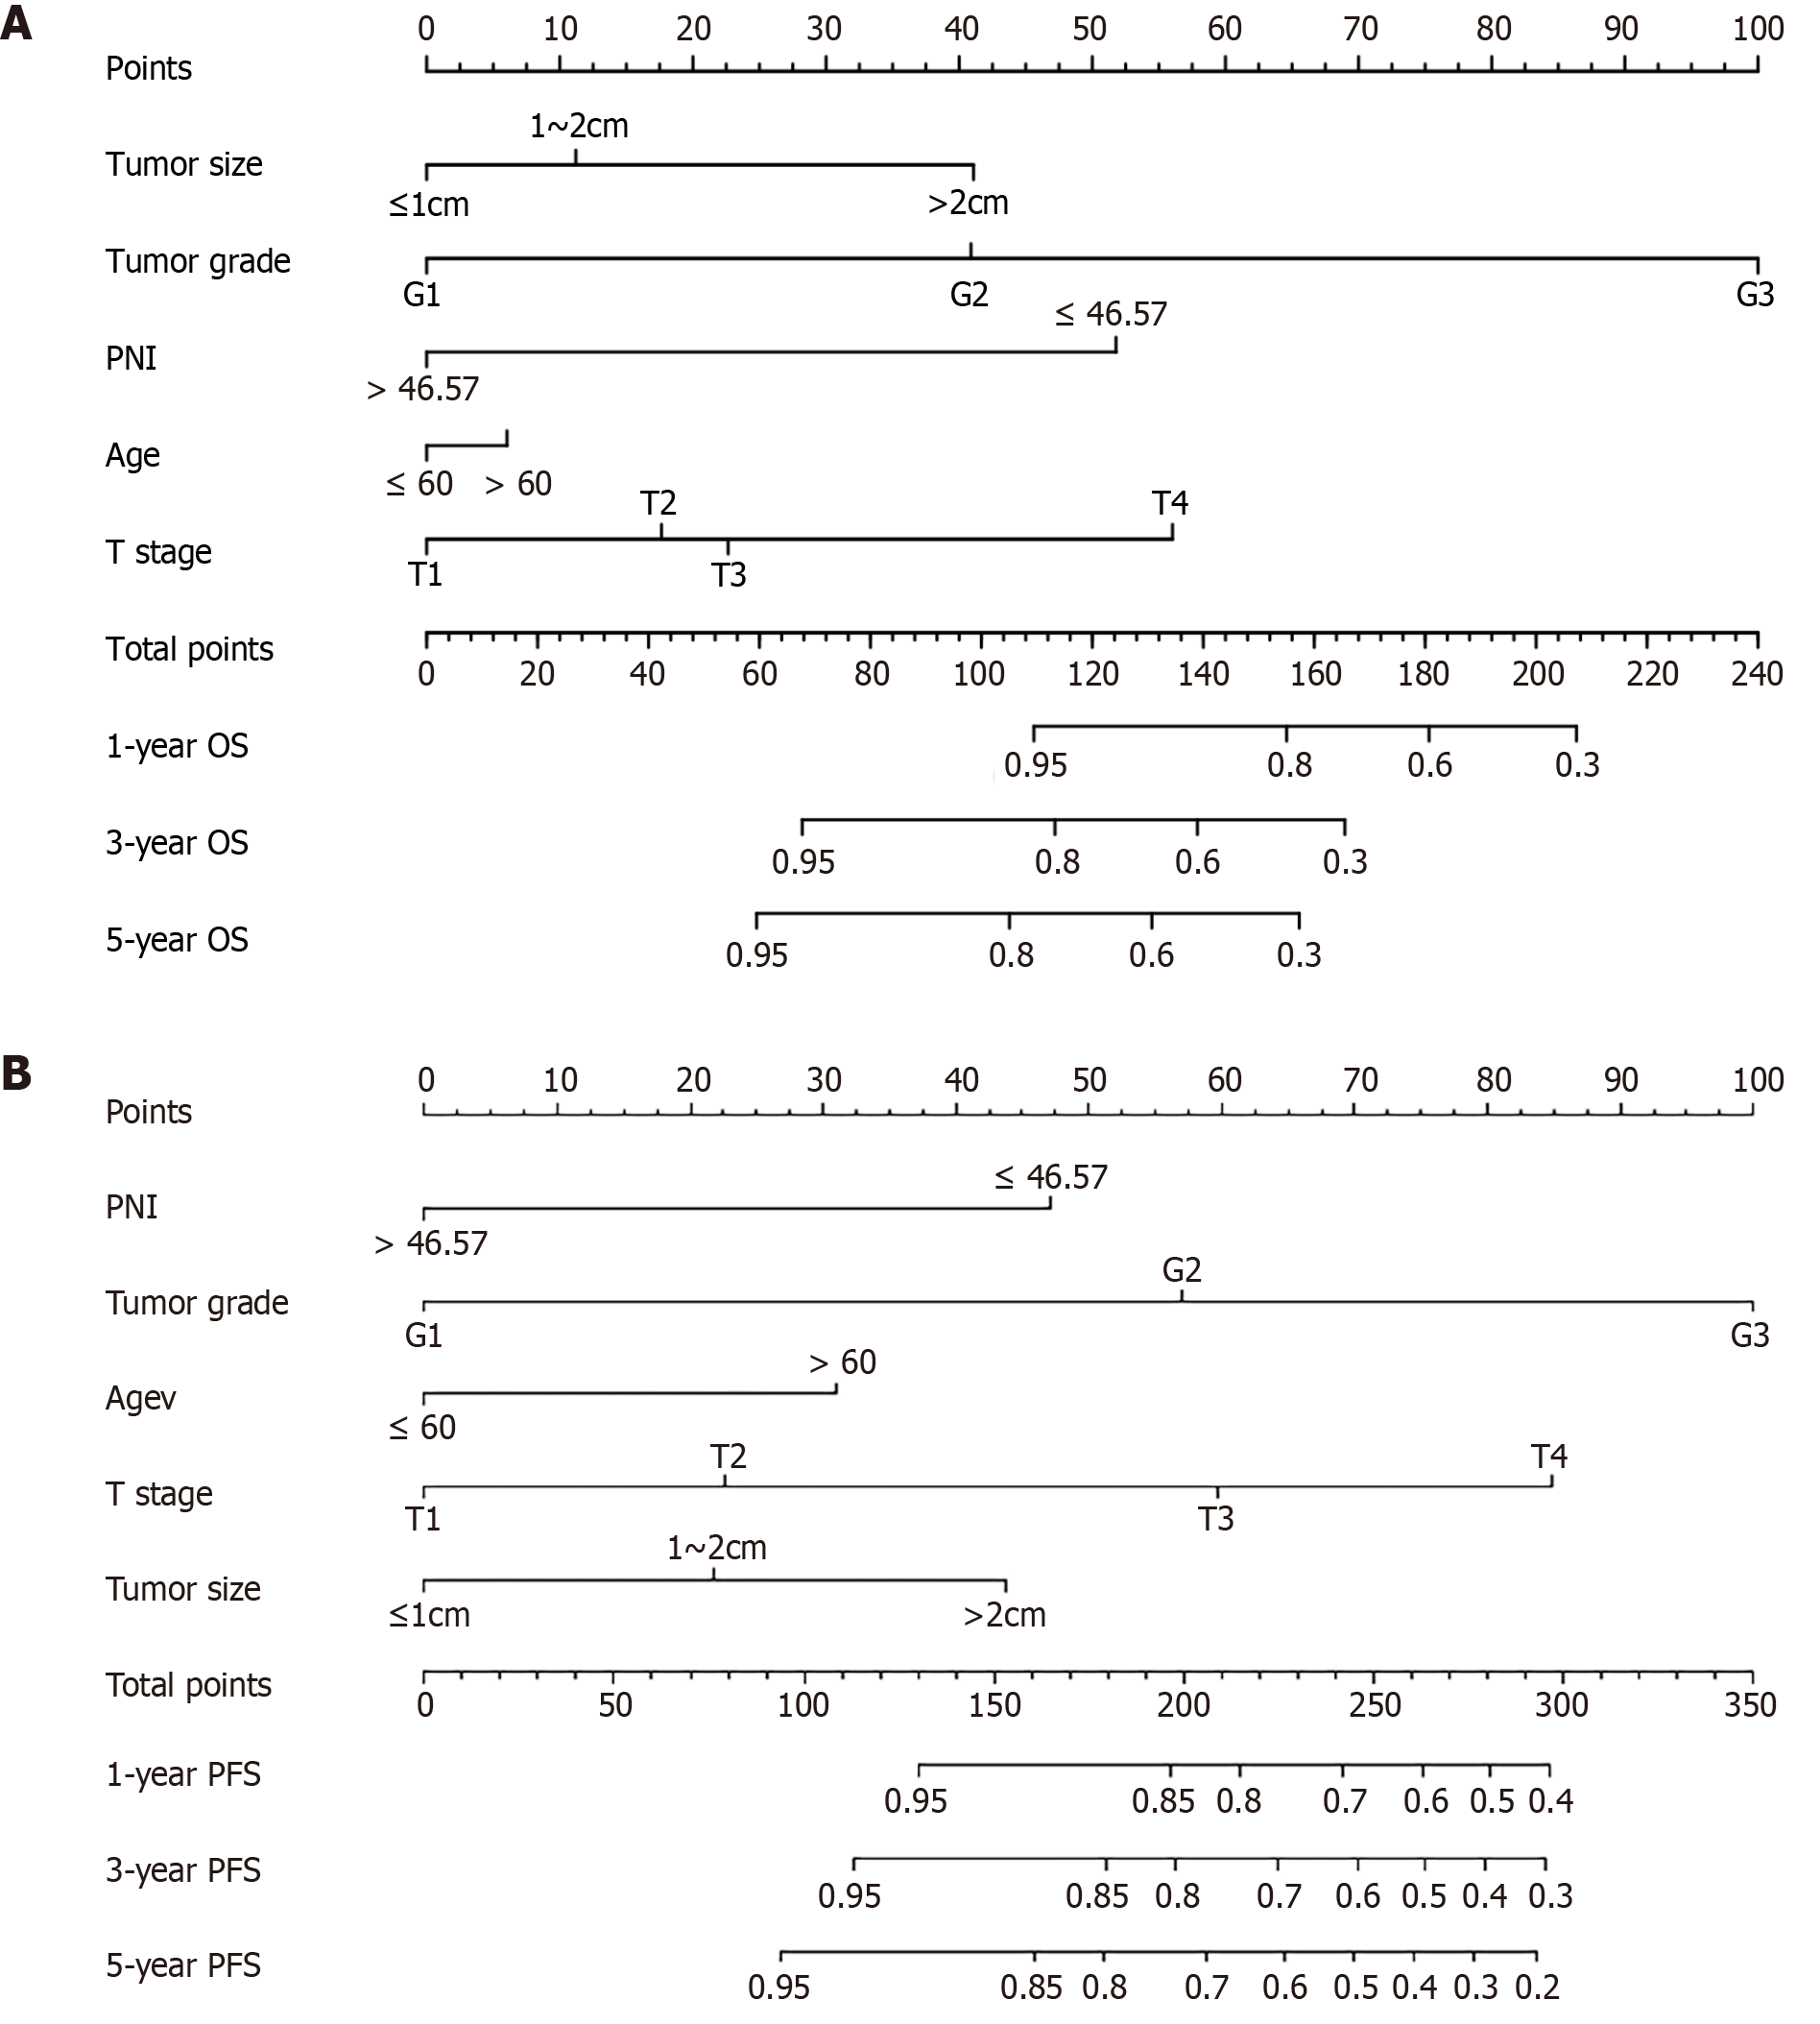
Figure 2 The GATIS score.
A: Nomogram for overall survival prediction; B: Nomogram for progression free survival prediction. PNI: Prognostic nutritional index; OS: Overall survival; PFS: Progression free survival.
Figure 3 Nomogram validation for overall survival prediction.
A: Calibration plot of 3-year overall survival (OS) for the training set; B: Calibration plot of 5-year OS for the training set; C: Calibration plot of 3-year OS for the validation set; D: Calibration plot of 5-year OS for the validation set; E: The decision curve analysis for OS; F: Time-dependent area under the receiver operating characteristic curve analysis for OS. OS: Overall survival; PNI: Prognostic nutritional index; AUC: Area under the receiver operating characteristic curve.
Figure 4 Nomogram validation for progression free survival prediction.
A: Calibration plot of 3-year progression free survival (PFS) for the training set; B: Calibration plot of 5-year PFS for the training set; C: Calibration plot of 3-year PFS for the validation set; D: Calibration plot of 5-year PFS for the validation set; E: The decision curve analysis for PFS; F: Time-dependent area under the receiver operating characteristic curve analysis for PFS. PFS: Progression free survival; PNI: Prognostic nutritional index; AUC: Area under the receiver operating characteristic curve.
- Citation: Zeng XY, Zhong M, Lin GL, Li CG, Jiang WZ, Zhang W, Xia LJ, Di MJ, Wu HX, Liao XF, Sun YM, Yu MH, Tao KX, Li Y, Zhang R, Zhang P. GATIS score for predicting the prognosis of rectal neuroendocrine neoplasms: A Chinese multicenter study of 12-year experience. World J Gastroenterol 2024; 30(28): 3403-3417
- URL: https://www.wjgnet.com/1007-9327/full/v30/i28/3403.htm
- DOI: https://dx.doi.org/10.3748/wjg.v30.i28.3403


