Copyright
©The Author(s) 2024.
World J Gastroenterol. Jul 21, 2024; 30(27): 3314-3325
Published online Jul 21, 2024. doi: 10.3748/wjg.v30.i27.3314
Published online Jul 21, 2024. doi: 10.3748/wjg.v30.i27.3314
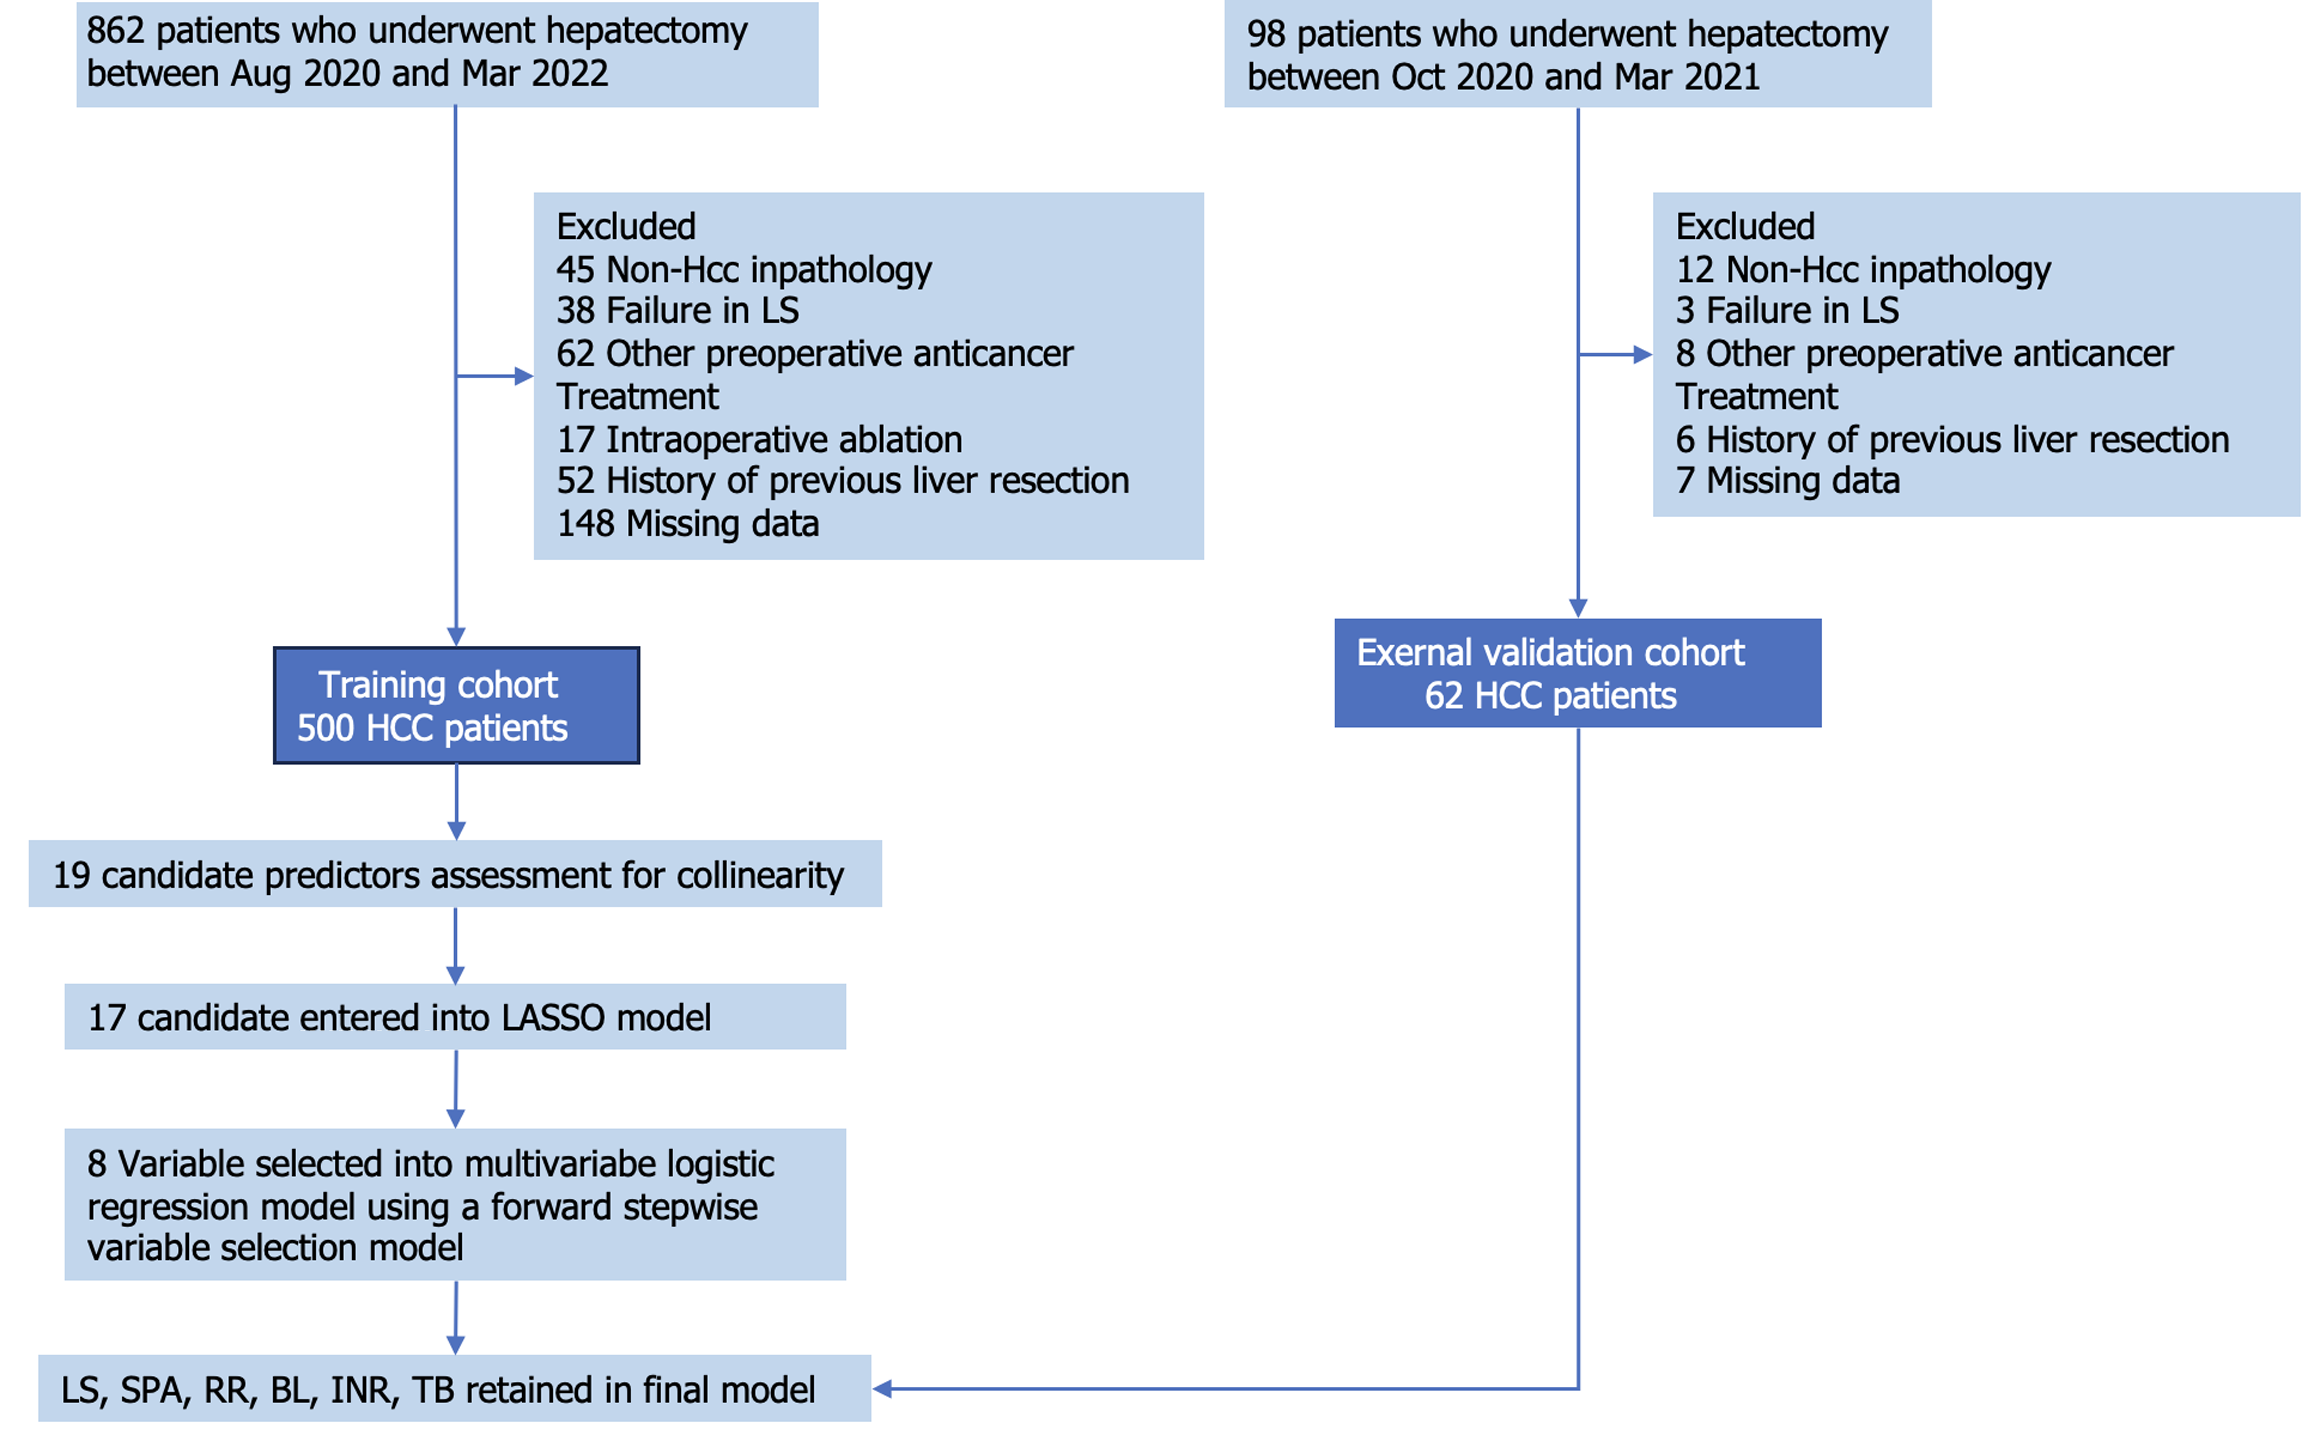
Figure 1 Flow chart of the cohorts in the study.
BL: Blood loss; HCC: Hepatocellular carcinoma; INR: International normalized ratio; LASSO: Least absolute shrinkage and selection operator; LS: Liver stiffness RR: Resection range; SPA: Spleen area; TB: Total bilirubin.
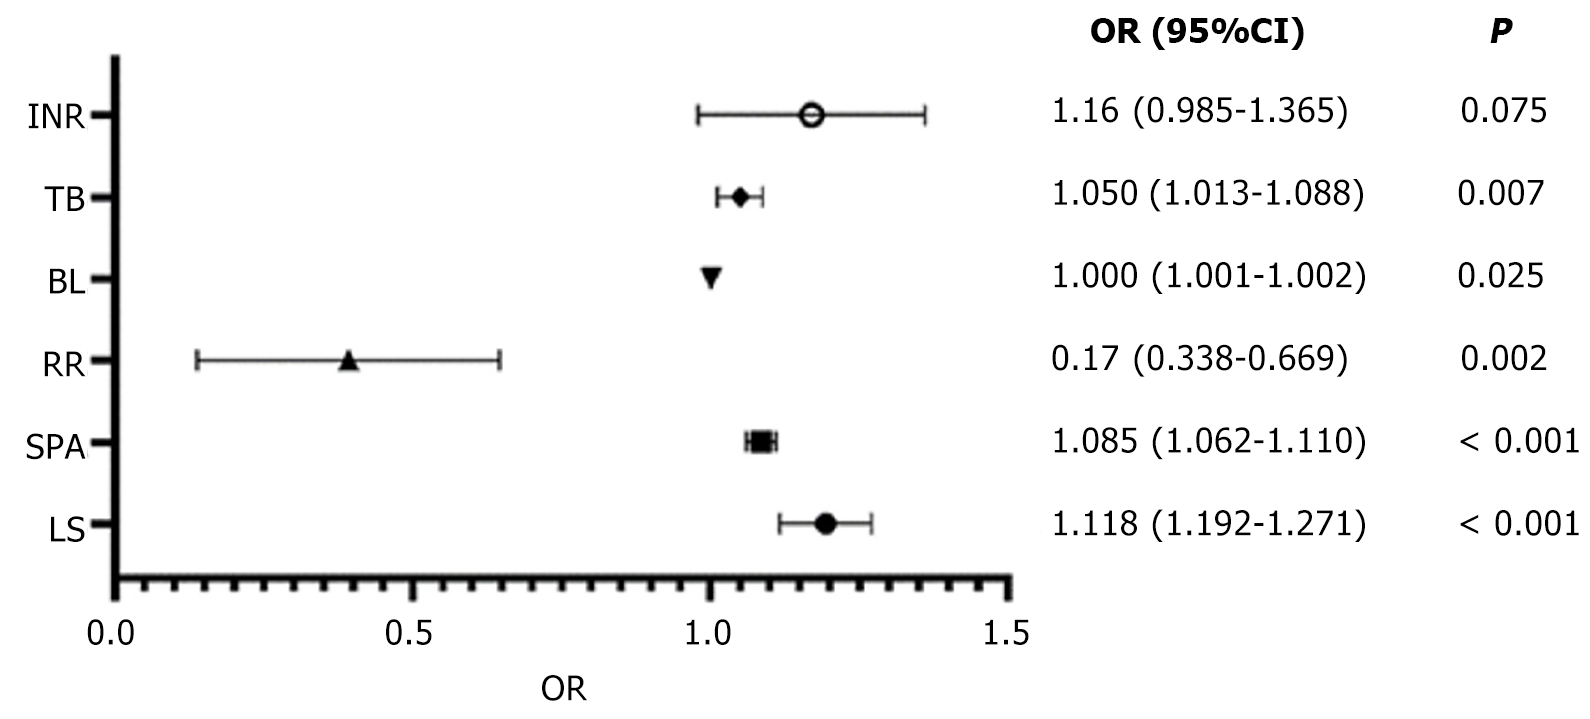
Figure 2 Forest plot of odds ratio for the multiple variables in logistic regression analysis.
95%CI: 95% confidence interval; BL: Blood loss; INR: International normalized ratio; LS: Liver stiffness OR: Odds ratio; RR: Resection range; SPA: Spleen area; TB: Total bilirubin.
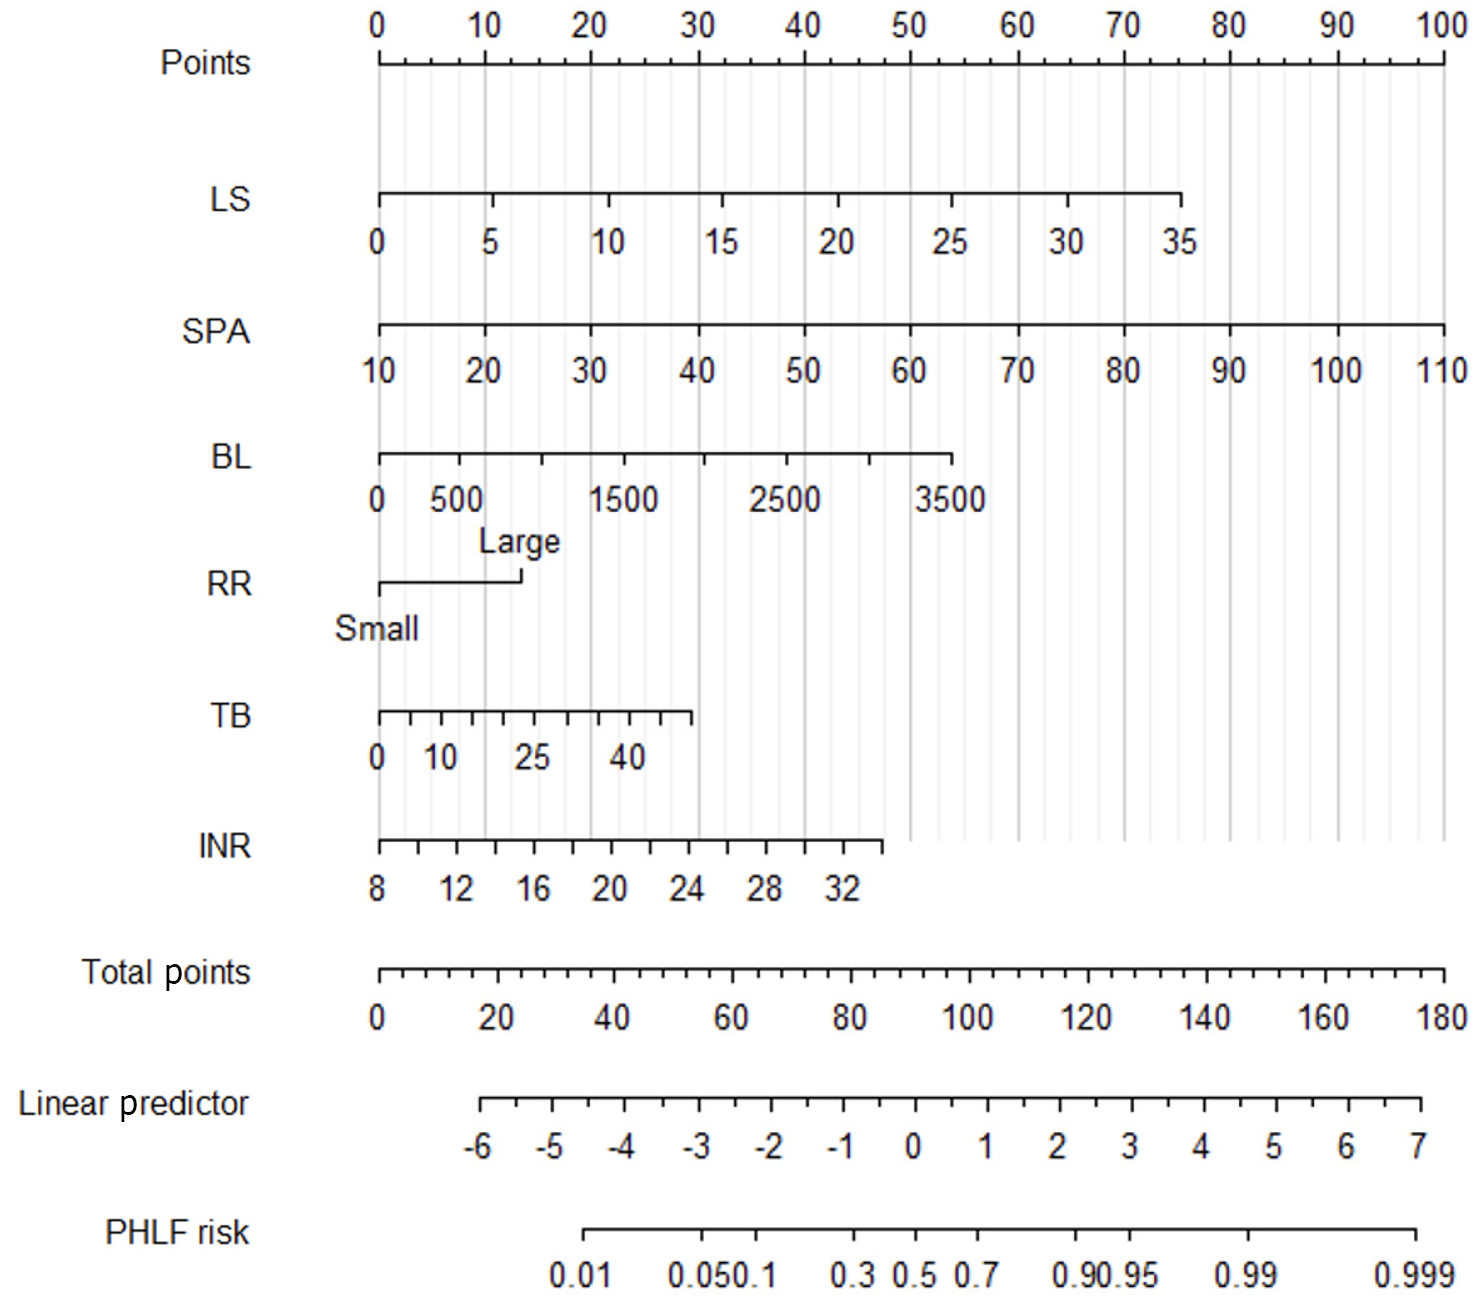
Figure 3 Nomogram of posthepatectomy liver failure model.
BL: Blood loss; INR: International normalized ratio; LS: Liver stiffness; PHLF: Post-hepatectomy liver failure; RR: Resection range; SPA: Spleen area; TB: Total bilirubin.
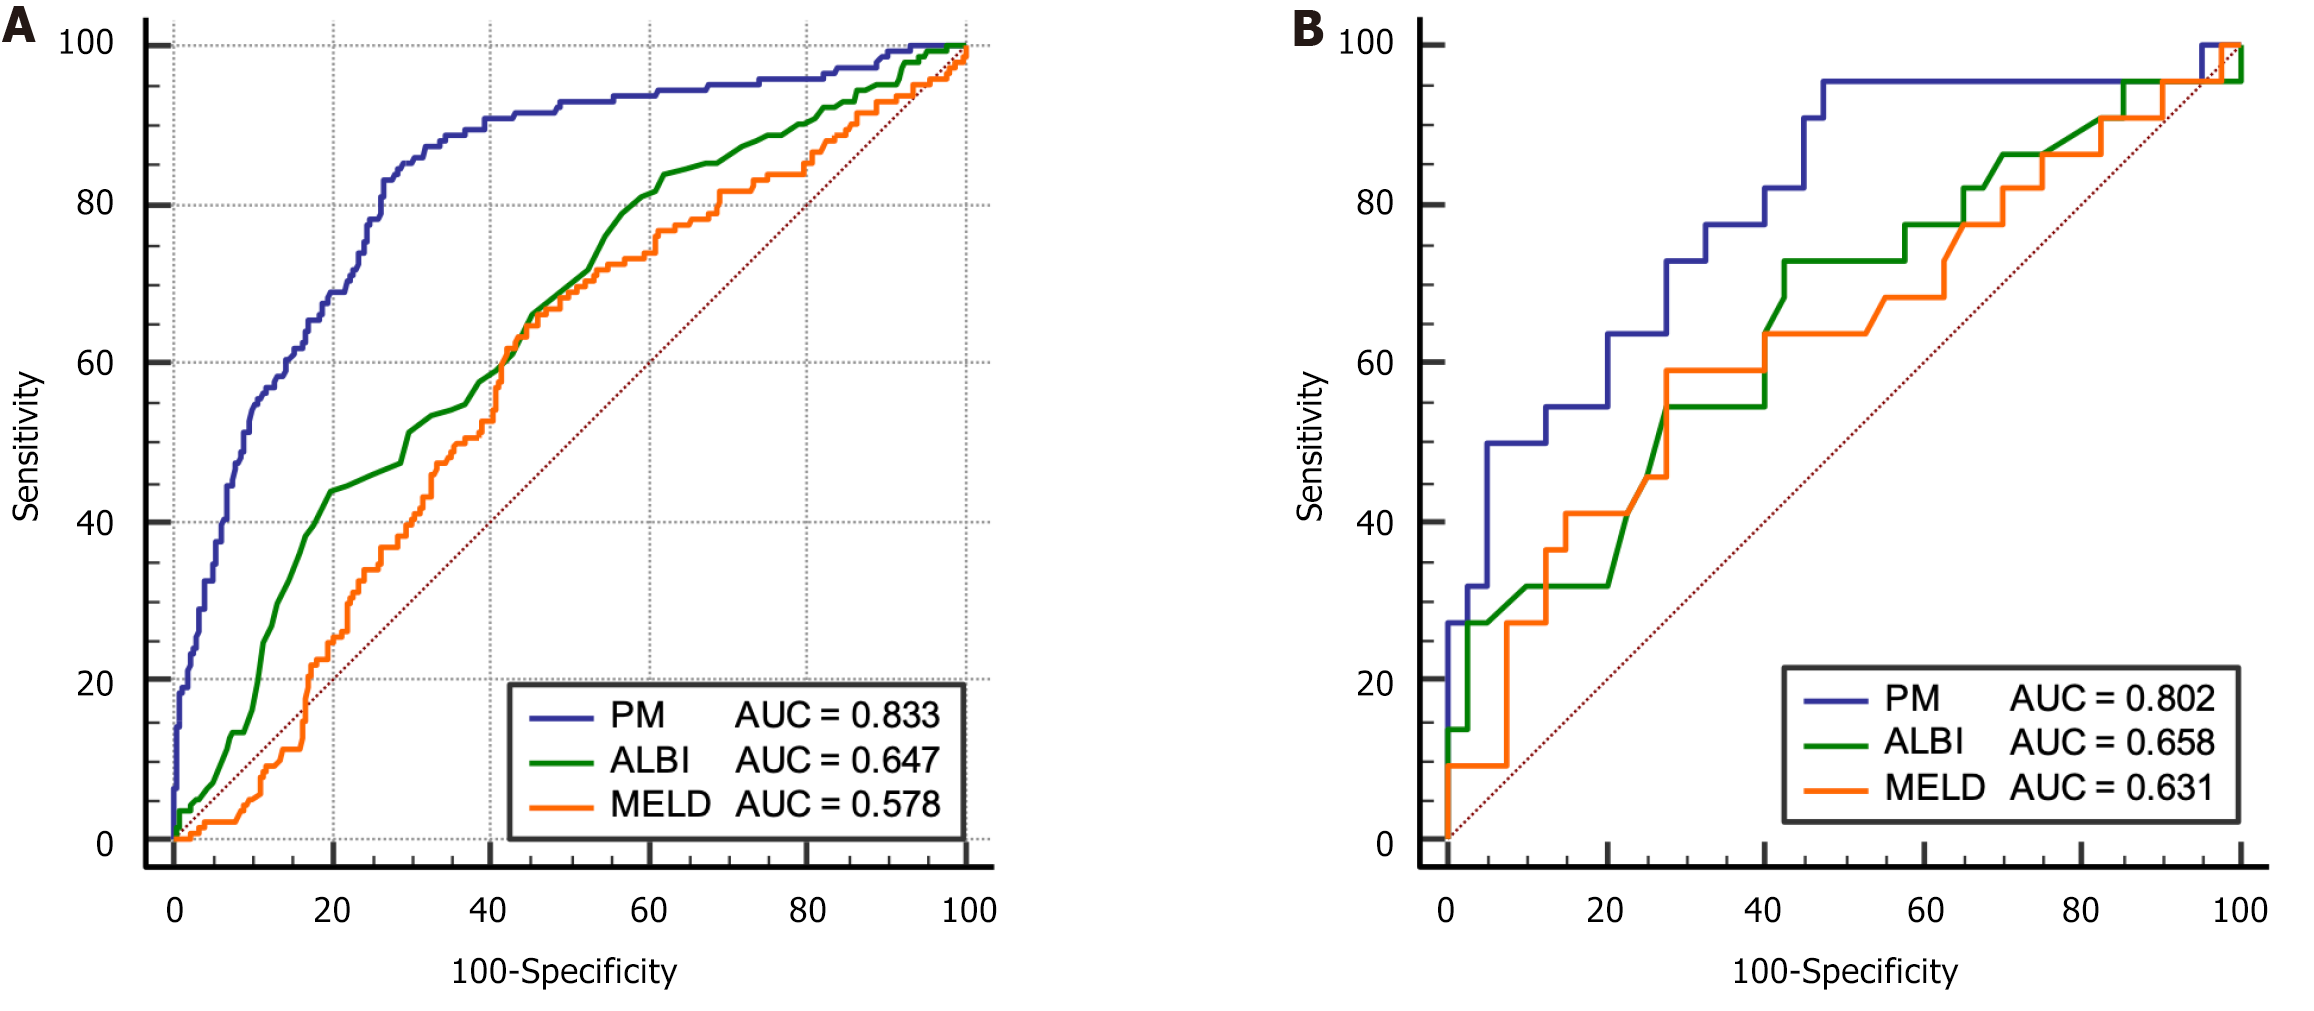
Figure 4 Receiver operating characteristic of models in training cohort and validation cohort.
A: Training cohort; B: Validation cohort. ALBI: Albumin-bilirubin; MELD: Model of end-stage liver disease; PM: Posthepatectomy liver failure model.
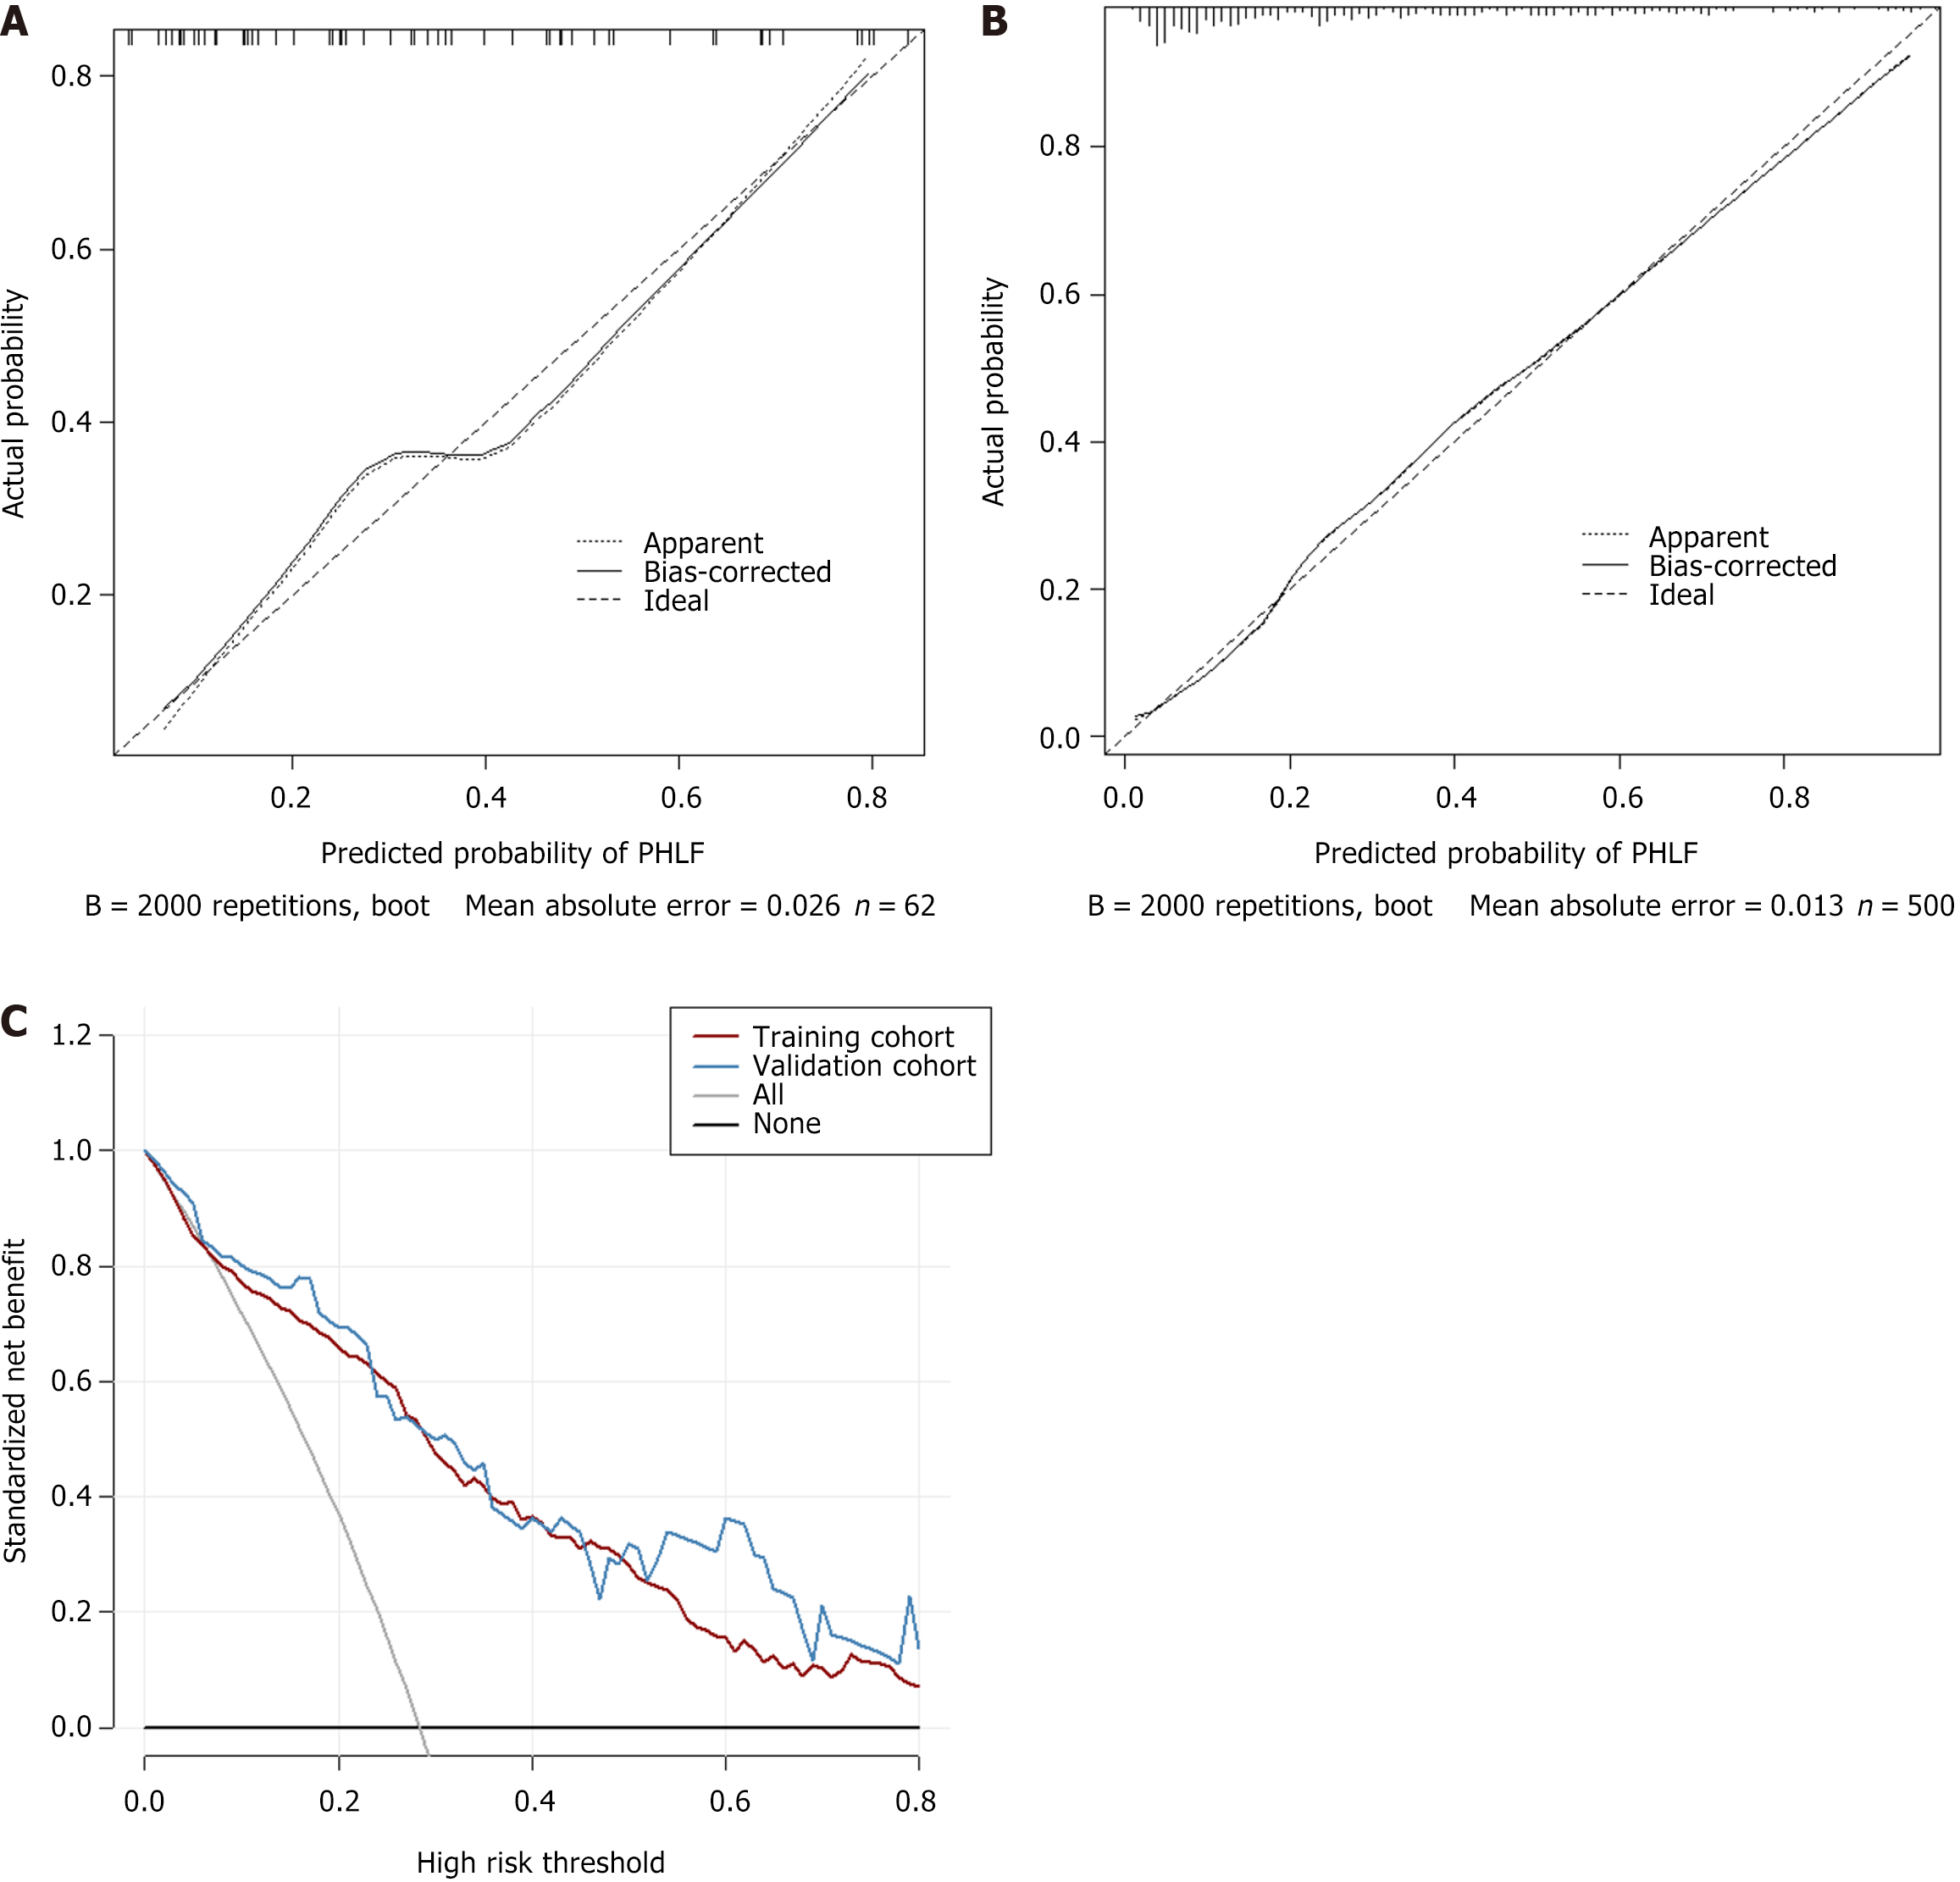
Figure 5 Figure calibration curves in the training cohort and the validation cohort and decision curve analysis of the prediction model.
A: Training cohort; B: Validation cohort; C: Decision curve analysis of the prediction model. PHLF: Posthepatectomy liver failure.
- Citation: Cheng GW, Fang Y, Xue LY, Zhang Y, Xie XY, Qiao XH, Li XQ, Guo J, Ding H. Nomogram based on liver stiffness and spleen area with ultrasound for posthepatectomy liver failure: A multicenter study. World J Gastroenterol 2024; 30(27): 3314-3325
- URL: https://www.wjgnet.com/1007-9327/full/v30/i27/3314.htm
- DOI: https://dx.doi.org/10.3748/wjg.v30.i27.3314


