Copyright
©The Author(s) 2024.
World J Gastroenterol. Jul 7, 2024; 30(25): 3155-3165
Published online Jul 7, 2024. doi: 10.3748/wjg.v30.i25.3155
Published online Jul 7, 2024. doi: 10.3748/wjg.v30.i25.3155
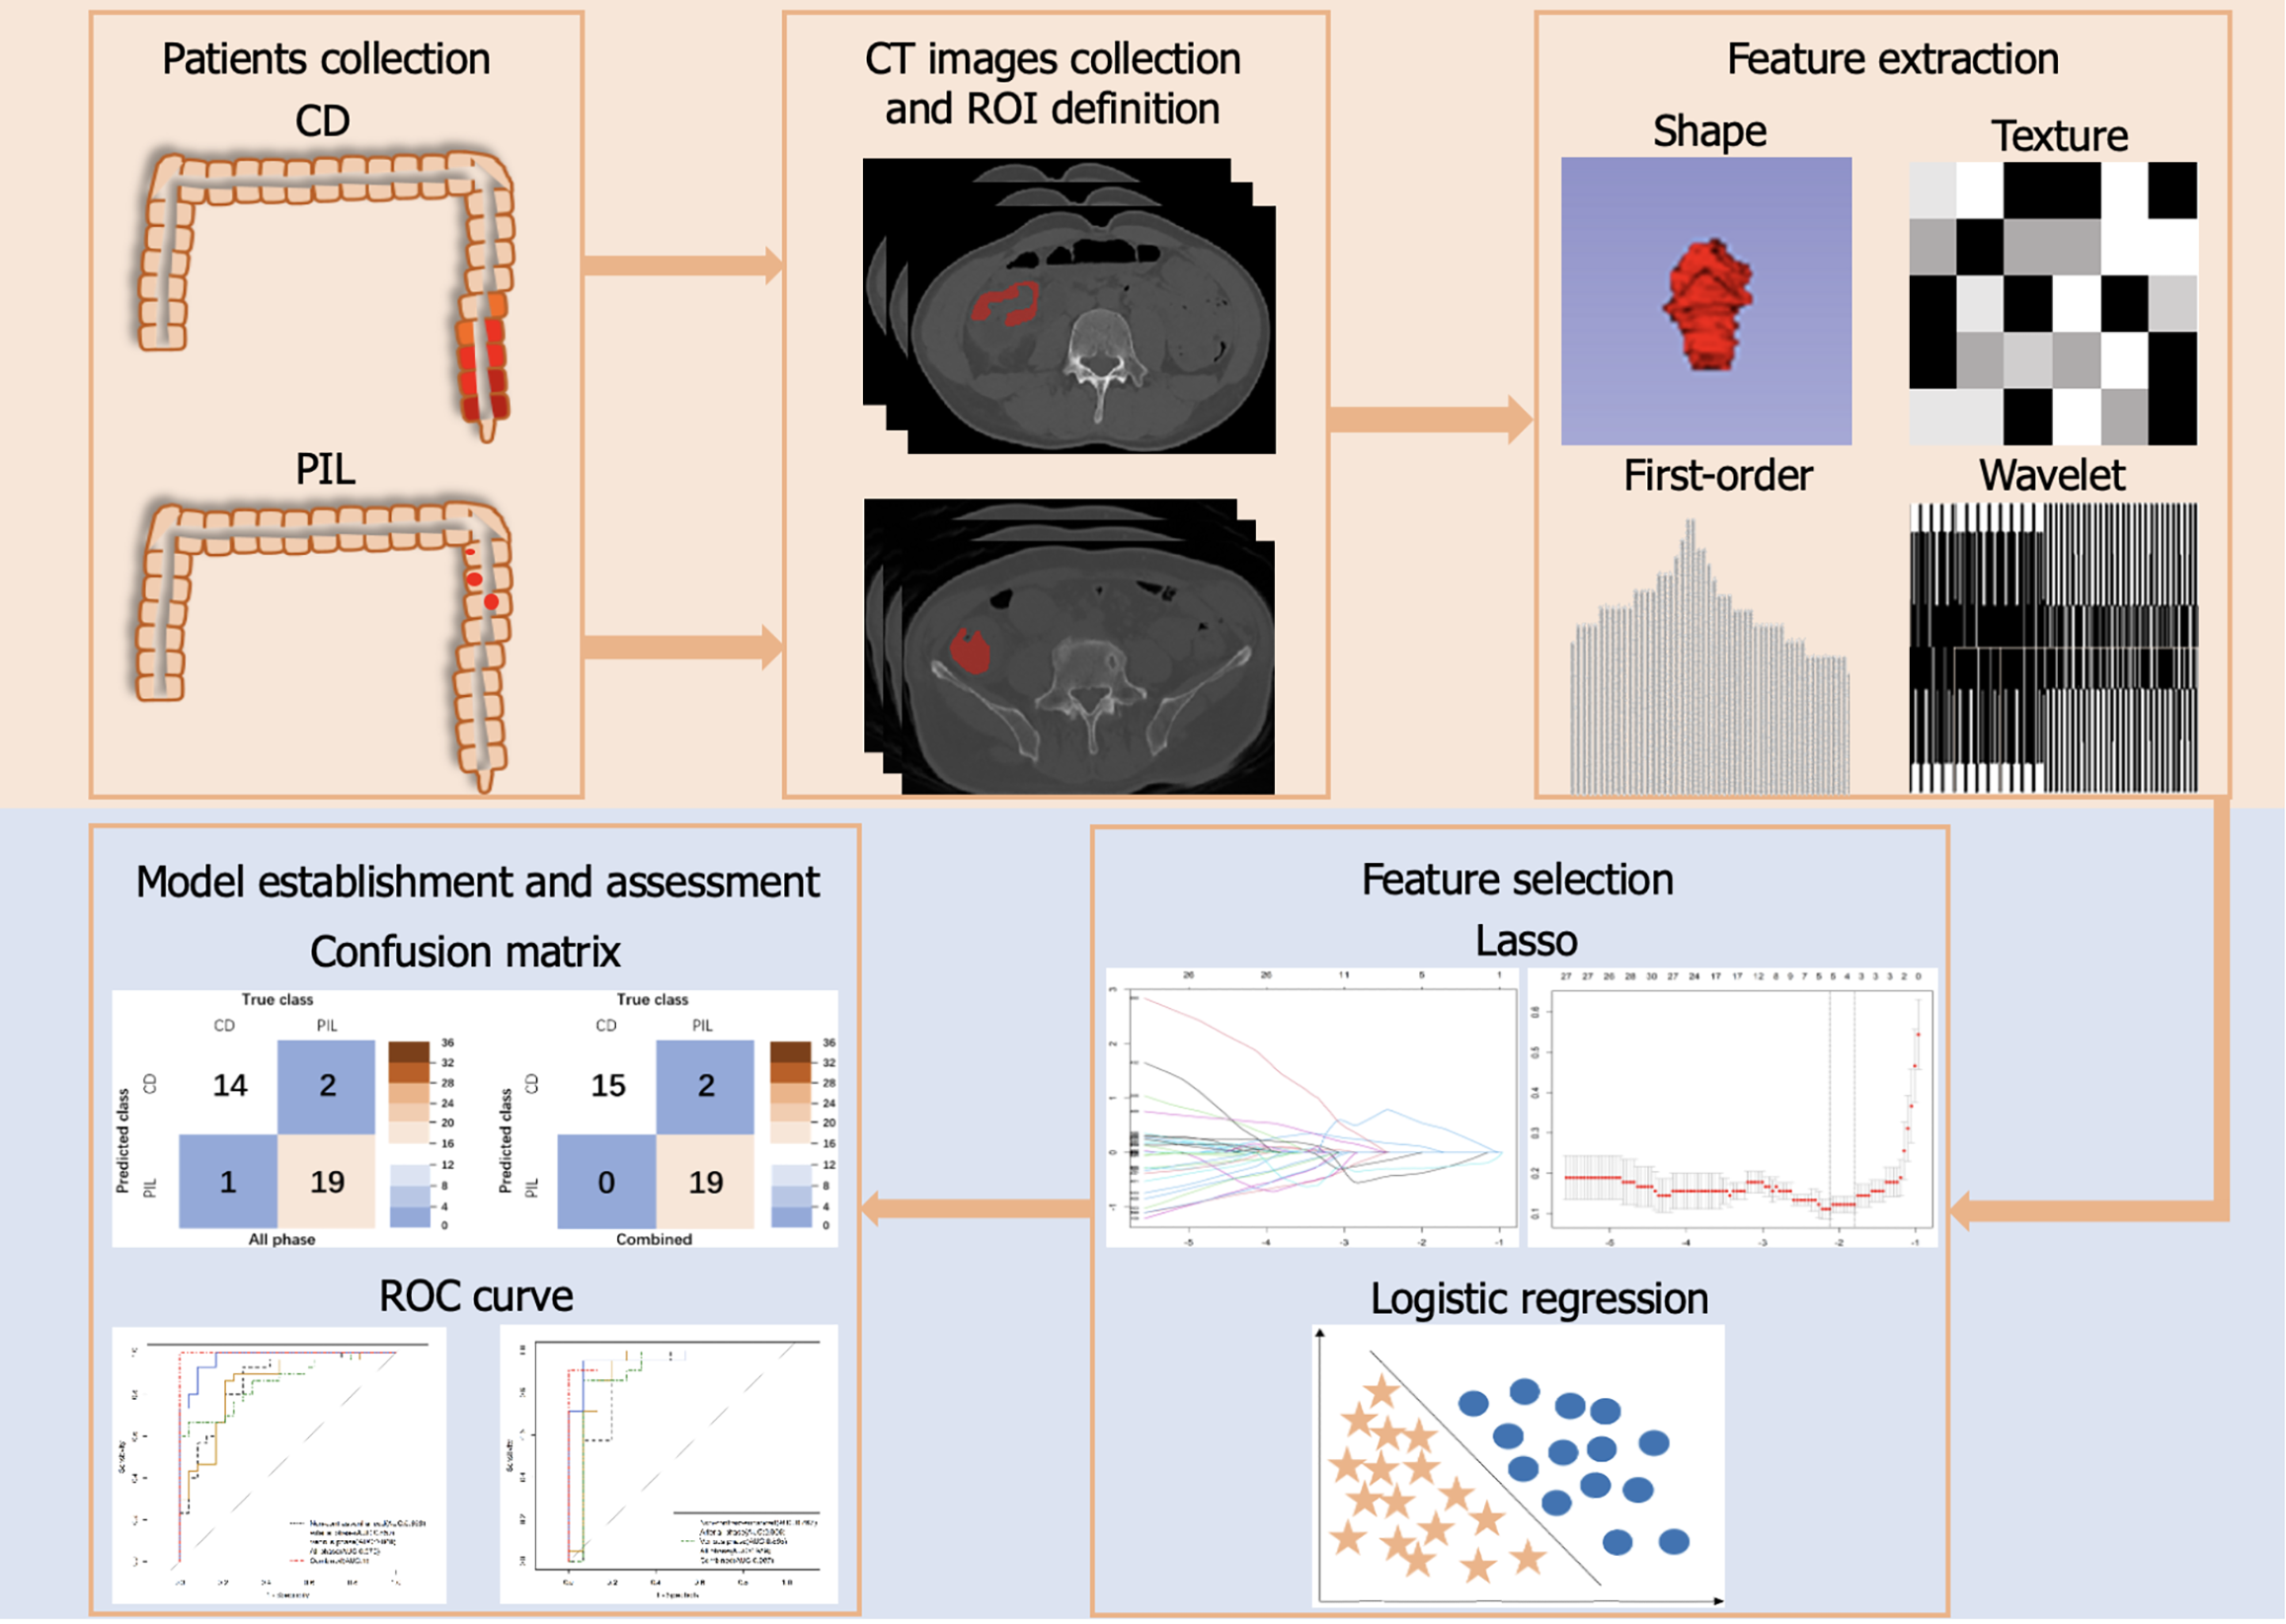
Figure 1 Flowchart of radiomics and clinical-radiomics model construction to classify primary intestinal lymphoma and Crohn's disease.
CD: Crohn's disease; PIL: Primary intestinal lymphoma; CT: Computed tomography; ROI: Region of interest; ROC: Receive operating curve; Lasso: Least absolute shrinkage and selection operator.
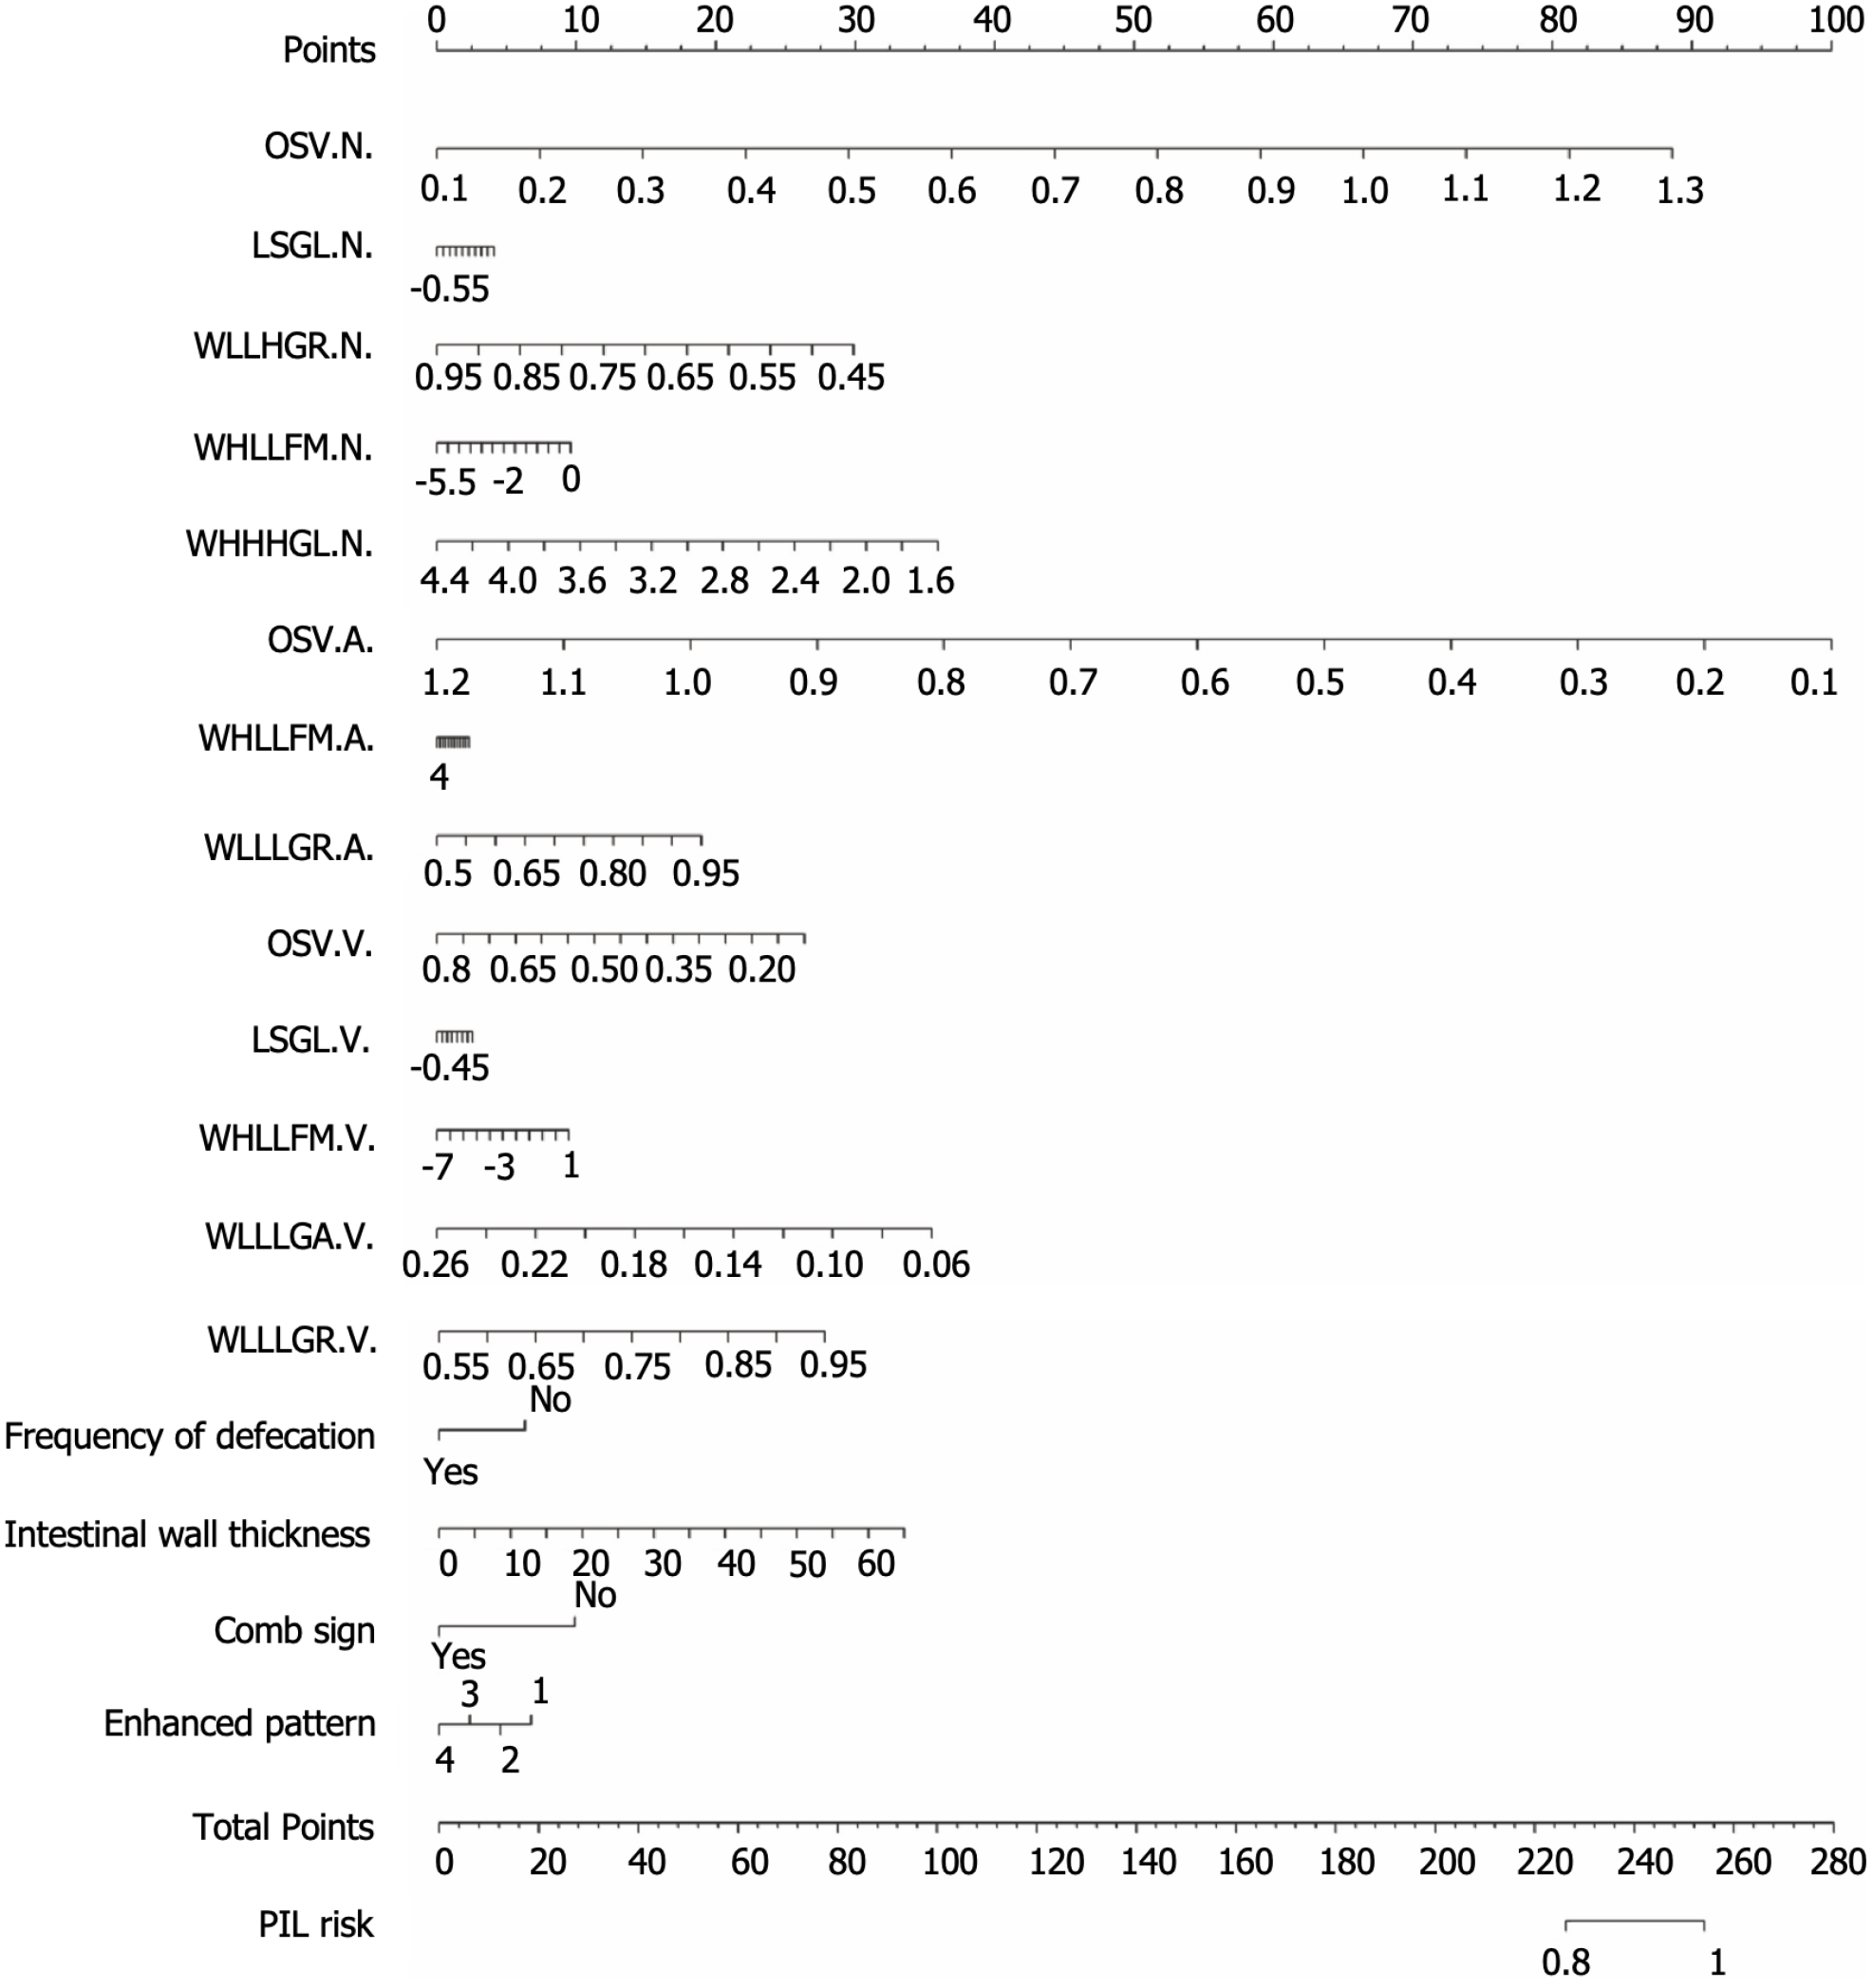
Figure 2 The nomogram of combined model.
Gender: 1-Male; 2-Female; Enhanced pattern: 1-Homogeneous enhancement; 2-Inhomogeneous enhancement; 3-Hierarchical enhancement; 4-Mucosal enhancement. PIL: Primary intestinal lymphoma; OSV: Original shape voxel volume; LSGL: Log sigma 3-0-mm-3D glcm lmc2; WLLHGR: Wavelet LLH glrlm run percentage; WHLLFM: Wavelet HLL firstorder minimum; WHHHGL: Wavelet HHH glrlm long run high gray level emphasis; WLLLGR: Wavelet LLL glrlm run percentage; WLLLGA: Wavelet LLL glcm autocorrelation; N: Non-contrast enhanced; A: Arterial; V: Venous.
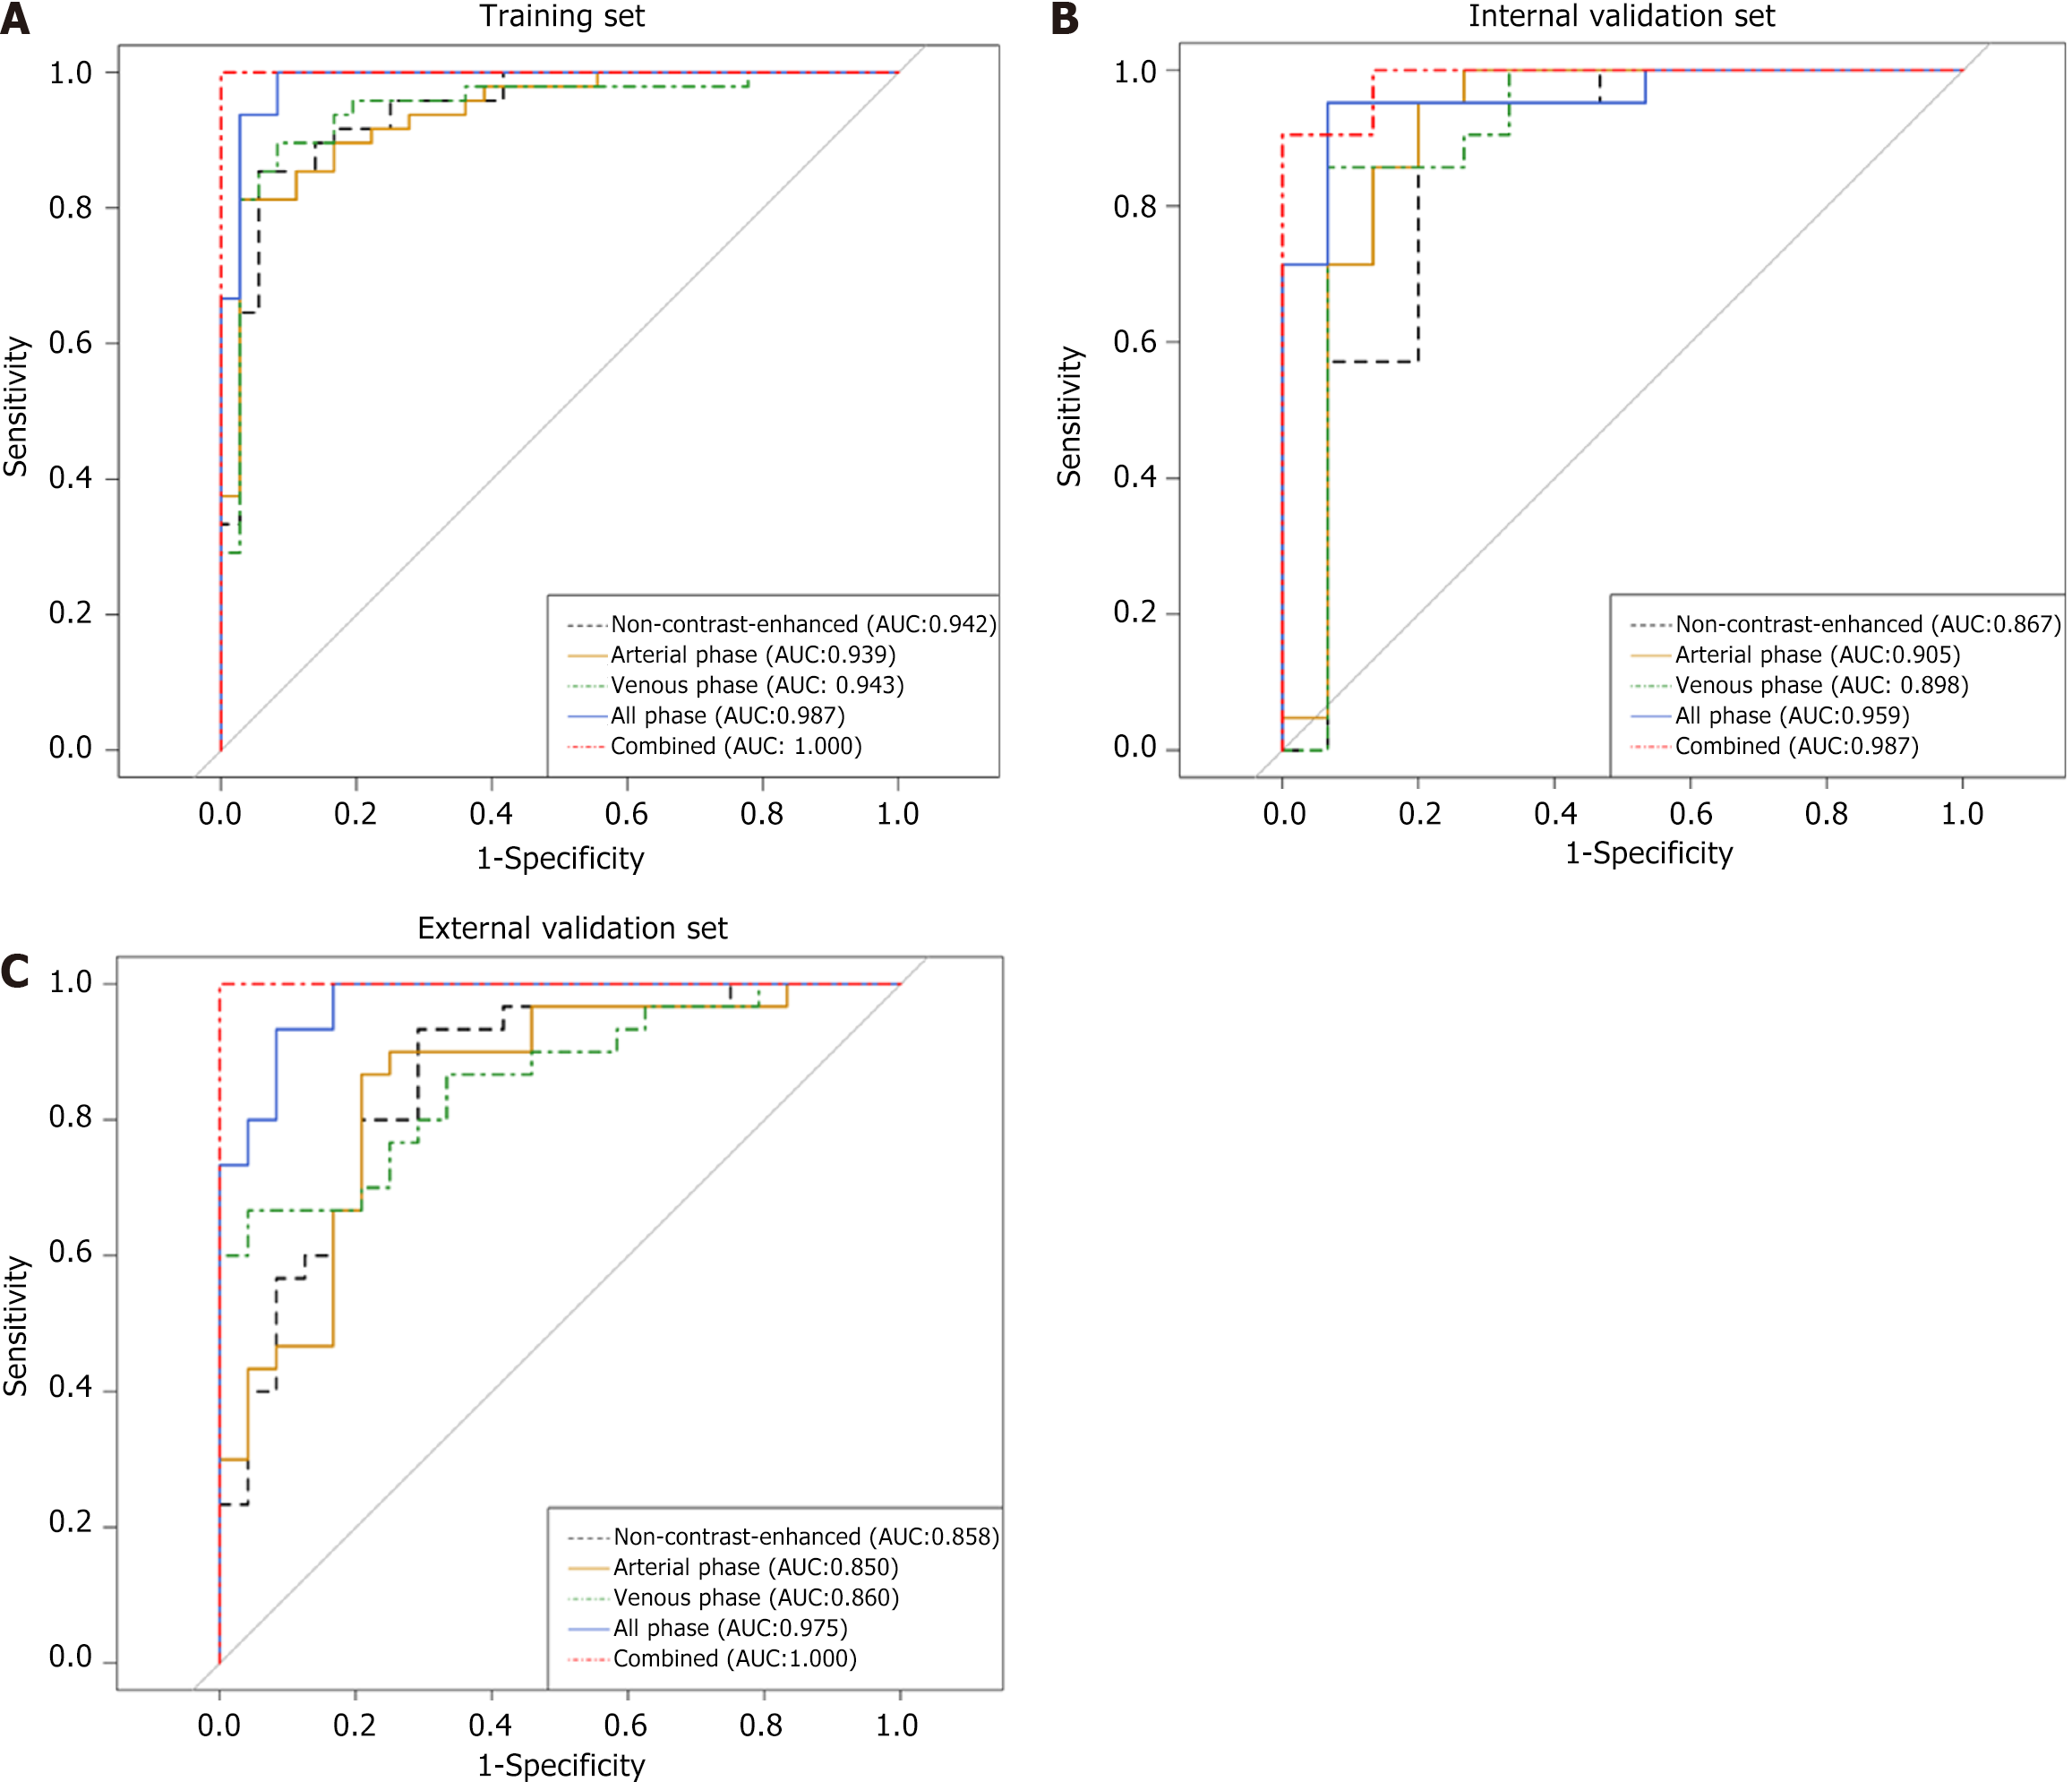
Figure 3 The receive operating curves.
A: The receive operating curves of models based on the training set; B: The receive operating curves of models based on the internal validation set; C: The receive operating curves of models based on the external validation set. AUC: Area under the curve.
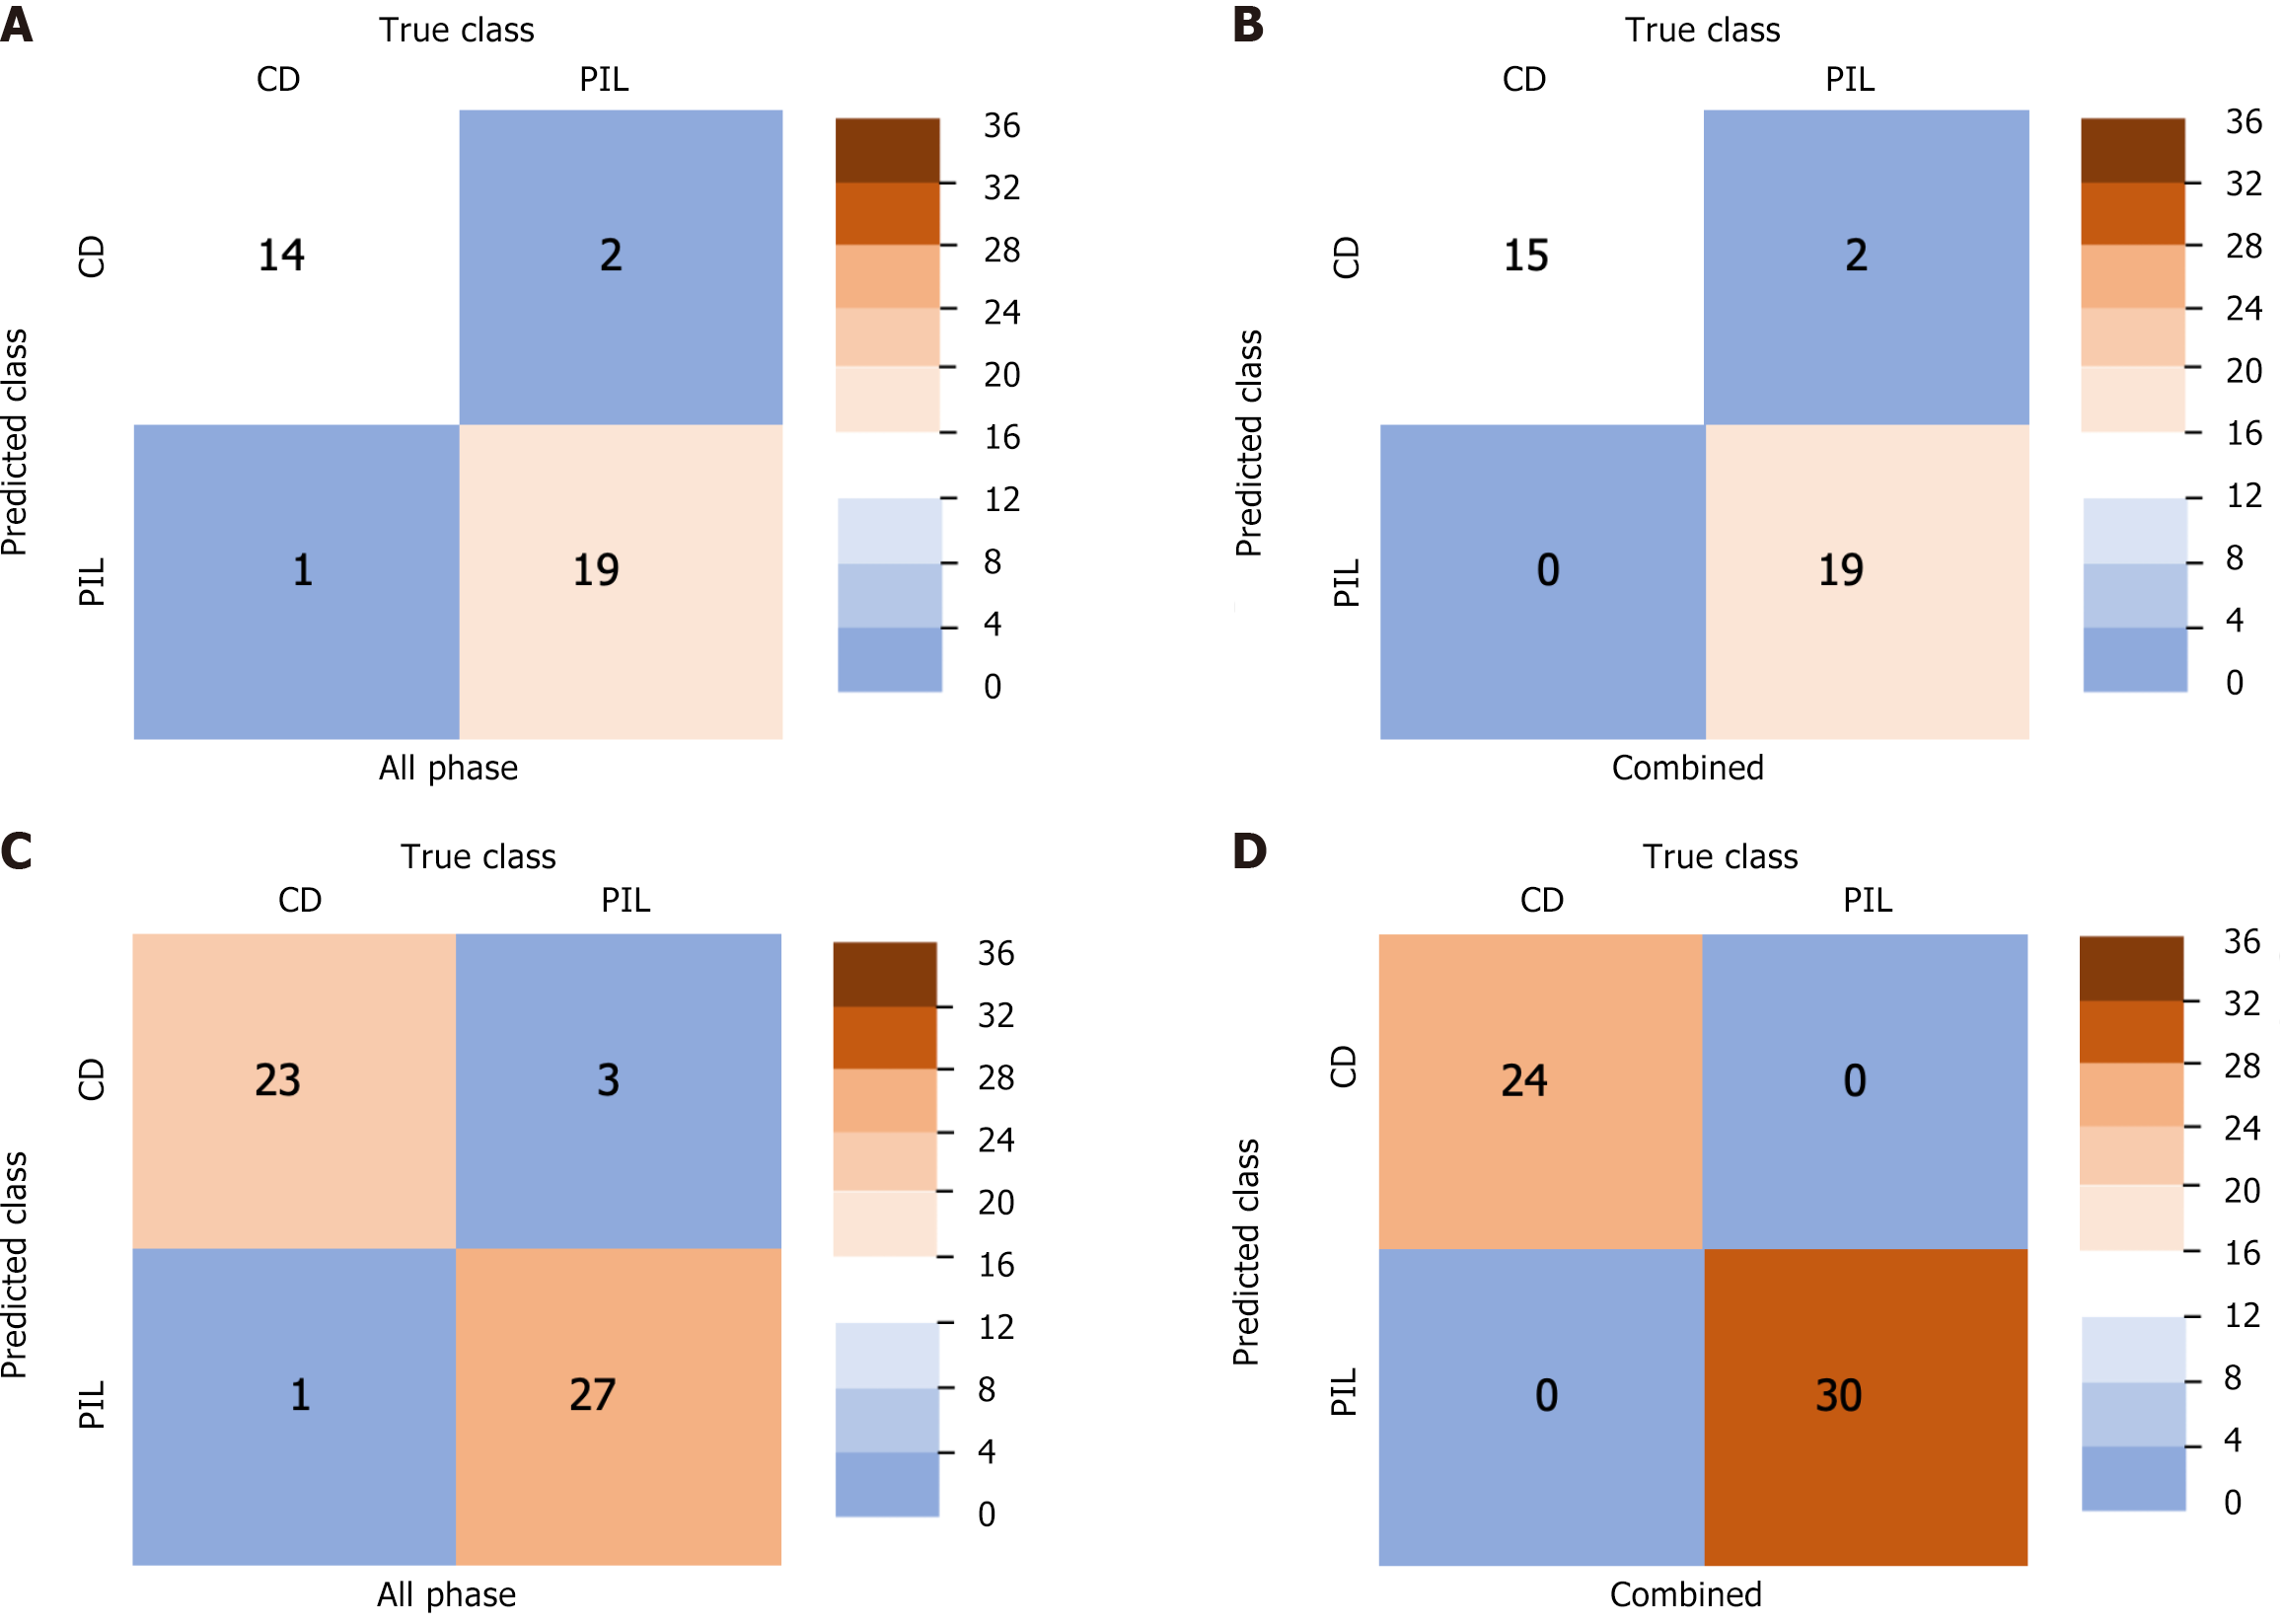
Figure 4 The confusion matrix.
A: The performance of all phase radiomics model in the internal validation set; B: The performance of combined model in the internal validation set; C: The performance of all phase radiomics model in the external validation set; D: The performance of combined model in the external validation set. CD: Crohn's disease; PIL: Primary intestinal lymphoma.
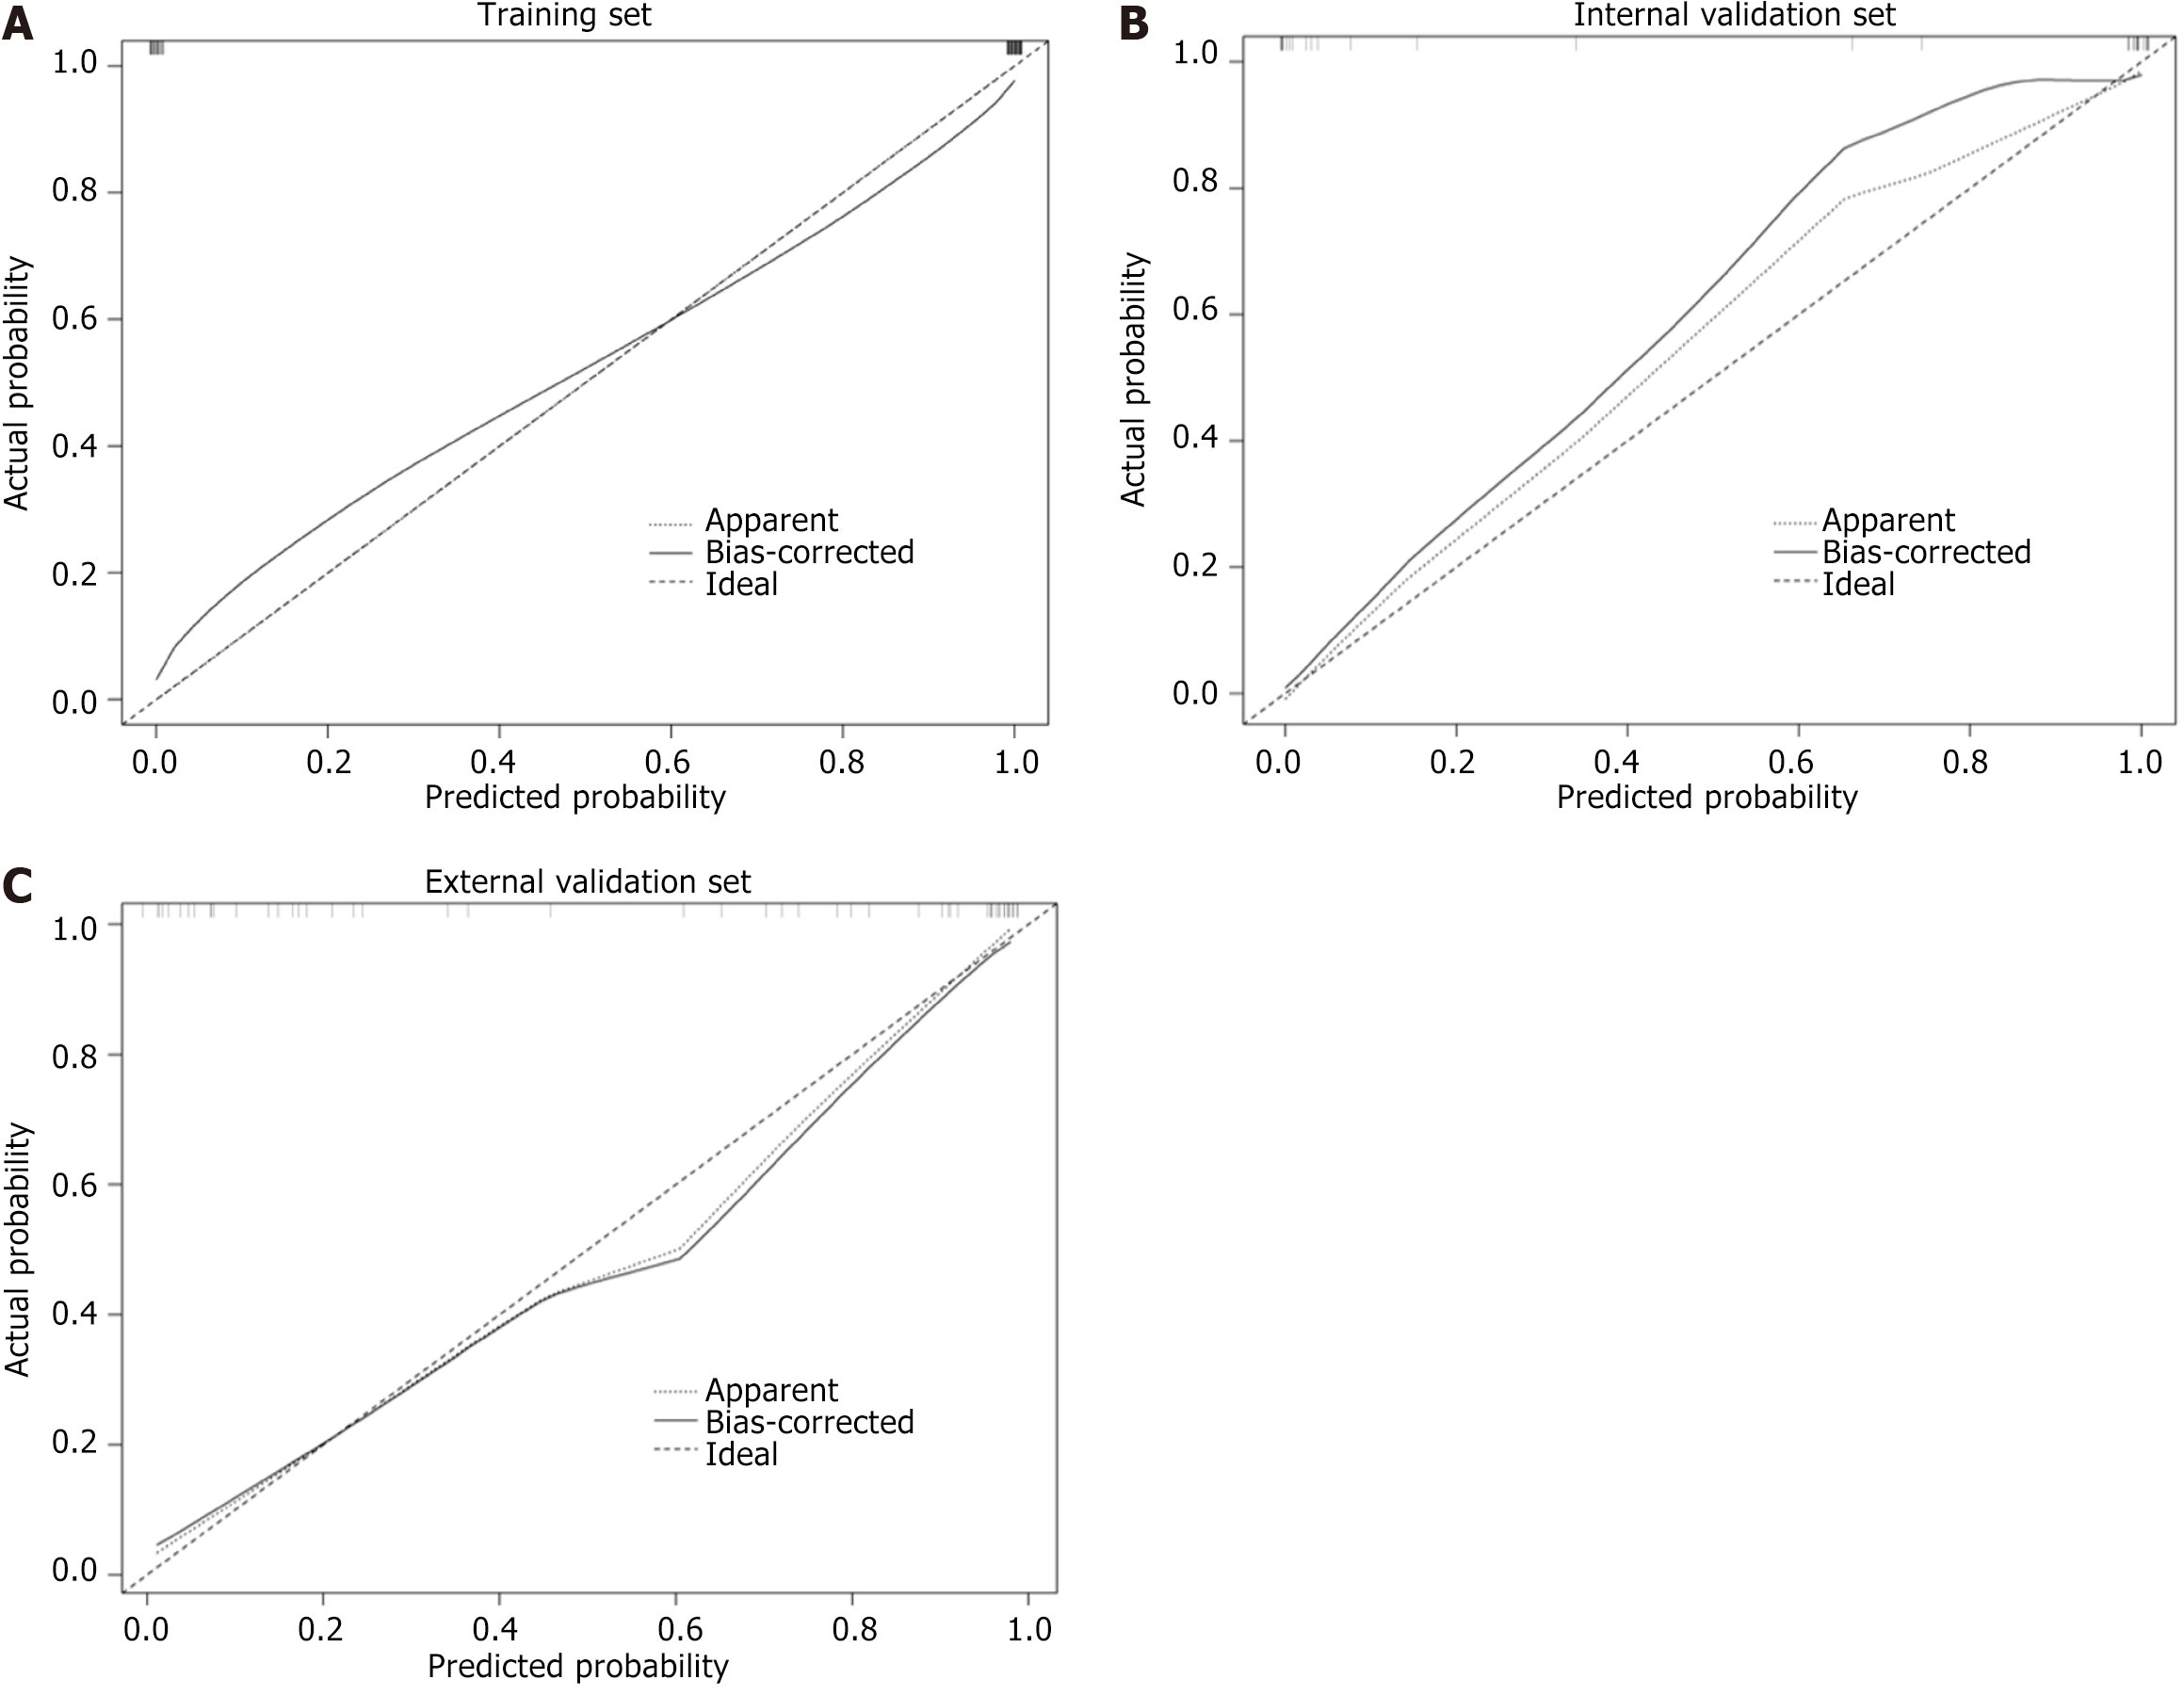
Figure 5 The calibration curve.
A: The calibration curve of combined model in the training set; B: The calibration curve of combined model in the internal validation set; C: The calibration curve of combined model in the external validation set.
- Citation: Xiao MJ, Pan YT, Tan JH, Li HO, Wang HY. Computed tomography-based radiomics combined with machine learning allows differentiation between primary intestinal lymphoma and Crohn's disease. World J Gastroenterol 2024; 30(25): 3155-3165
- URL: https://www.wjgnet.com/1007-9327/full/v30/i25/3155.htm
- DOI: https://dx.doi.org/10.3748/wjg.v30.i25.3155


