Copyright
©The Author(s) 2024.
World J Gastroenterol. Jun 28, 2024; 30(24): 3059-3075
Published online Jun 28, 2024. doi: 10.3748/wjg.v30.i24.3059
Published online Jun 28, 2024. doi: 10.3748/wjg.v30.i24.3059
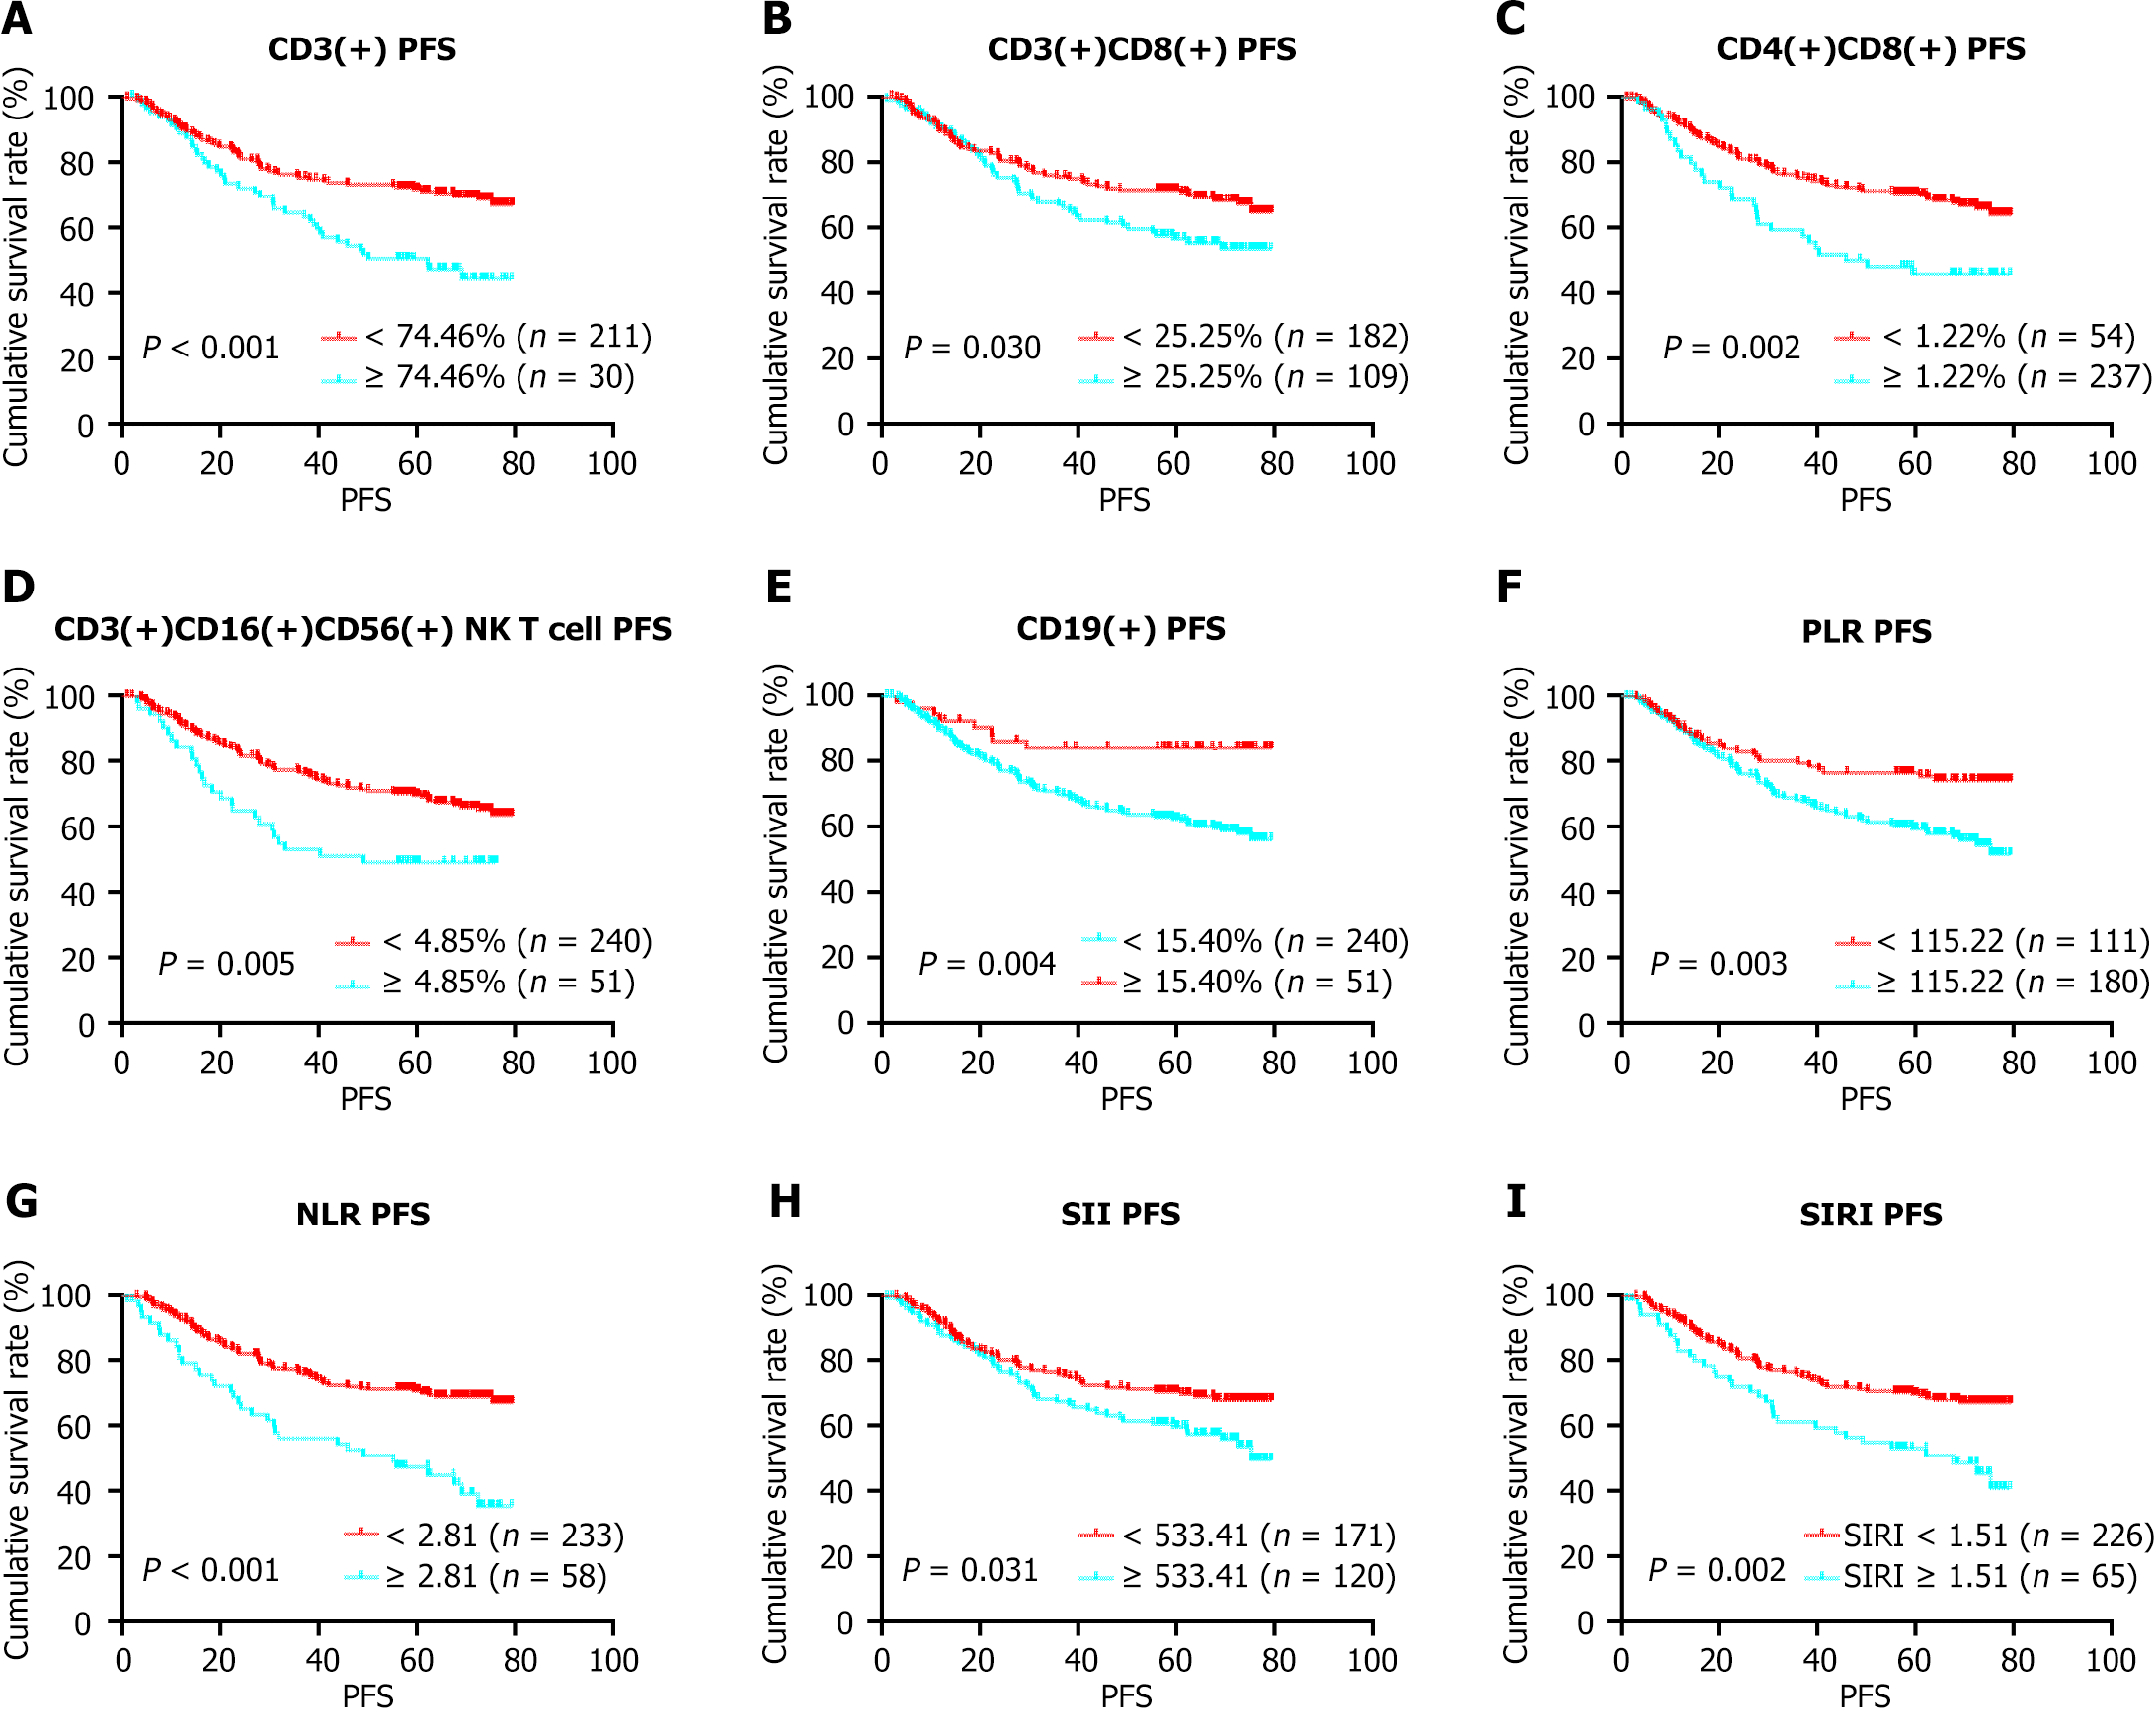
Figure 1 Kaplan–Meier curves for progression-free survival.
A: Progression-free survival (PFS) by CD3(+) lymphocytes; B: PFS by CD3(+)CD8(+) lymphocytes; C: PFS by CD4(+)CD8(+) lymphocytes; D: PFS by CD3(+)CD16(+)CD56(+) lymphocytes; E: PFS by CD19(+) lymphocytes; F: PFS by platelet-to-lymphocyte ratio; G: PFS by neutrophil-to-lymphocyte ratio; H: PFS by systemic immune inflammatory index; I: PFS by systemic inflammation response index. PLR: Platelet-to-lymphocyte ratio; NLR: Neutrophil-to-lymphocyte ratio; SII: Systemic immune inflammatory index; SIRI: Systemic inflammation response index; PFS: Progression-free survival.
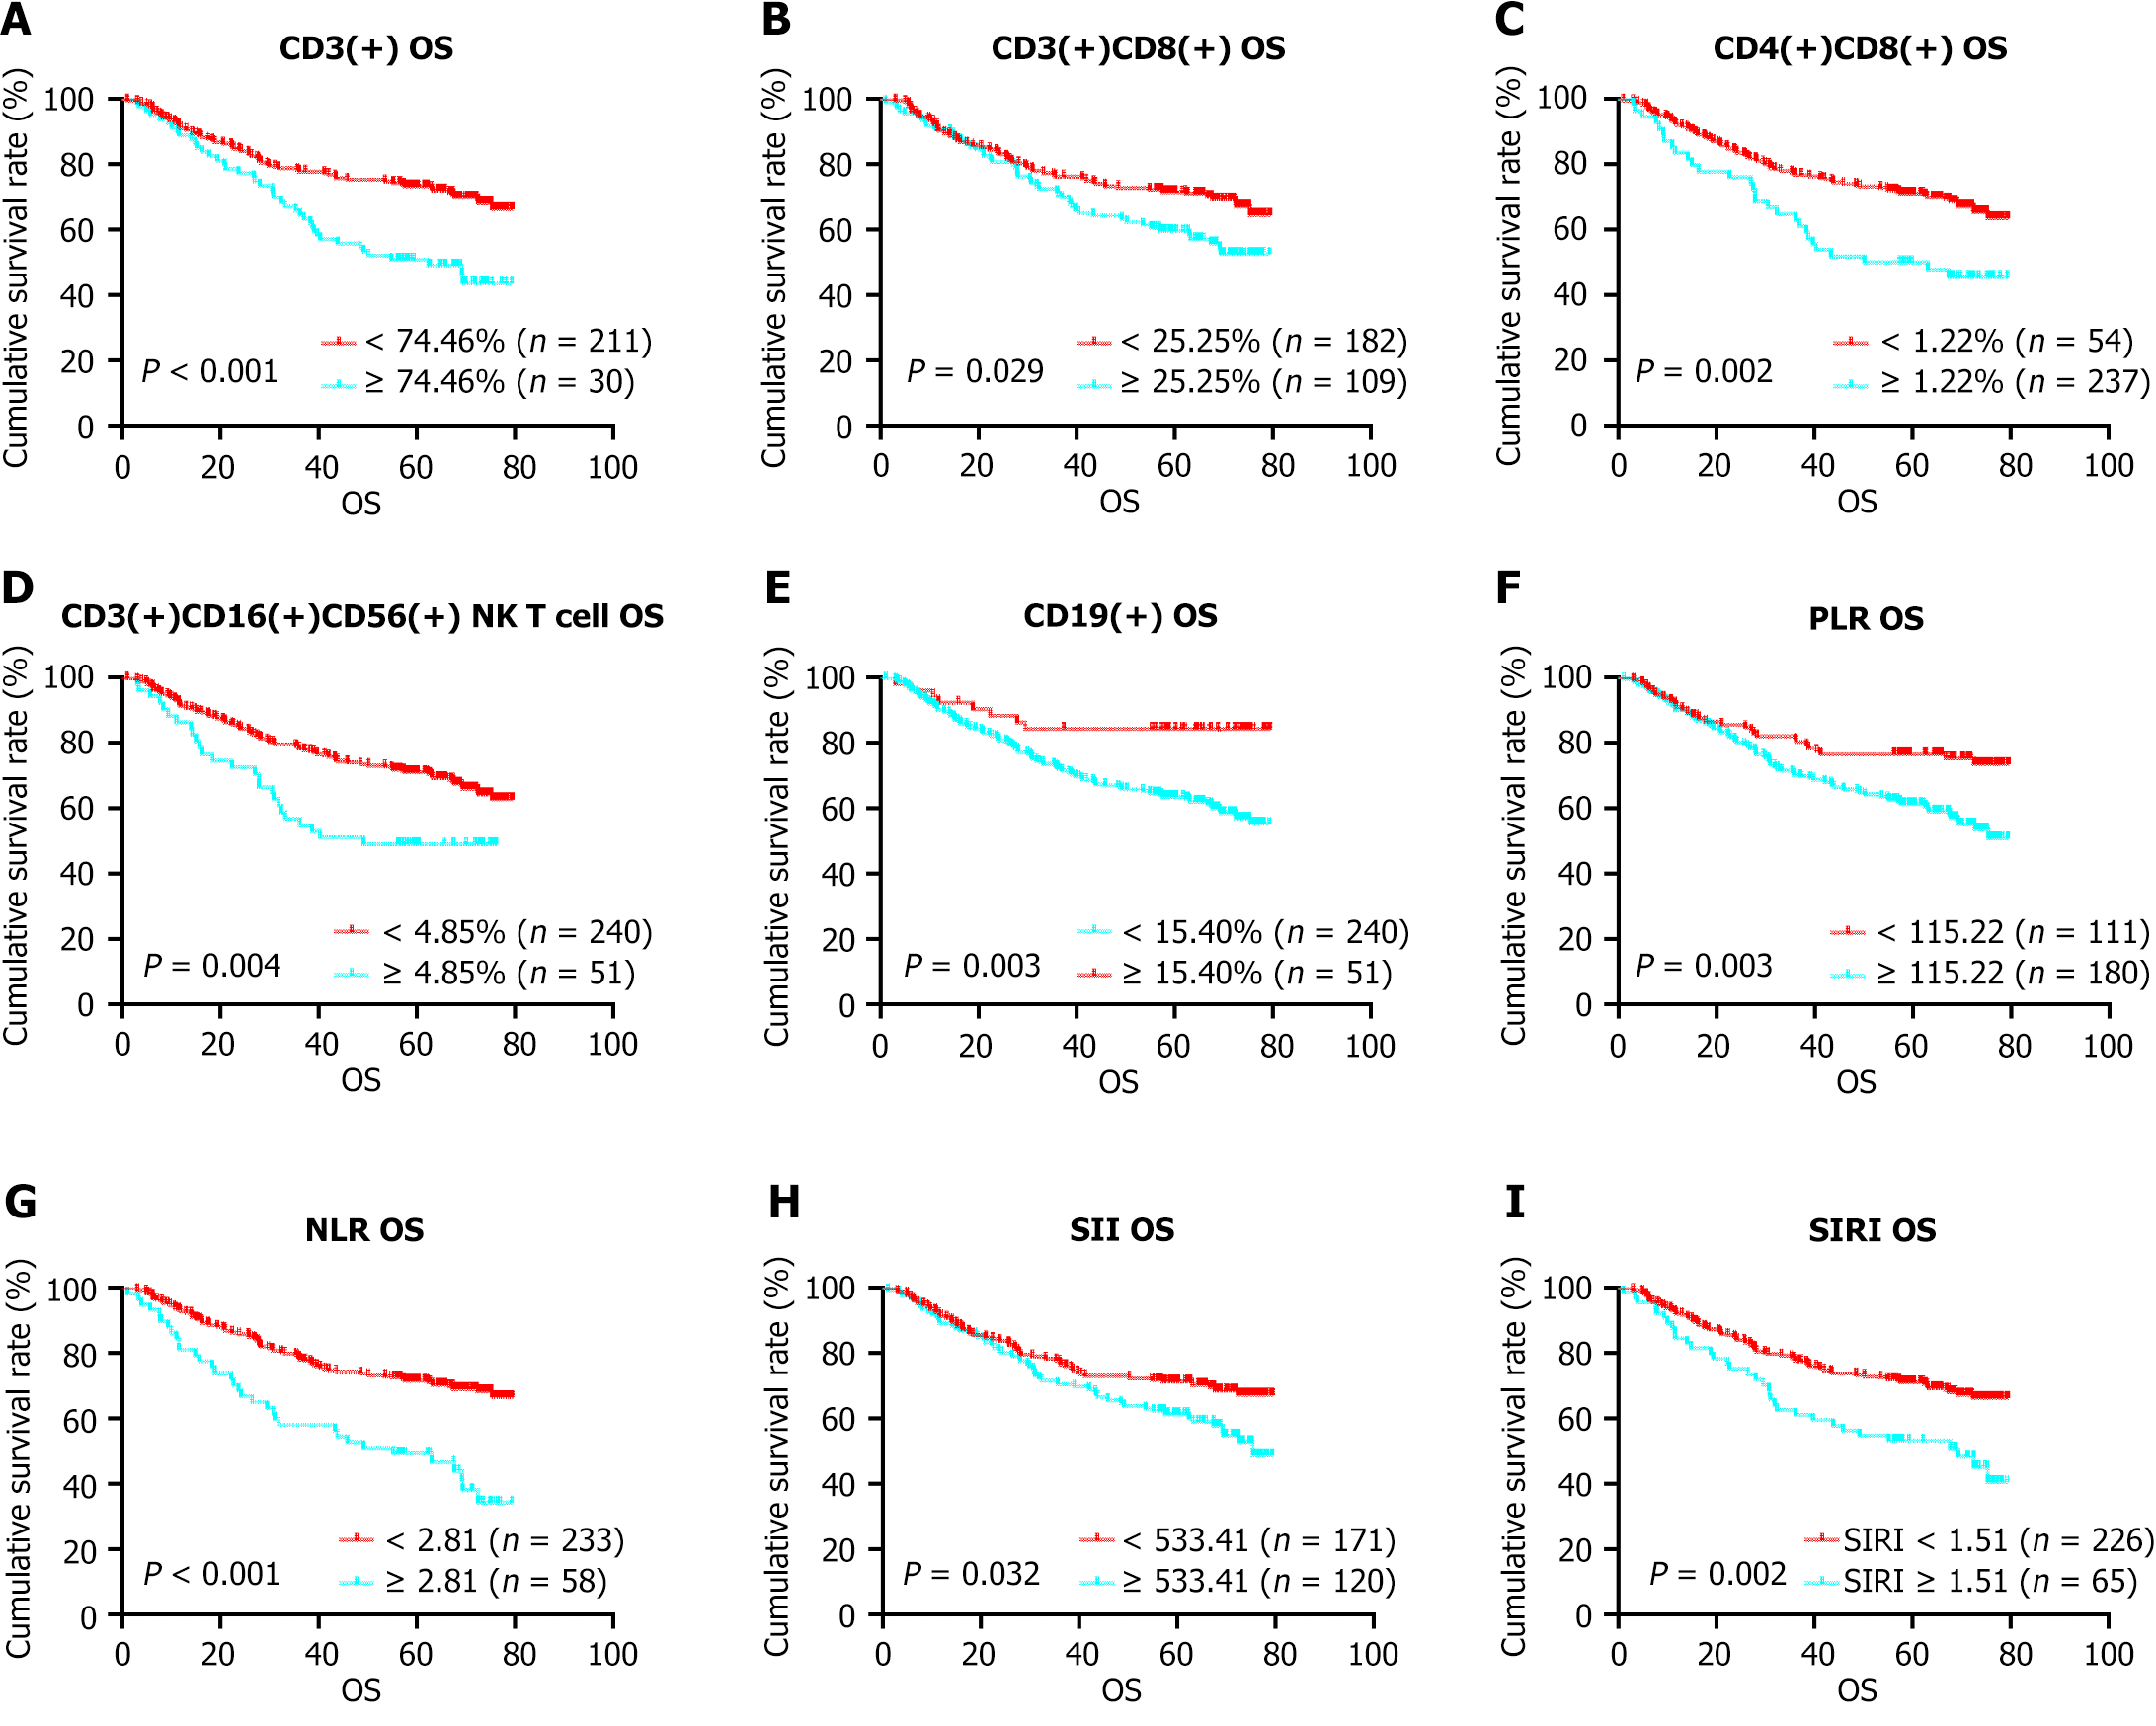
Figure 2 Kaplan–Meier curves for overall survival.
A: Overall survival by CD3(+) lymphocytes; B: OS by CD3(+)CD8(+) lymphocytes; C: OS by CD4(+)CD8(+) lymphocytes; D: OS by CD3(+)CD16(+)CD56(+) lymphocytes; E: OS by CD19(+) lymphocytes; F: OS by platelet-to-lymphocyte ratio; G: OS by neutrophil-to-lymphocyte ratio; H: OS by systemic immune inflammatory index; I: OS by systemic inflammation response index. PLR: Platelet-to-lymphocyte ratio; NLR: Neutrophil-to-lymphocyte ratio; SII: Systemic immune inflammatory index; SIRI: Systemic inflammation response index; PFS: Progression-free survival; OS: Overall survival.
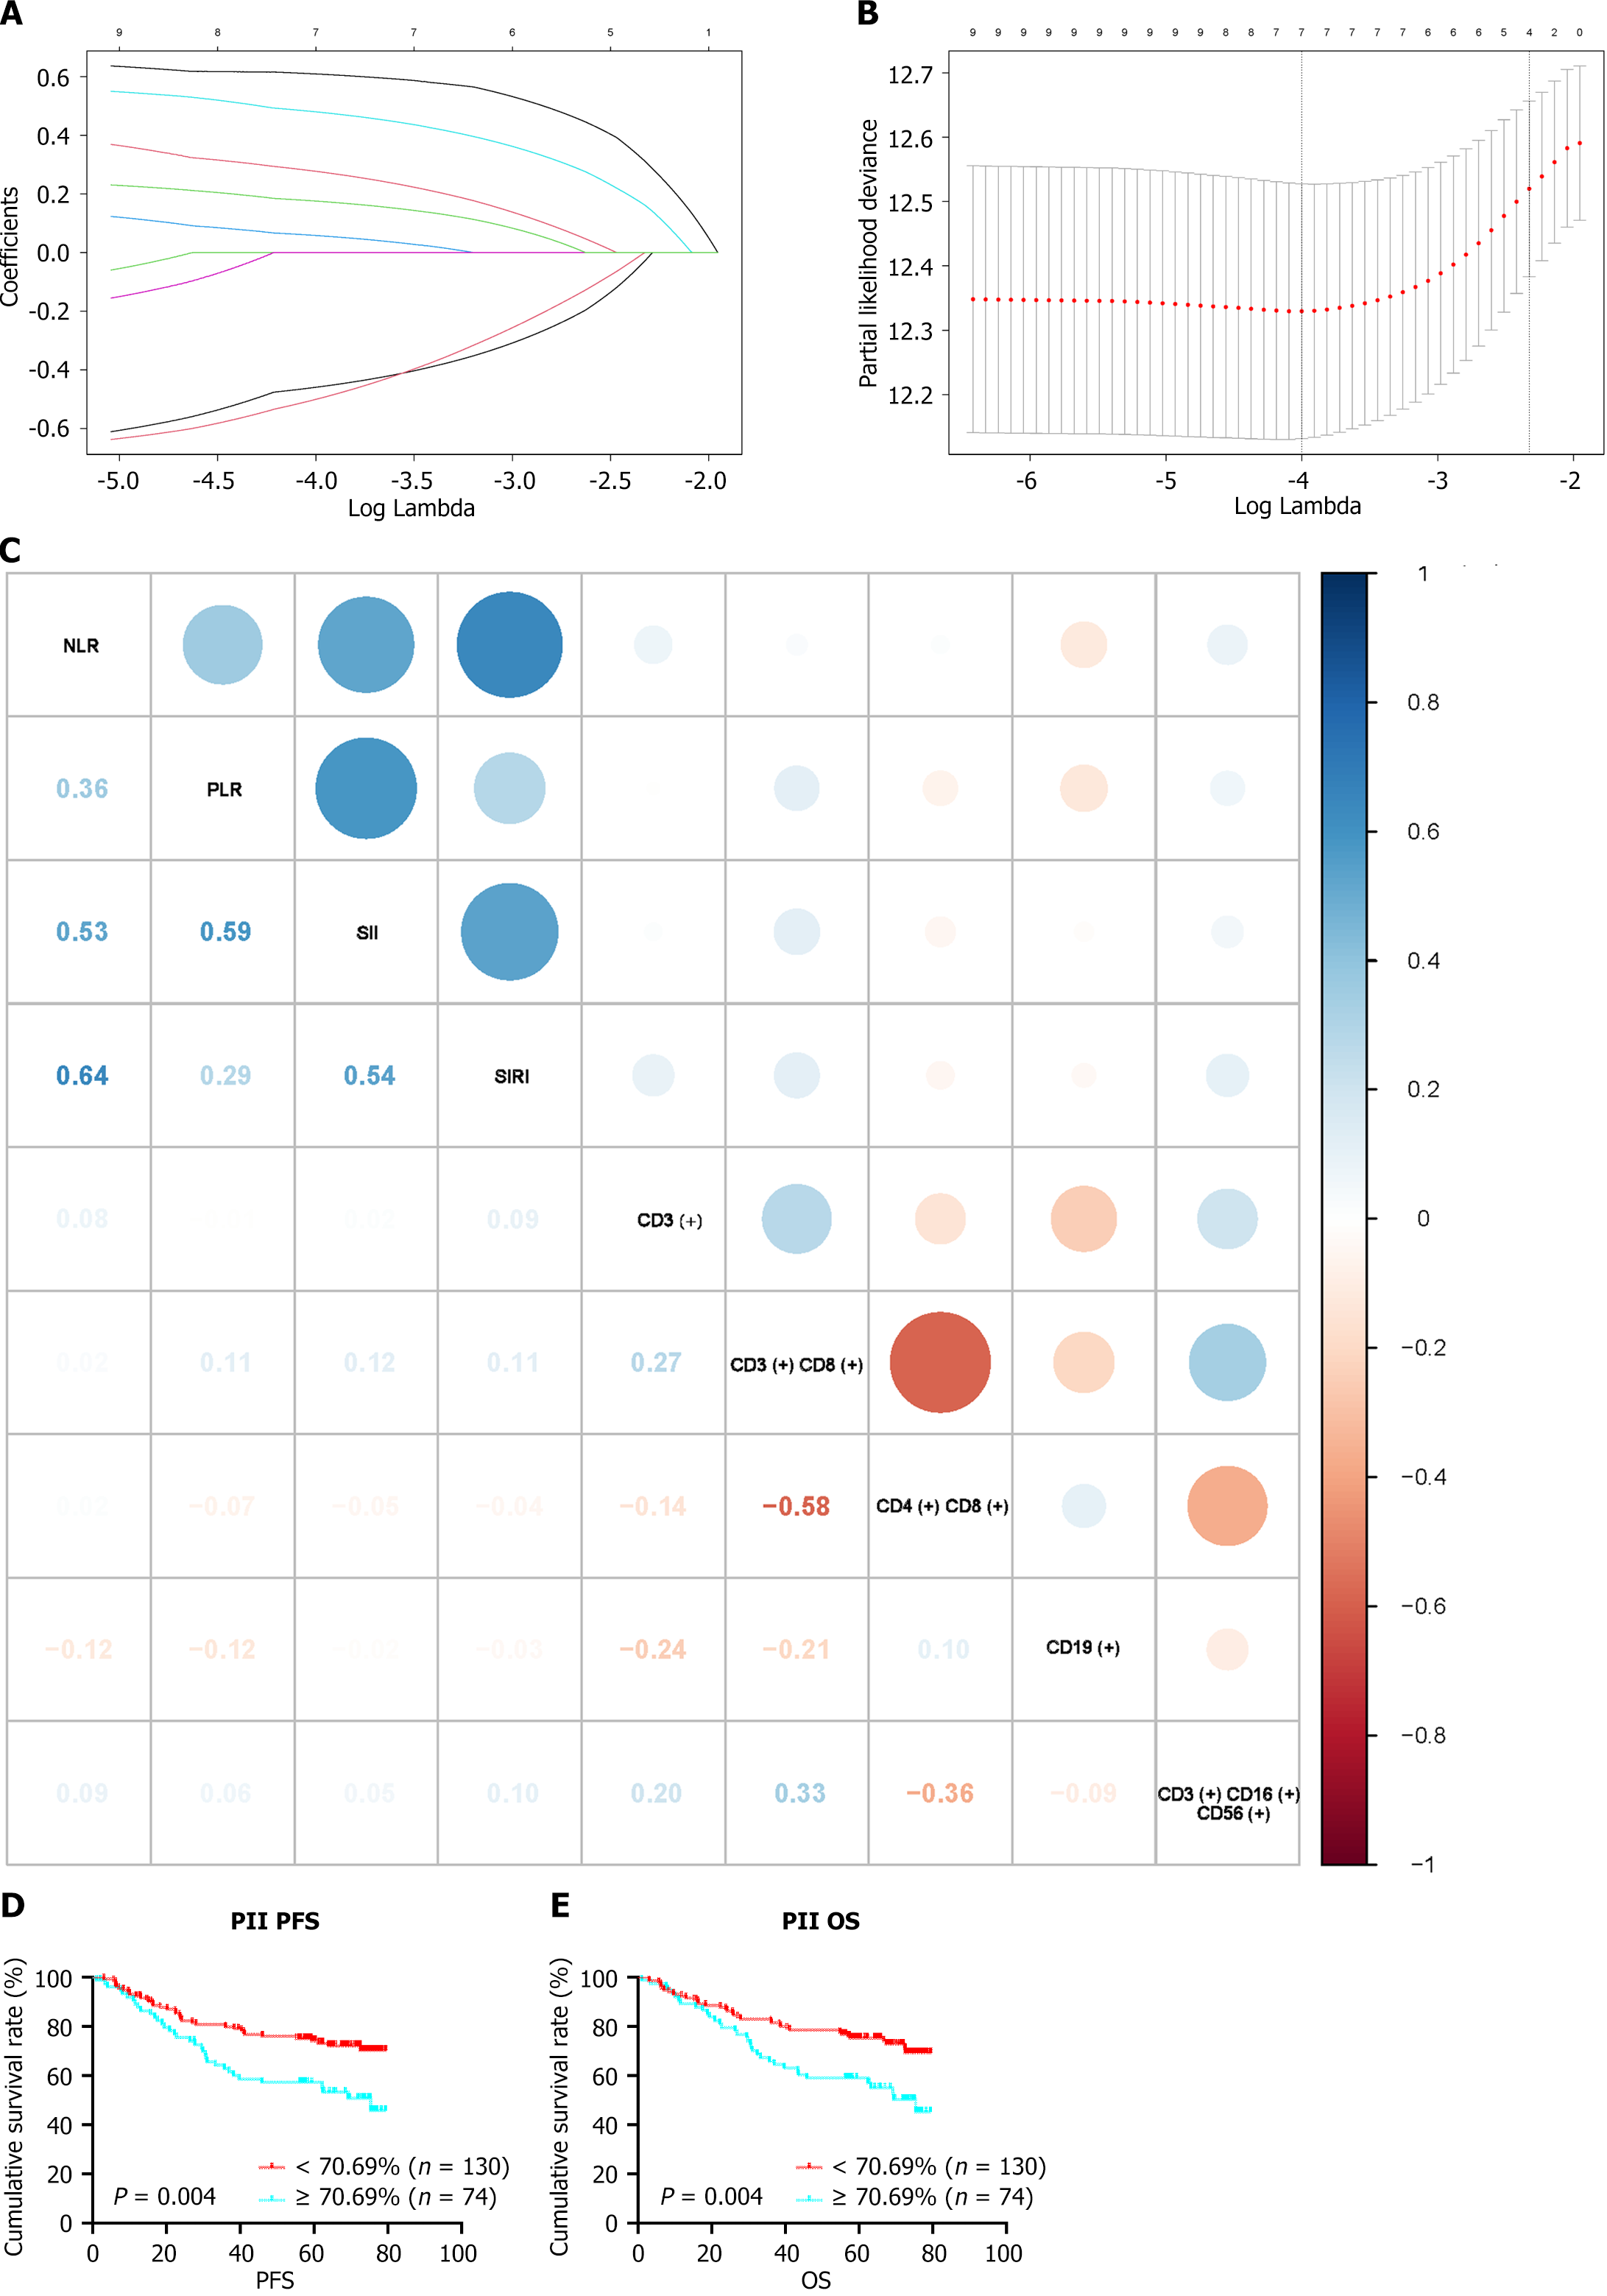
Figure 3 Construction of PII score using the least absolute shrinkage and selection operator-COX regression model.
A: Partial likelihood deviance for least absolute shrinkage and selection operator (LASSO) coefficient profiles; B: LASSO coefficient profiles of eight immune and inflammatory related biomarkers; C: Heatmap of correlations of the immune and inflammatory related biomarkers; D: Progression-free survival by prognostic immunoinflammatory index (PII); E: Overall survival by PII. PII: Prognostic immunoinflammatory index; PFS: Progression-free survival; OS: Overall survival.
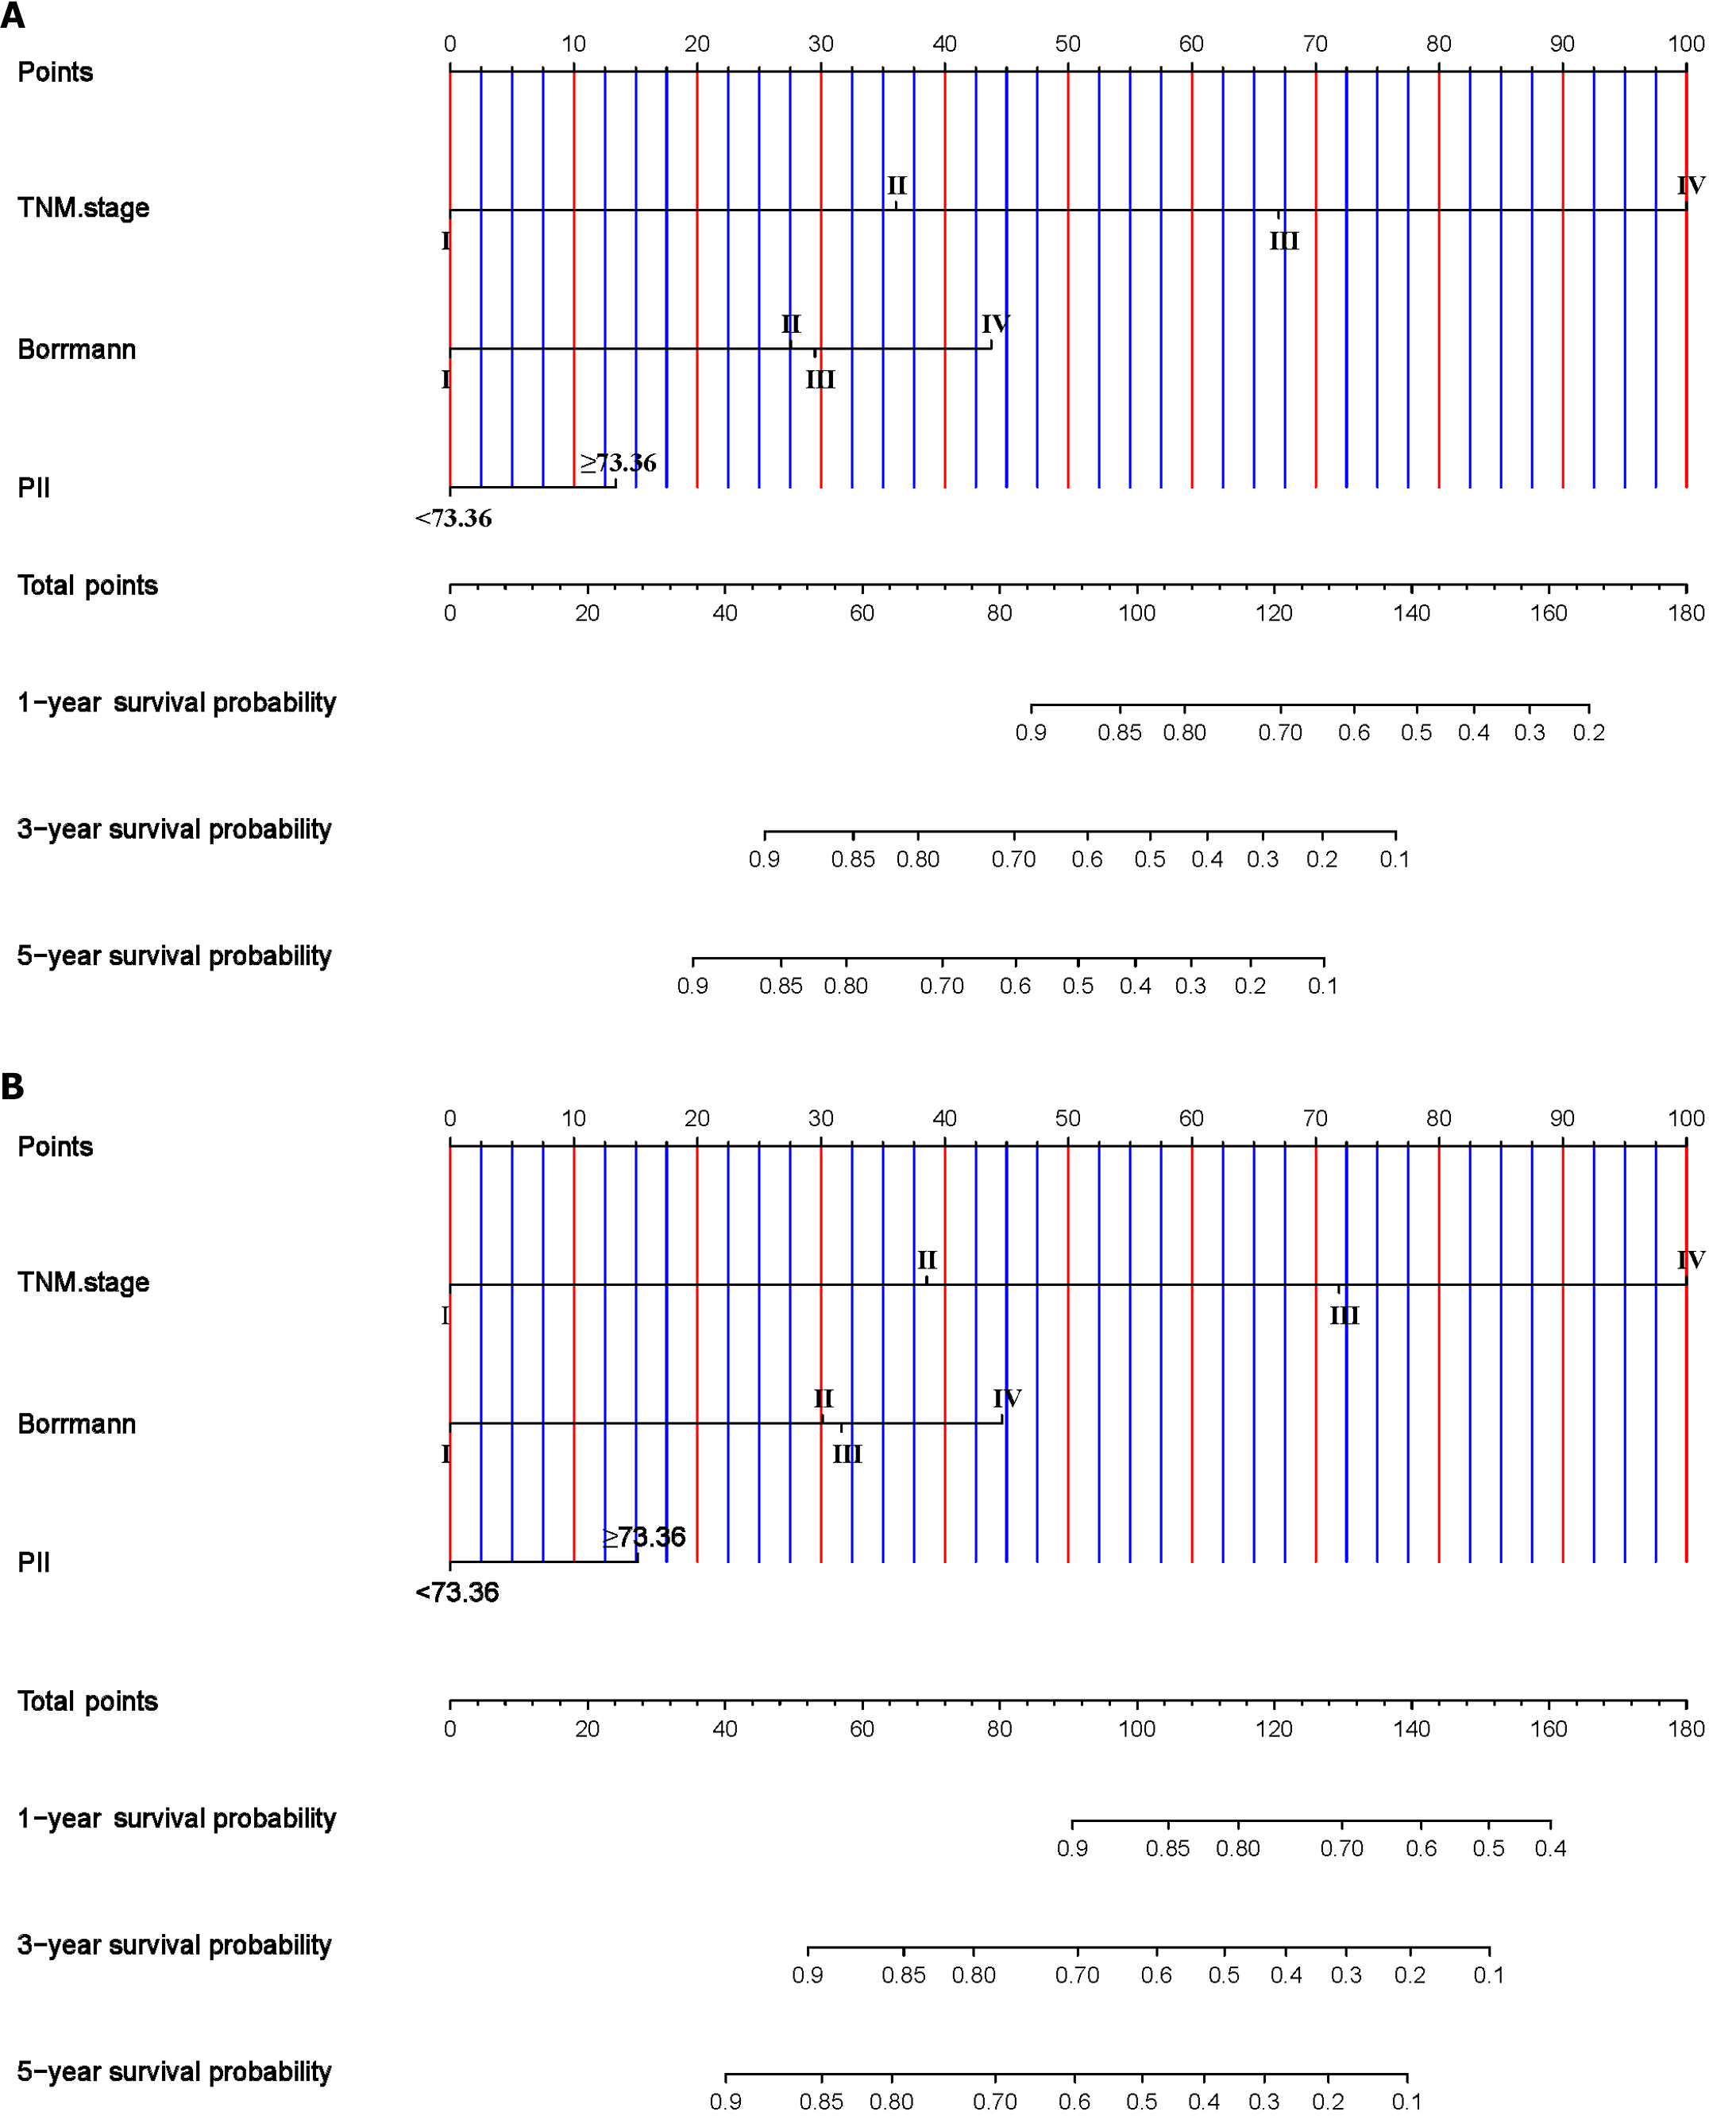
Figure 4 Nomograms for prediction of survival.
A: Nomogram for progression-free survival; B: Nomogram for overall survival. TNM: Tumor-node-metastasis; PII: Prognostic immunoinflammatory index.
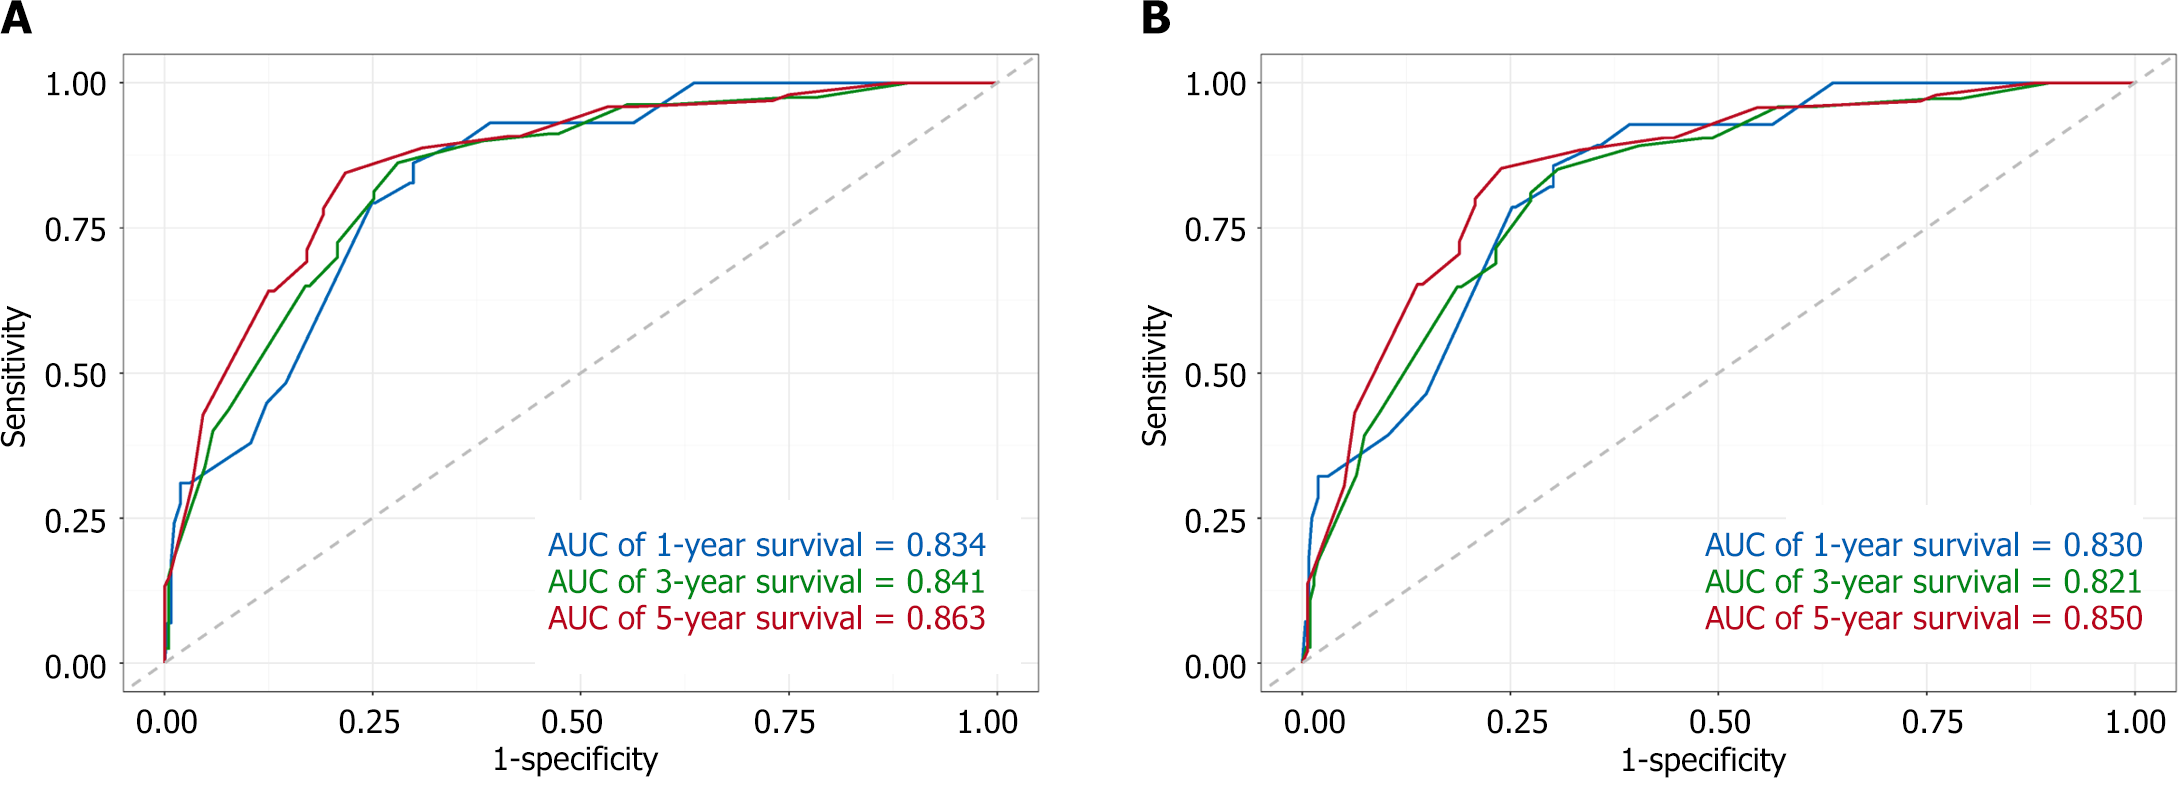
Figure 5 Time-dependent receiver operating characteristic curve analysis of the nomogram fo prediction of survival.
A: 1-, 3-, and 5-year area under the curves for progression-free survival; B: 1-, 3-, and 5-year area under the curves for overall survival. AUC: Area under the receiver operating characteristic curve.
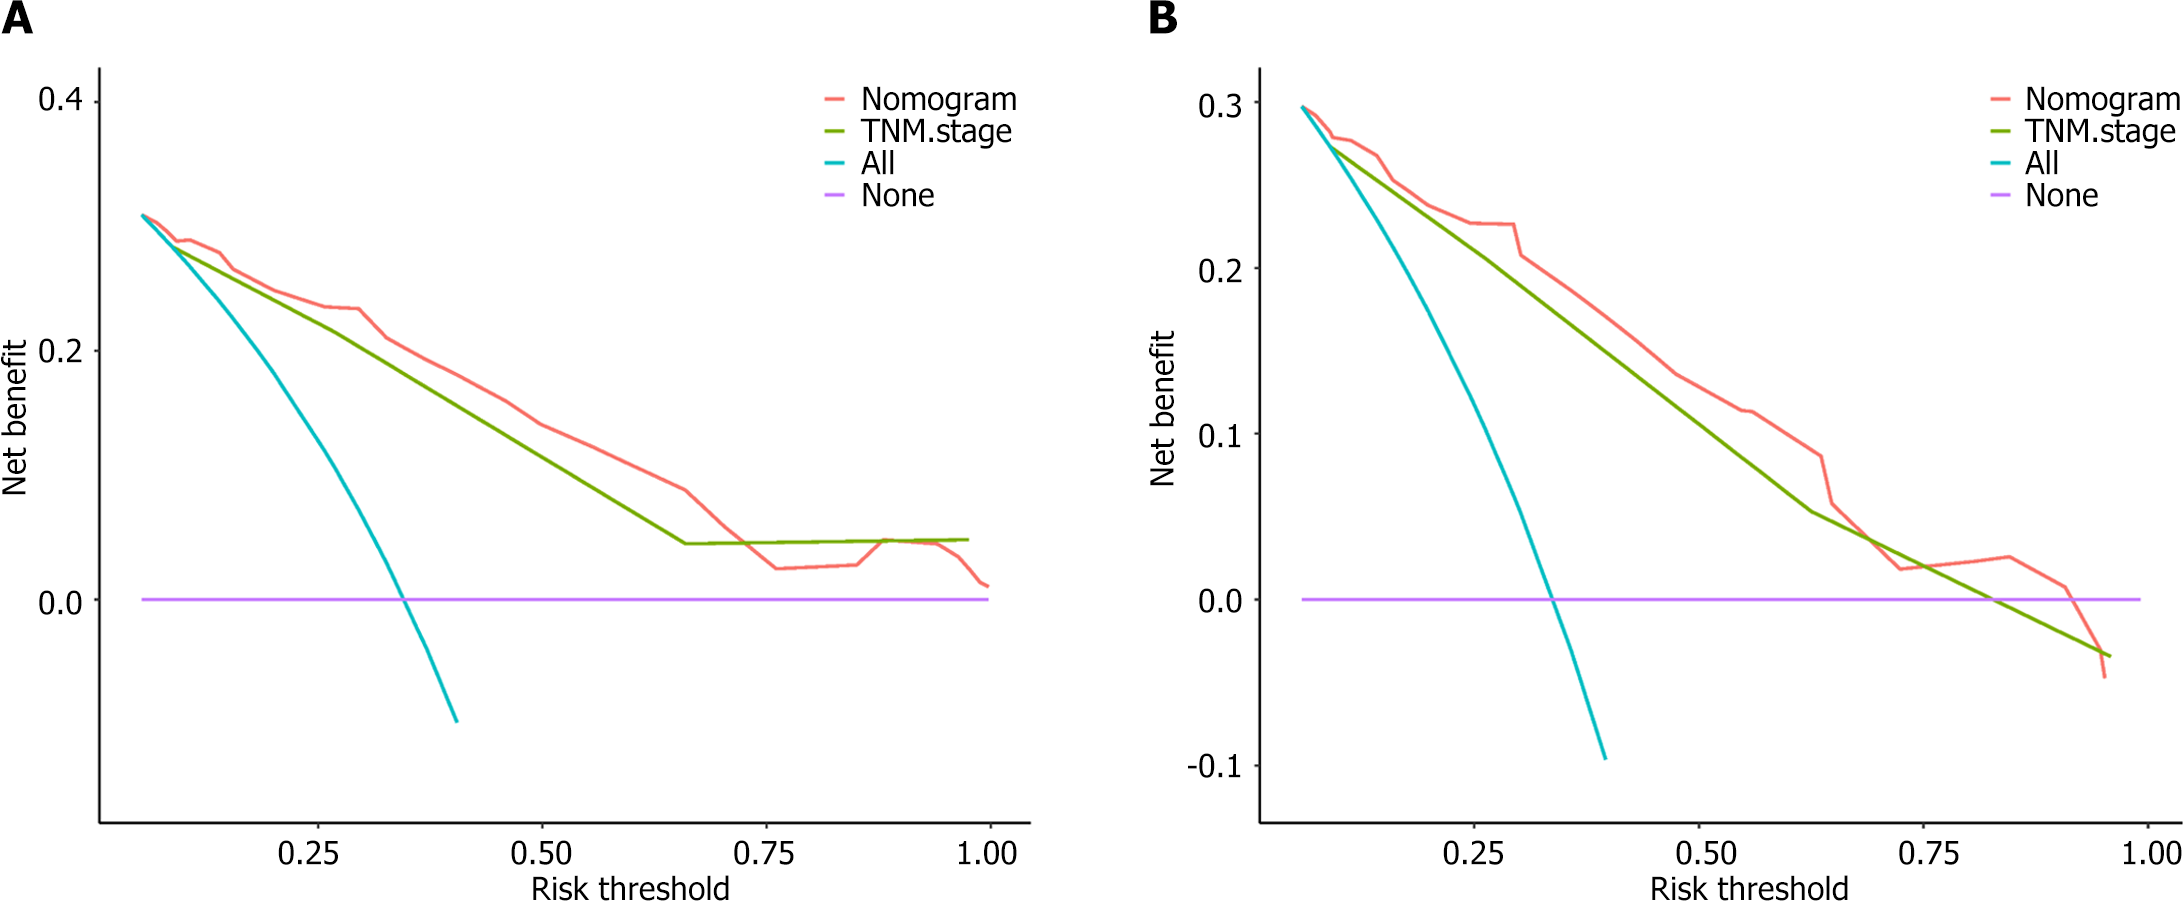
Figure 6 Decision curve analysis of the nomogram for prediction of survival.
A: Decision curve analysis for progression-free survival; B: Decision curve analysis for overall survival.
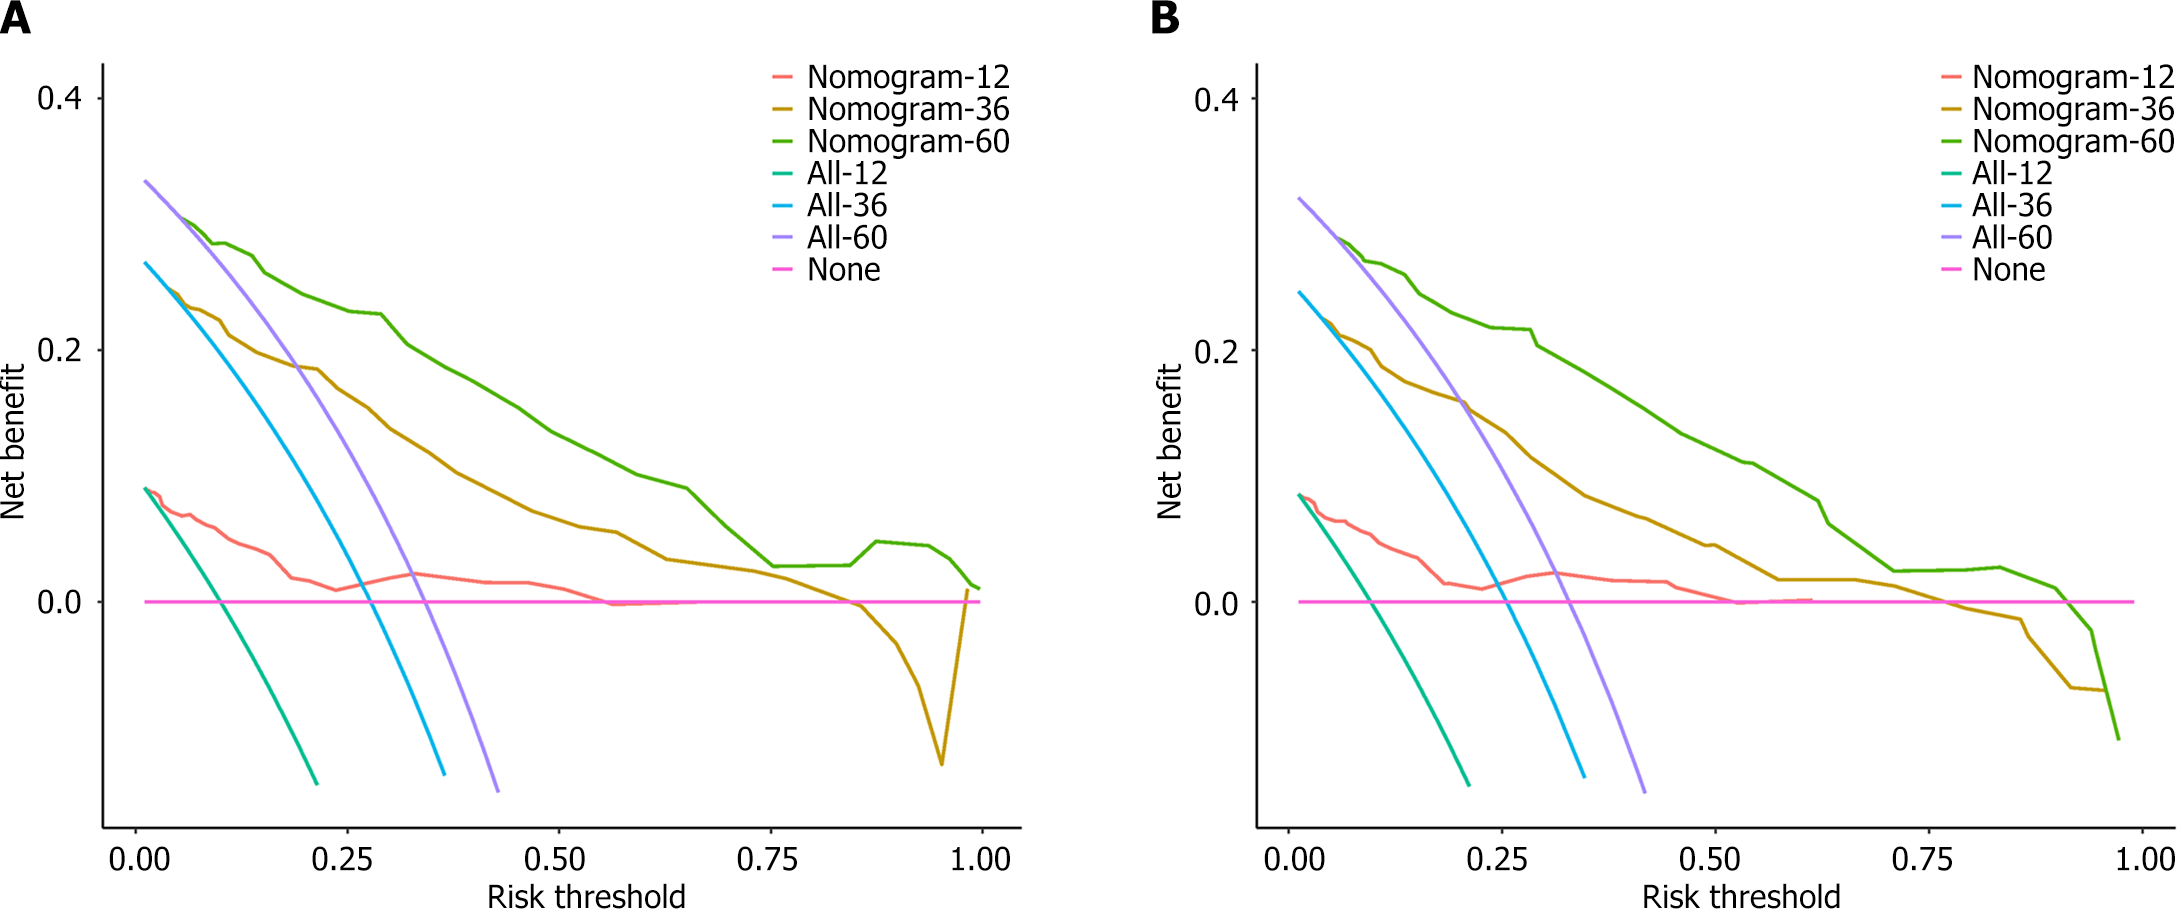
Figure 7 Decision curve analysis of the nomogram for prediction of 12-, 36-, and 60-mo survival.
A: 12-, 36-, and 60-mo decision curve analysis for progression-free survival; B: 12-, 36-, and 60-mo decision curve analysis for overall survival.
- Citation: Ba ZC, Zhu XQ, Li ZG, Li YZ. Development and validation of a prognostic immunoinflammatory index for patients with gastric cancer. World J Gastroenterol 2024; 30(24): 3059-3075
- URL: https://www.wjgnet.com/1007-9327/full/v30/i24/3059.htm
- DOI: https://dx.doi.org/10.3748/wjg.v30.i24.3059


