Copyright
©The Author(s) 2024.
World J Gastroenterol. Jun 21, 2024; 30(23): 3005-3015
Published online Jun 21, 2024. doi: 10.3748/wjg.v30.i23.3005
Published online Jun 21, 2024. doi: 10.3748/wjg.v30.i23.3005
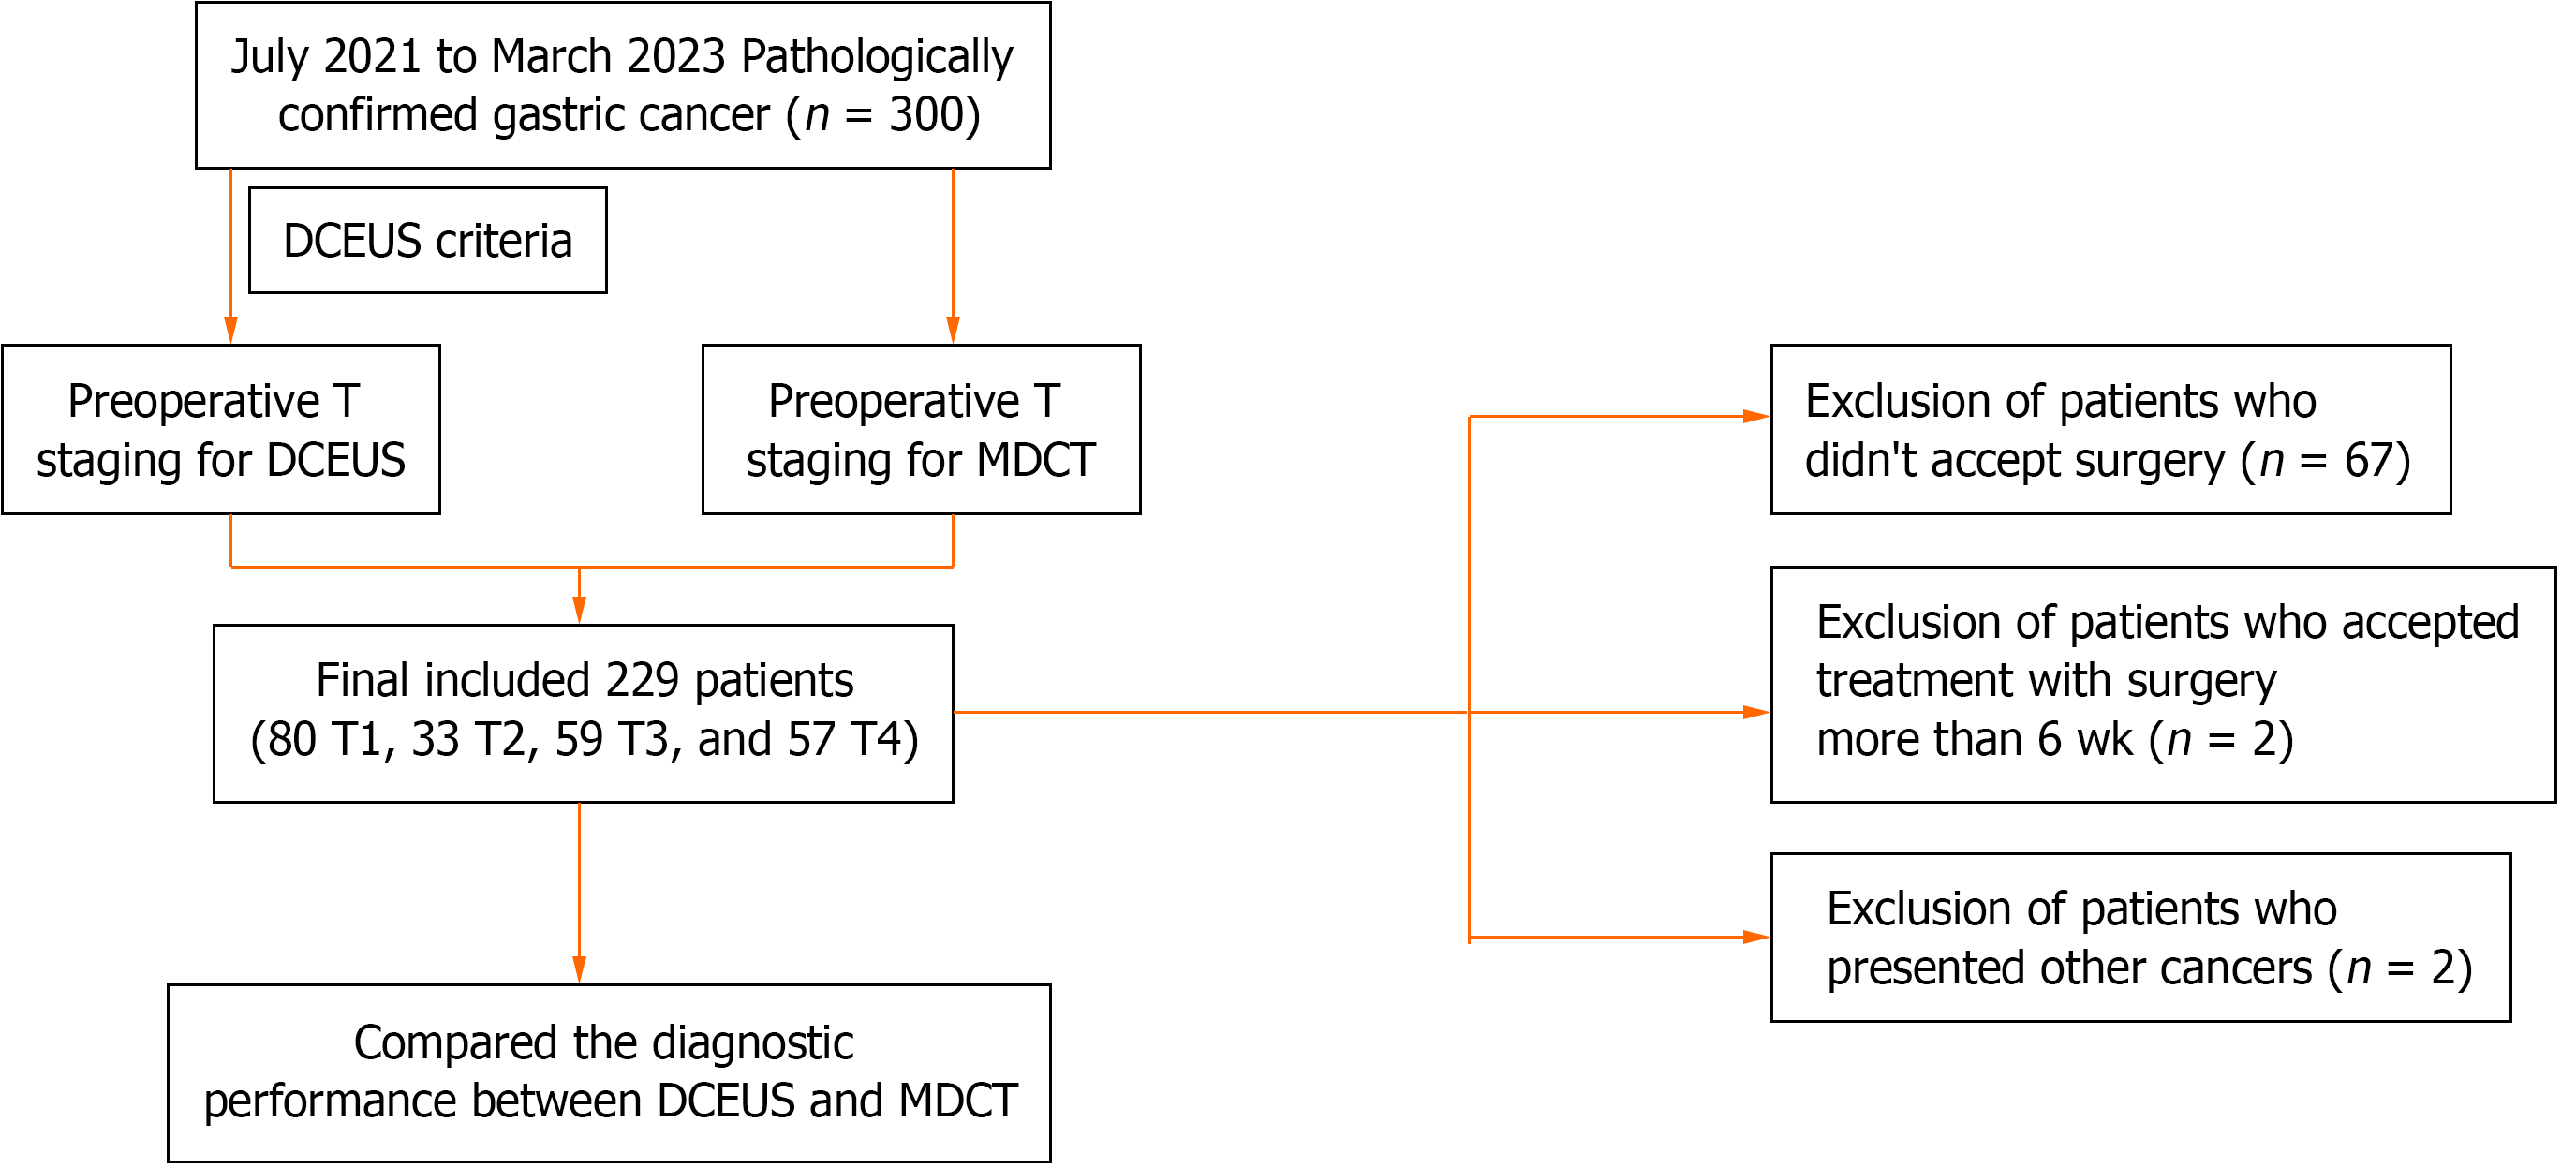
Figure 1 The flowchart of the study.
DCEUS: Double contrast-enhanced ultrasonography; MDCT: Multi-detector computed tomography.
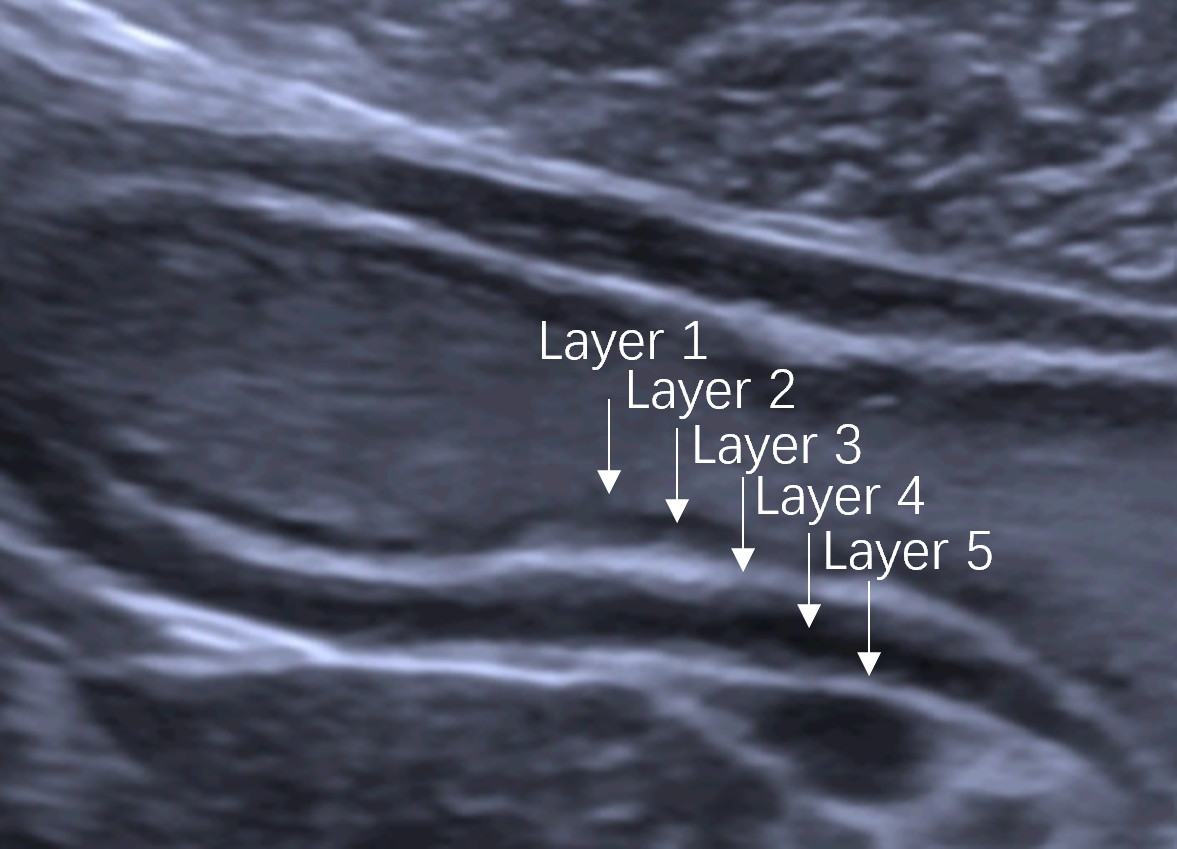
Figure 2 The 5-layer structure of the normal gastric wall on ultrasonography.
The 5-layer structure of the normal gastric wall is numbered from the luminal side. Layer 1 is the interface echo between the gastric lumen and the mucosa, layer 2 is the rest of the mucosa, layer 3 is the submucosa, layer 4 is the muscularis propria, and layer 5 is the serosa.
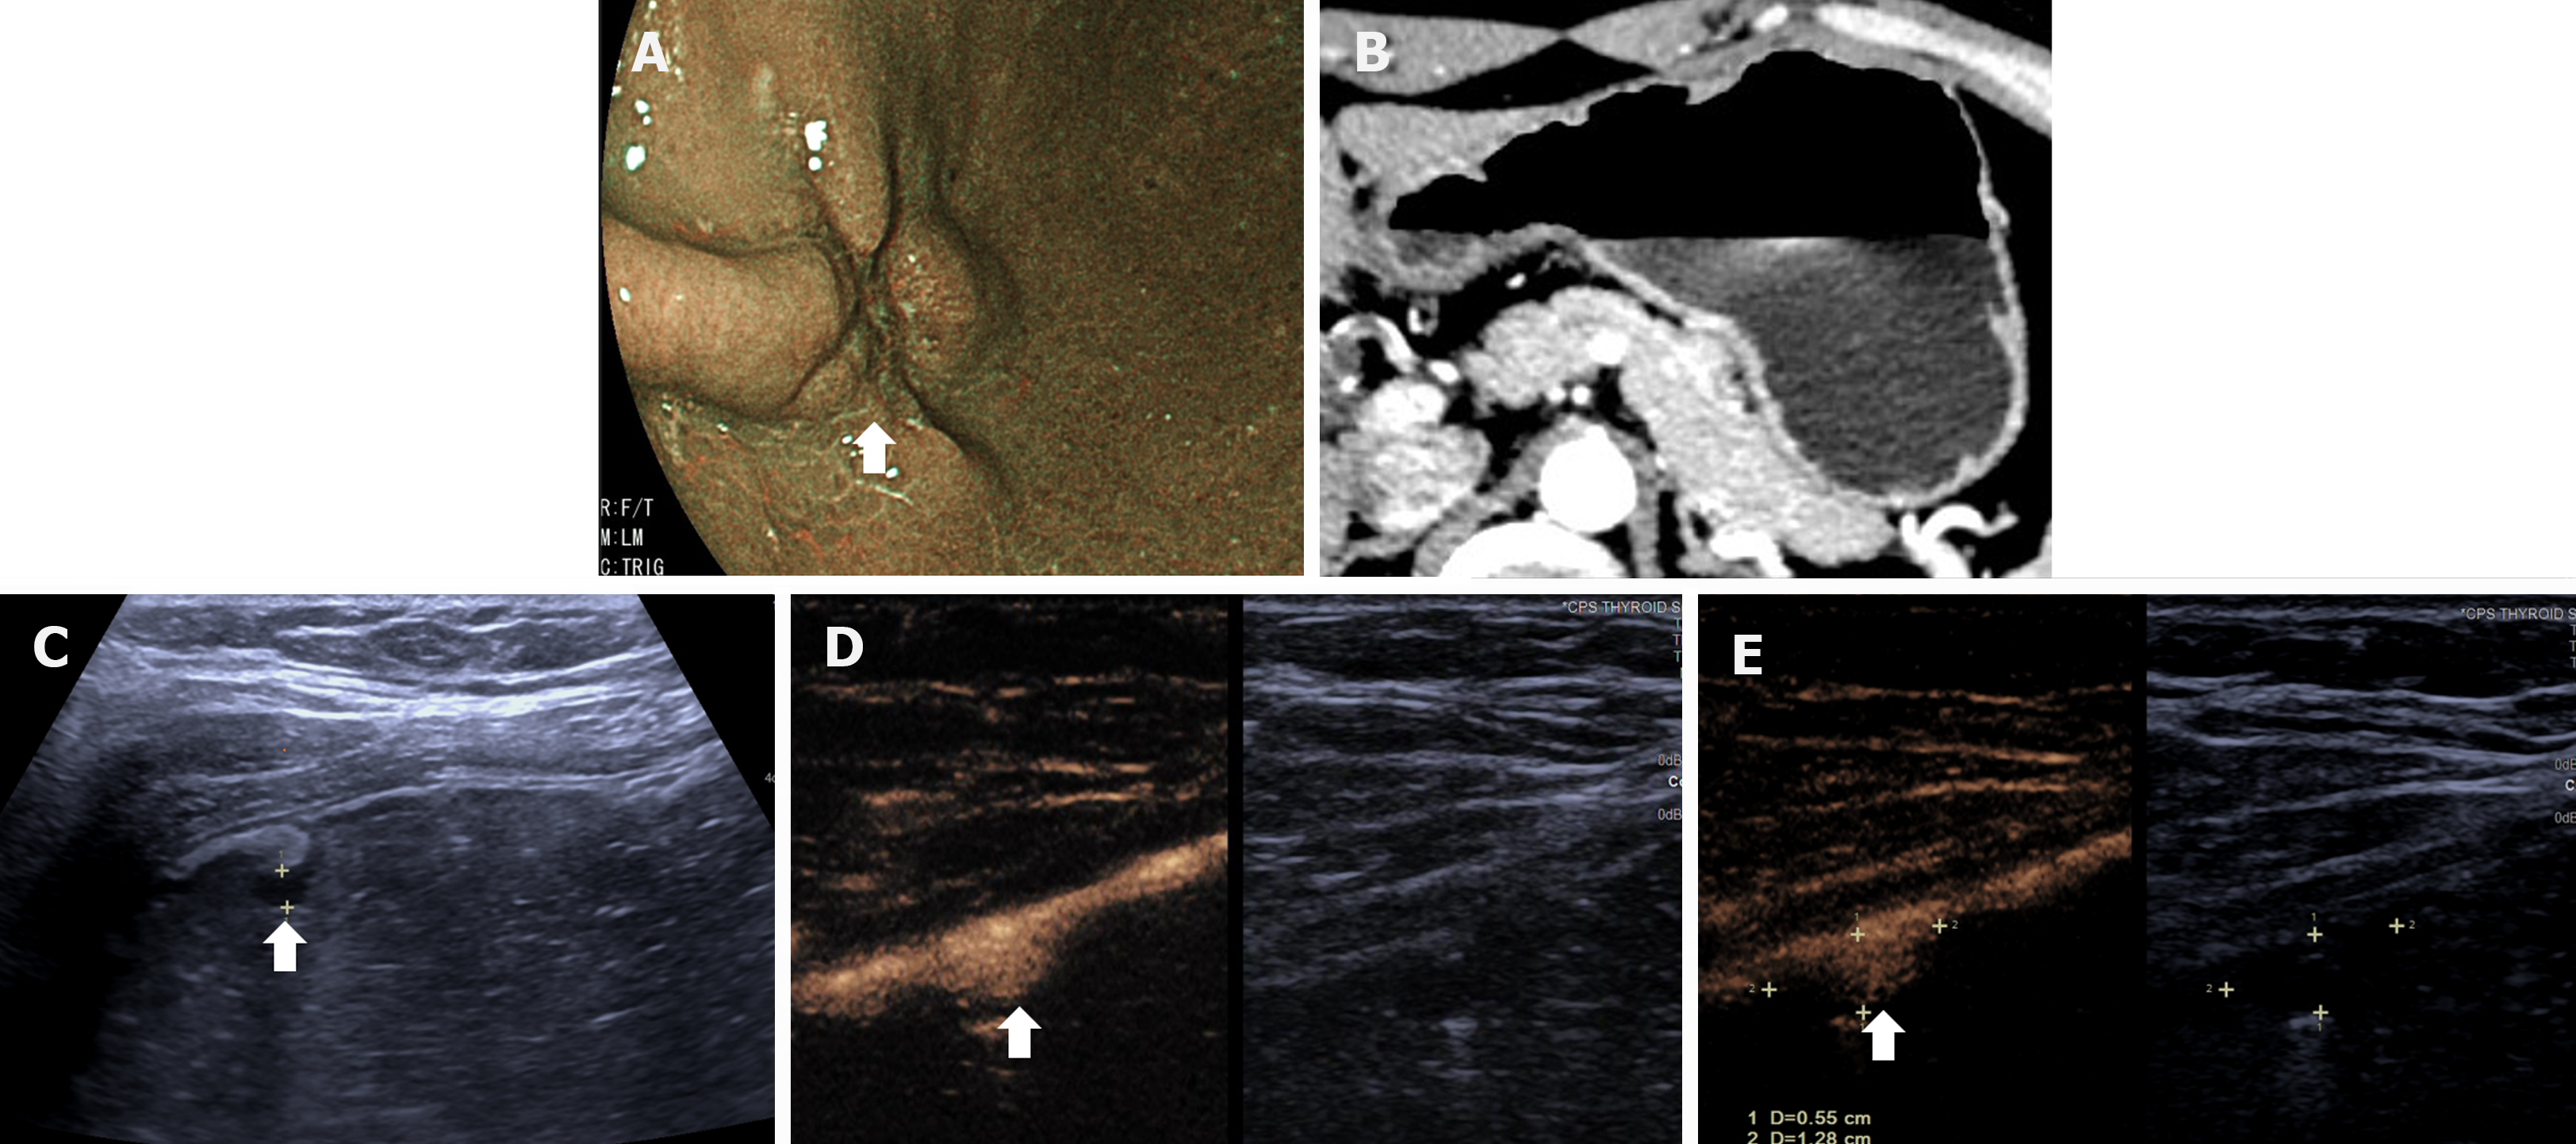
Figure 3 Images of T1a gastric cancer in a 52-year-old woman.
A: Gastroscopic image shows a malignant ulcer (arrow) with converging folds and uneven margin; B: Multi-detector computed tomography image shows the gastric wall with no tumor; C: US image shows the hypoechoic lesion (arrow) with the focal thickened mucosa.; D: In the arterial phase, focal thickening of the mucosa is visualized. The lesion shows slightly delayed hyper-enhancement, similar to the submucosal layer; E: In the venous phase, the lesion shows hypo-enhancement compared to the submucosal layer. The submucosal layer consistently shows hyper-enhancement and is continuous and intact. The muscular layer shows linear hypo-enhancement, and is continuous and intact.
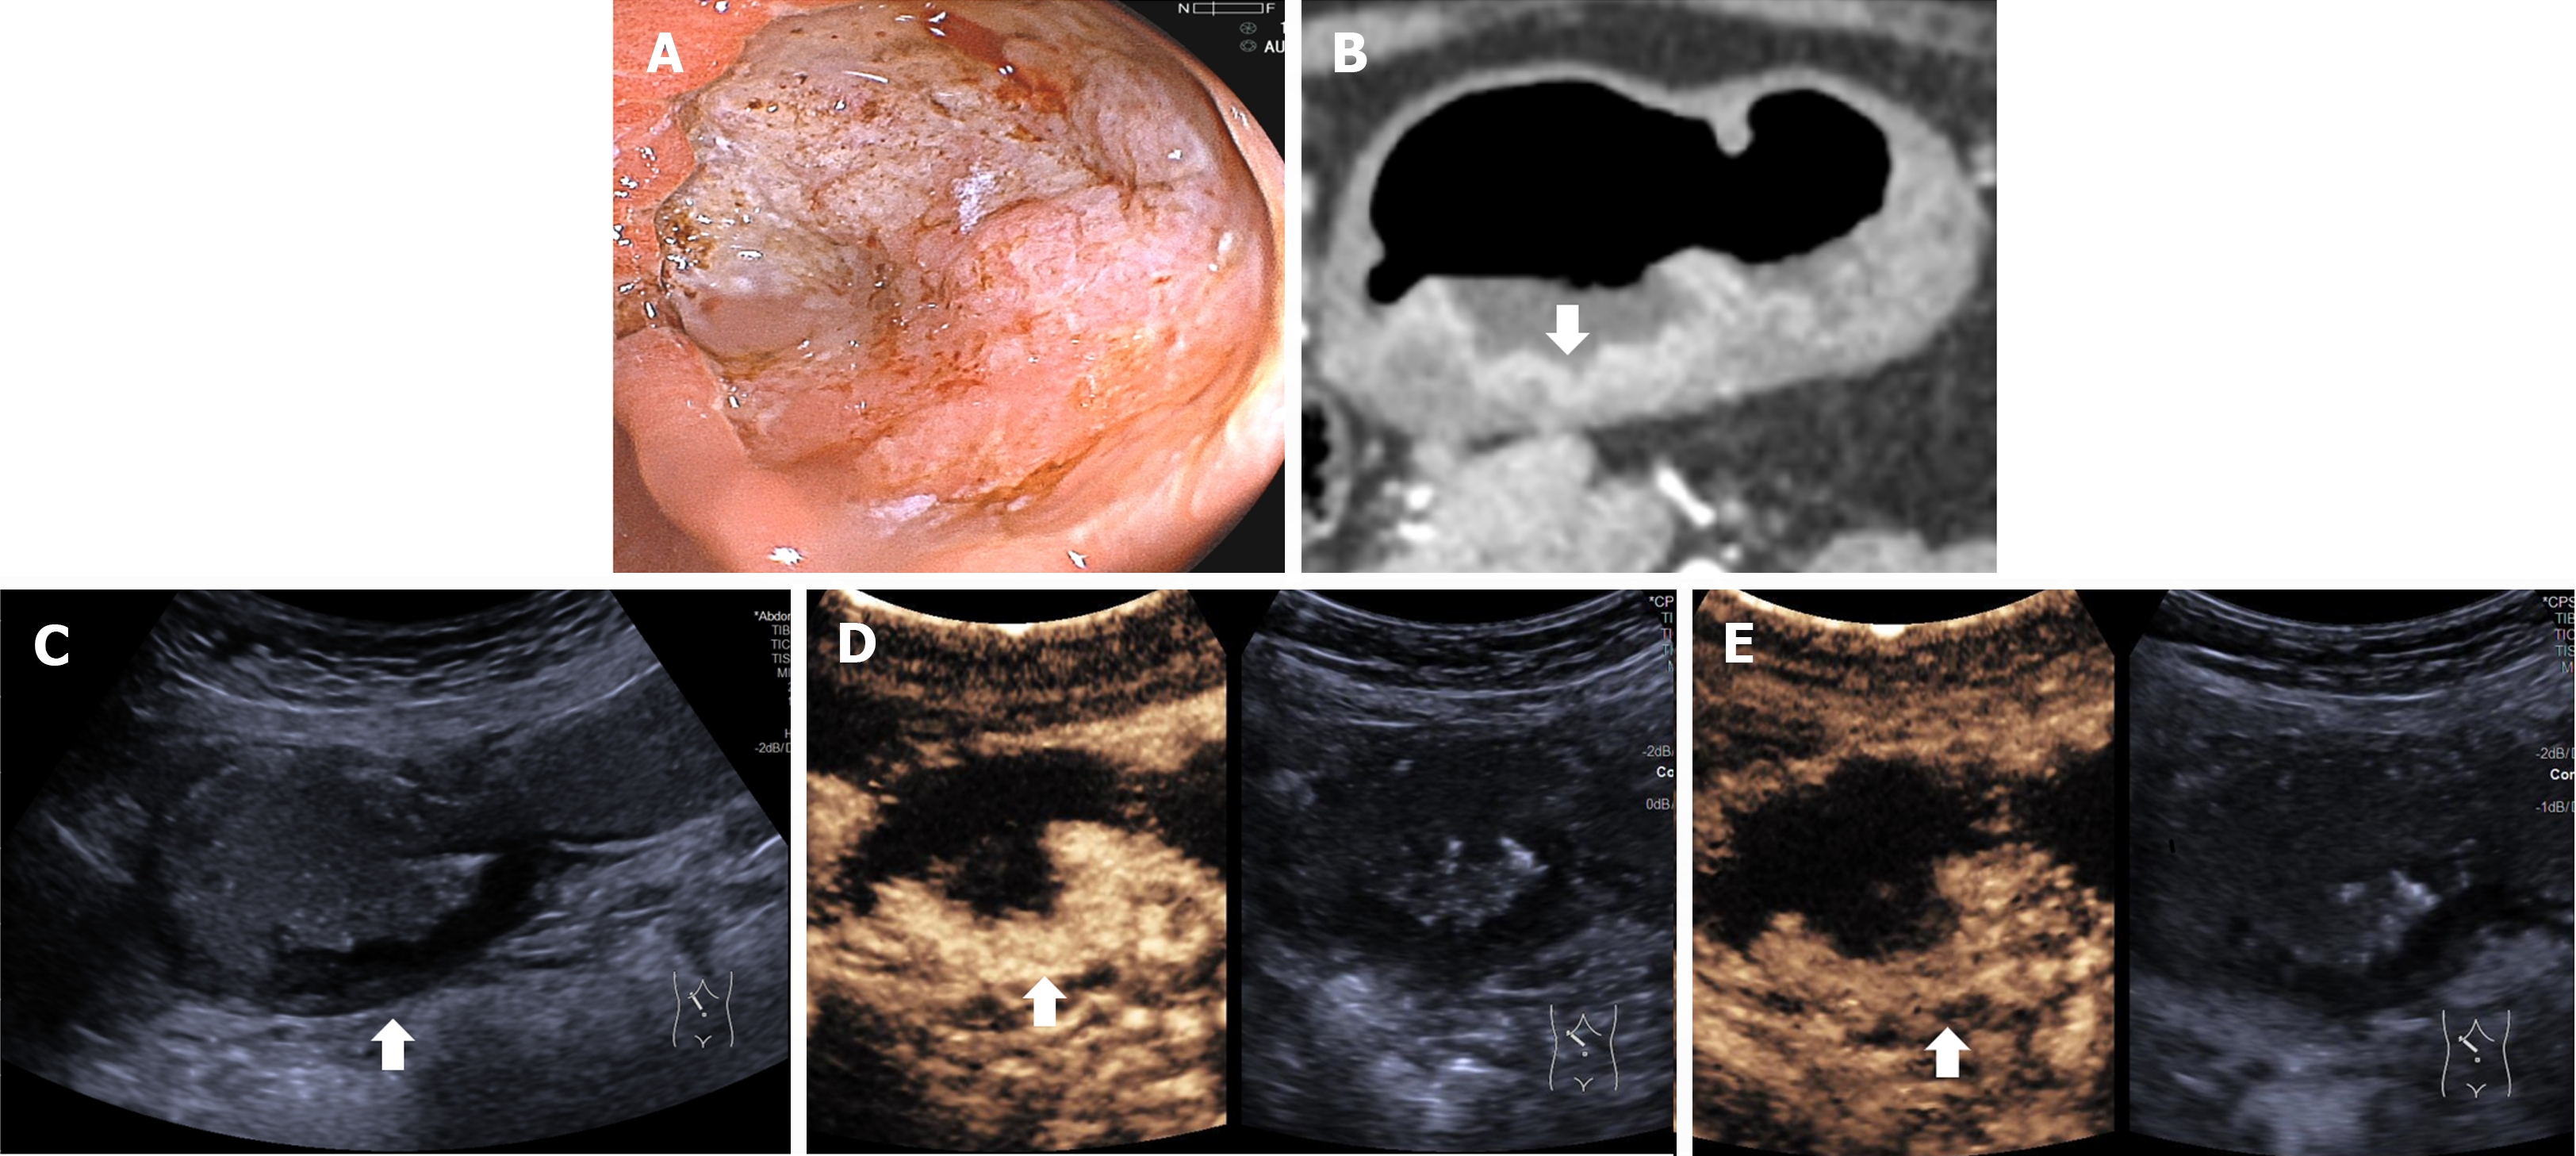
Figure 4 Images of T2 gastric cancer in a 65-year-old woman.
A: Gastroscopic image shows a typical ulcerative tumor; B: Multi-detector computed tomography image shows transmural, enhancing tumor (arrow) with smooth outer border of gastric wall; C: ultrasonography image shows the hypoechoic ulceroinfiltrative tumor (arrow). The mucosa, submucosa and partly muscularis propria are disruptive; D: In the arterial phase, disruption of the mucosa, submucosa and partly muscularis propria are visualized. The lesion shows homogenous hyper-enhancement, similar to the normal submucosal layer; E: In the venous phase, the lesion shows homogenous hypo-enhancement. The hyper-enhancement strip of submucosal layer and partly hypo-enhancement strip of the muscularis propria are disruptive.
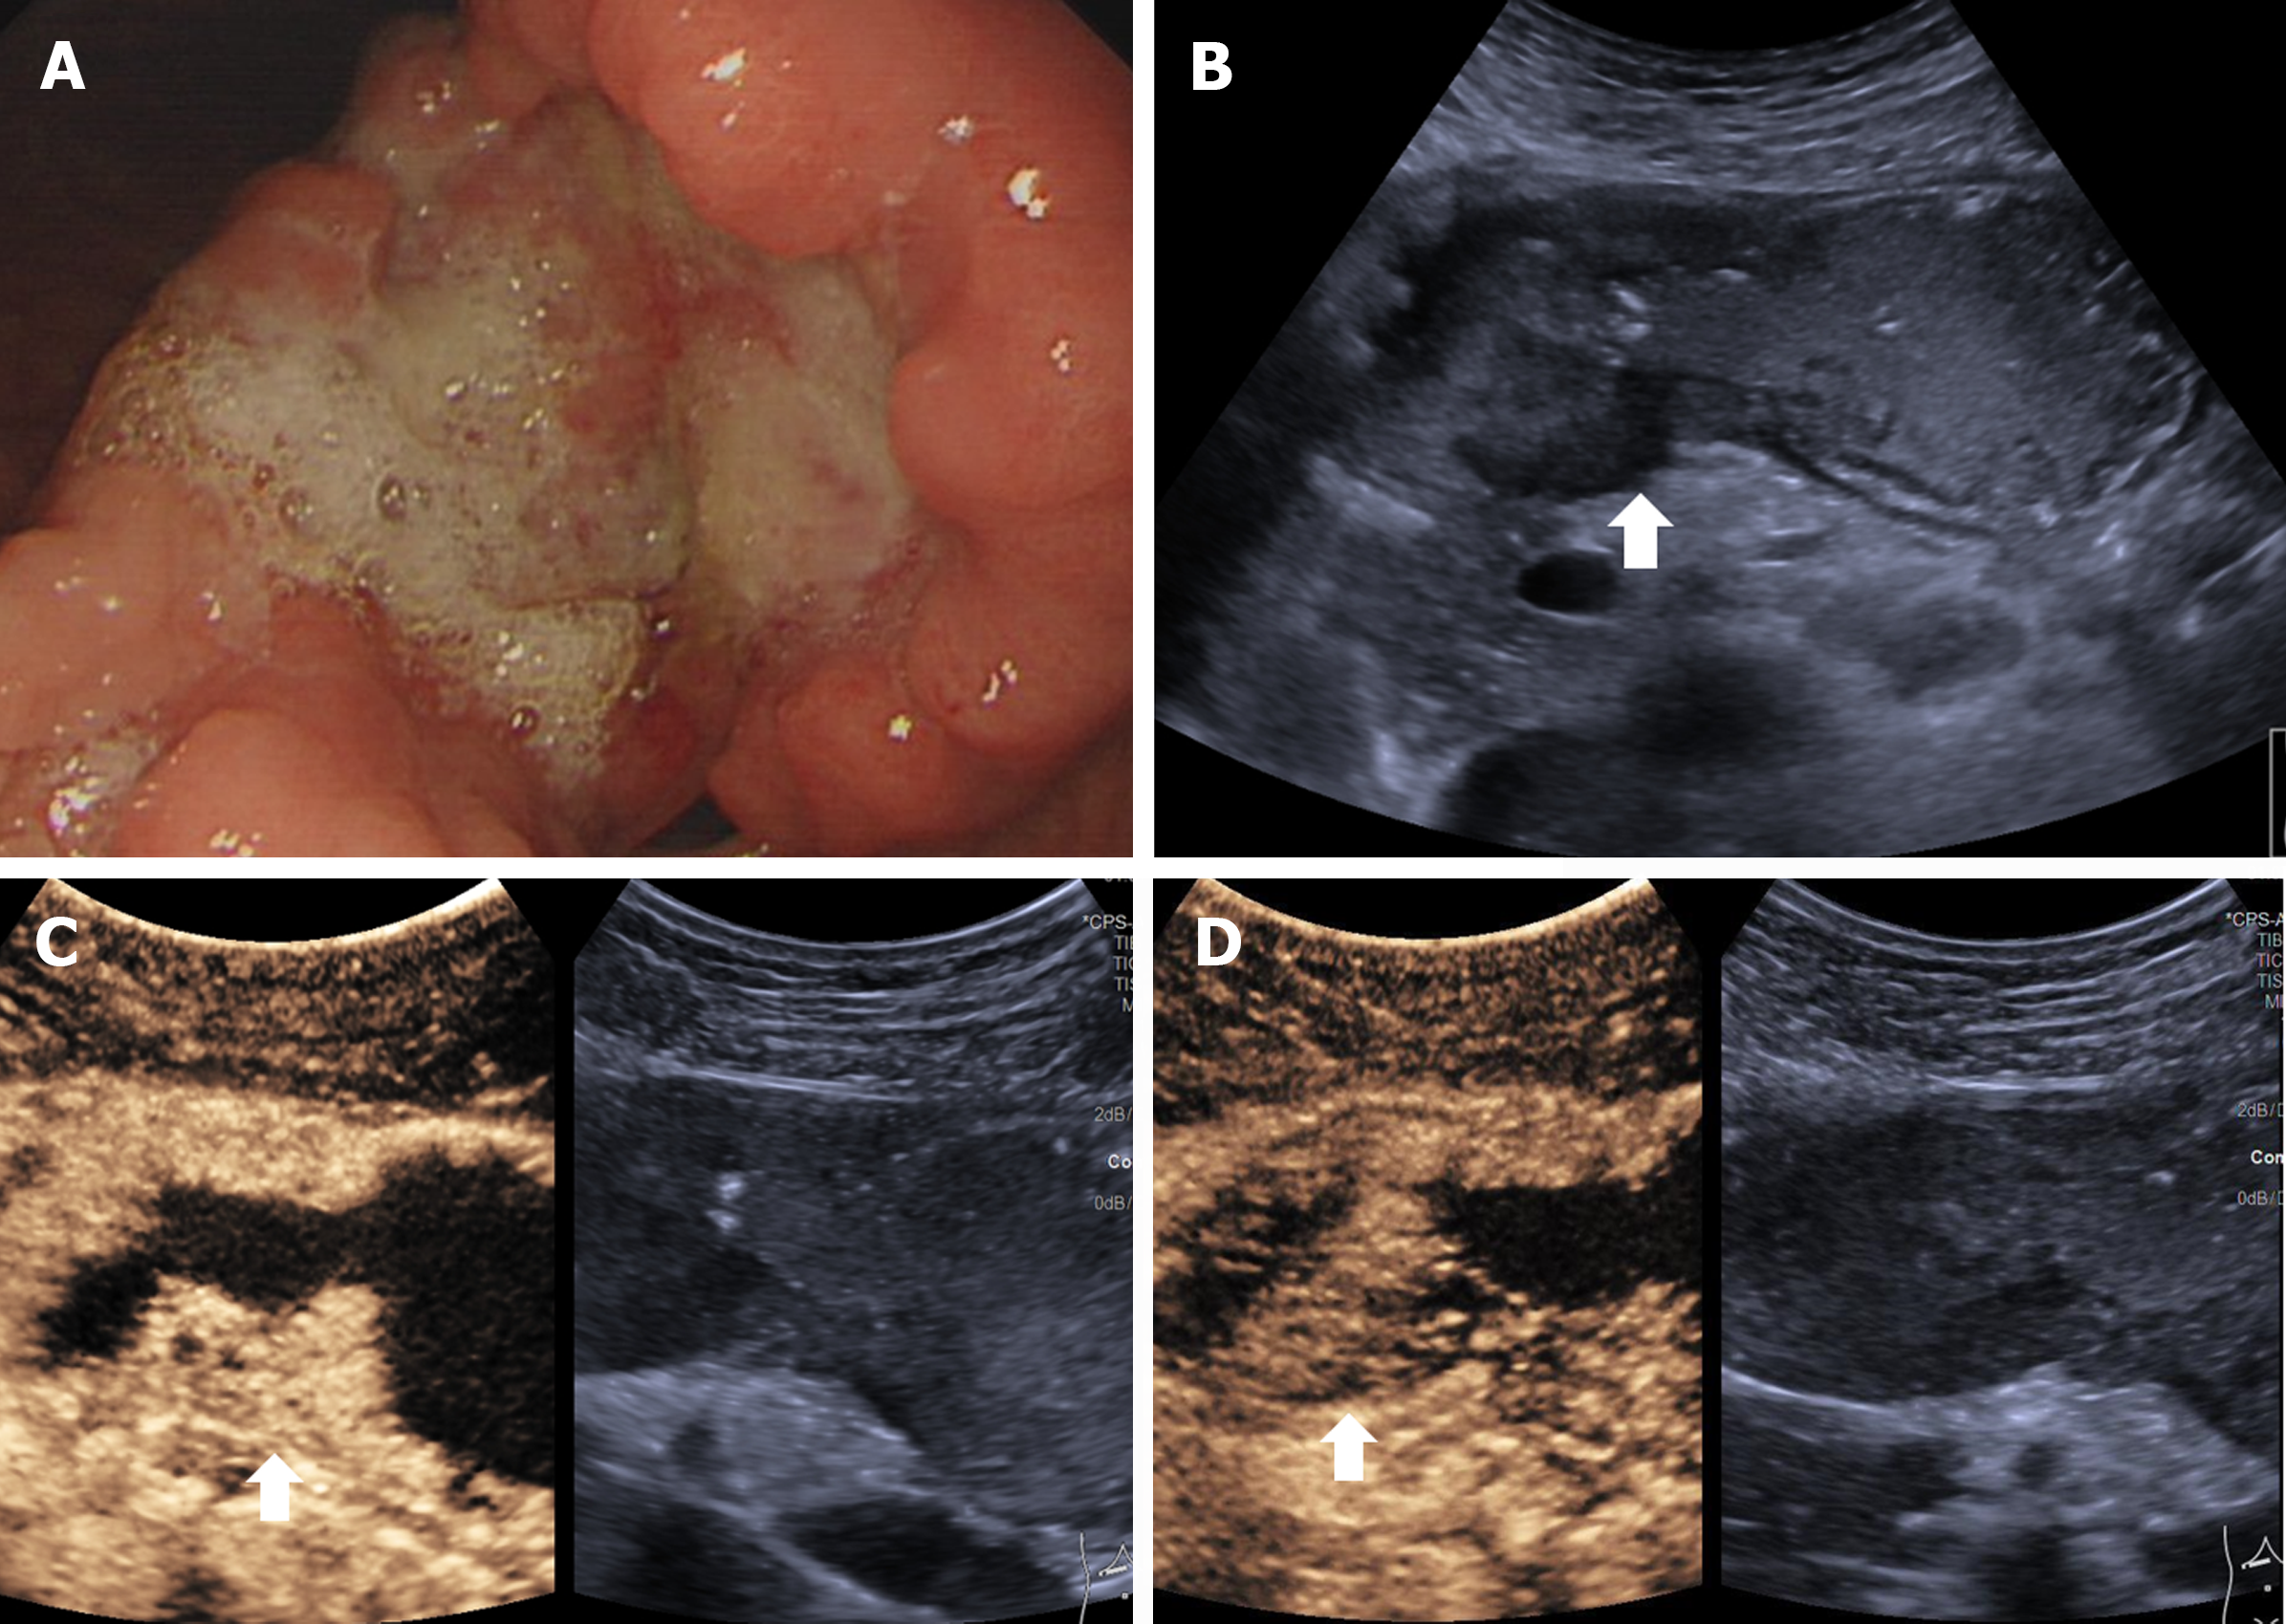
Figure 5 Images of T3 gastric cancer in a 58-year-old man.
A: Gastroscopic image shows an ulcerative tumor; B: US image shows the hypoechoic tumor (arrow) with disruption of the mucosa, submucosa and muscularis propria. The outer margin of the serosa is slightly blurred; C: In the arterial phase, disruption of the mucosa, submucosa and muscularis propria are visualized. The lesion shows homogenous hyper-enhancement, similar to the normal submucosal layer; D: In the venous phase, the lesion shows homogenous hypo-enhancement. The hyper-enhancement strip of the submucosal layer and hypo-enhancement strip of the muscularis propria are disruptive. A few small linear stranding within the serosa is observed. The enhancing serosa is continuous.
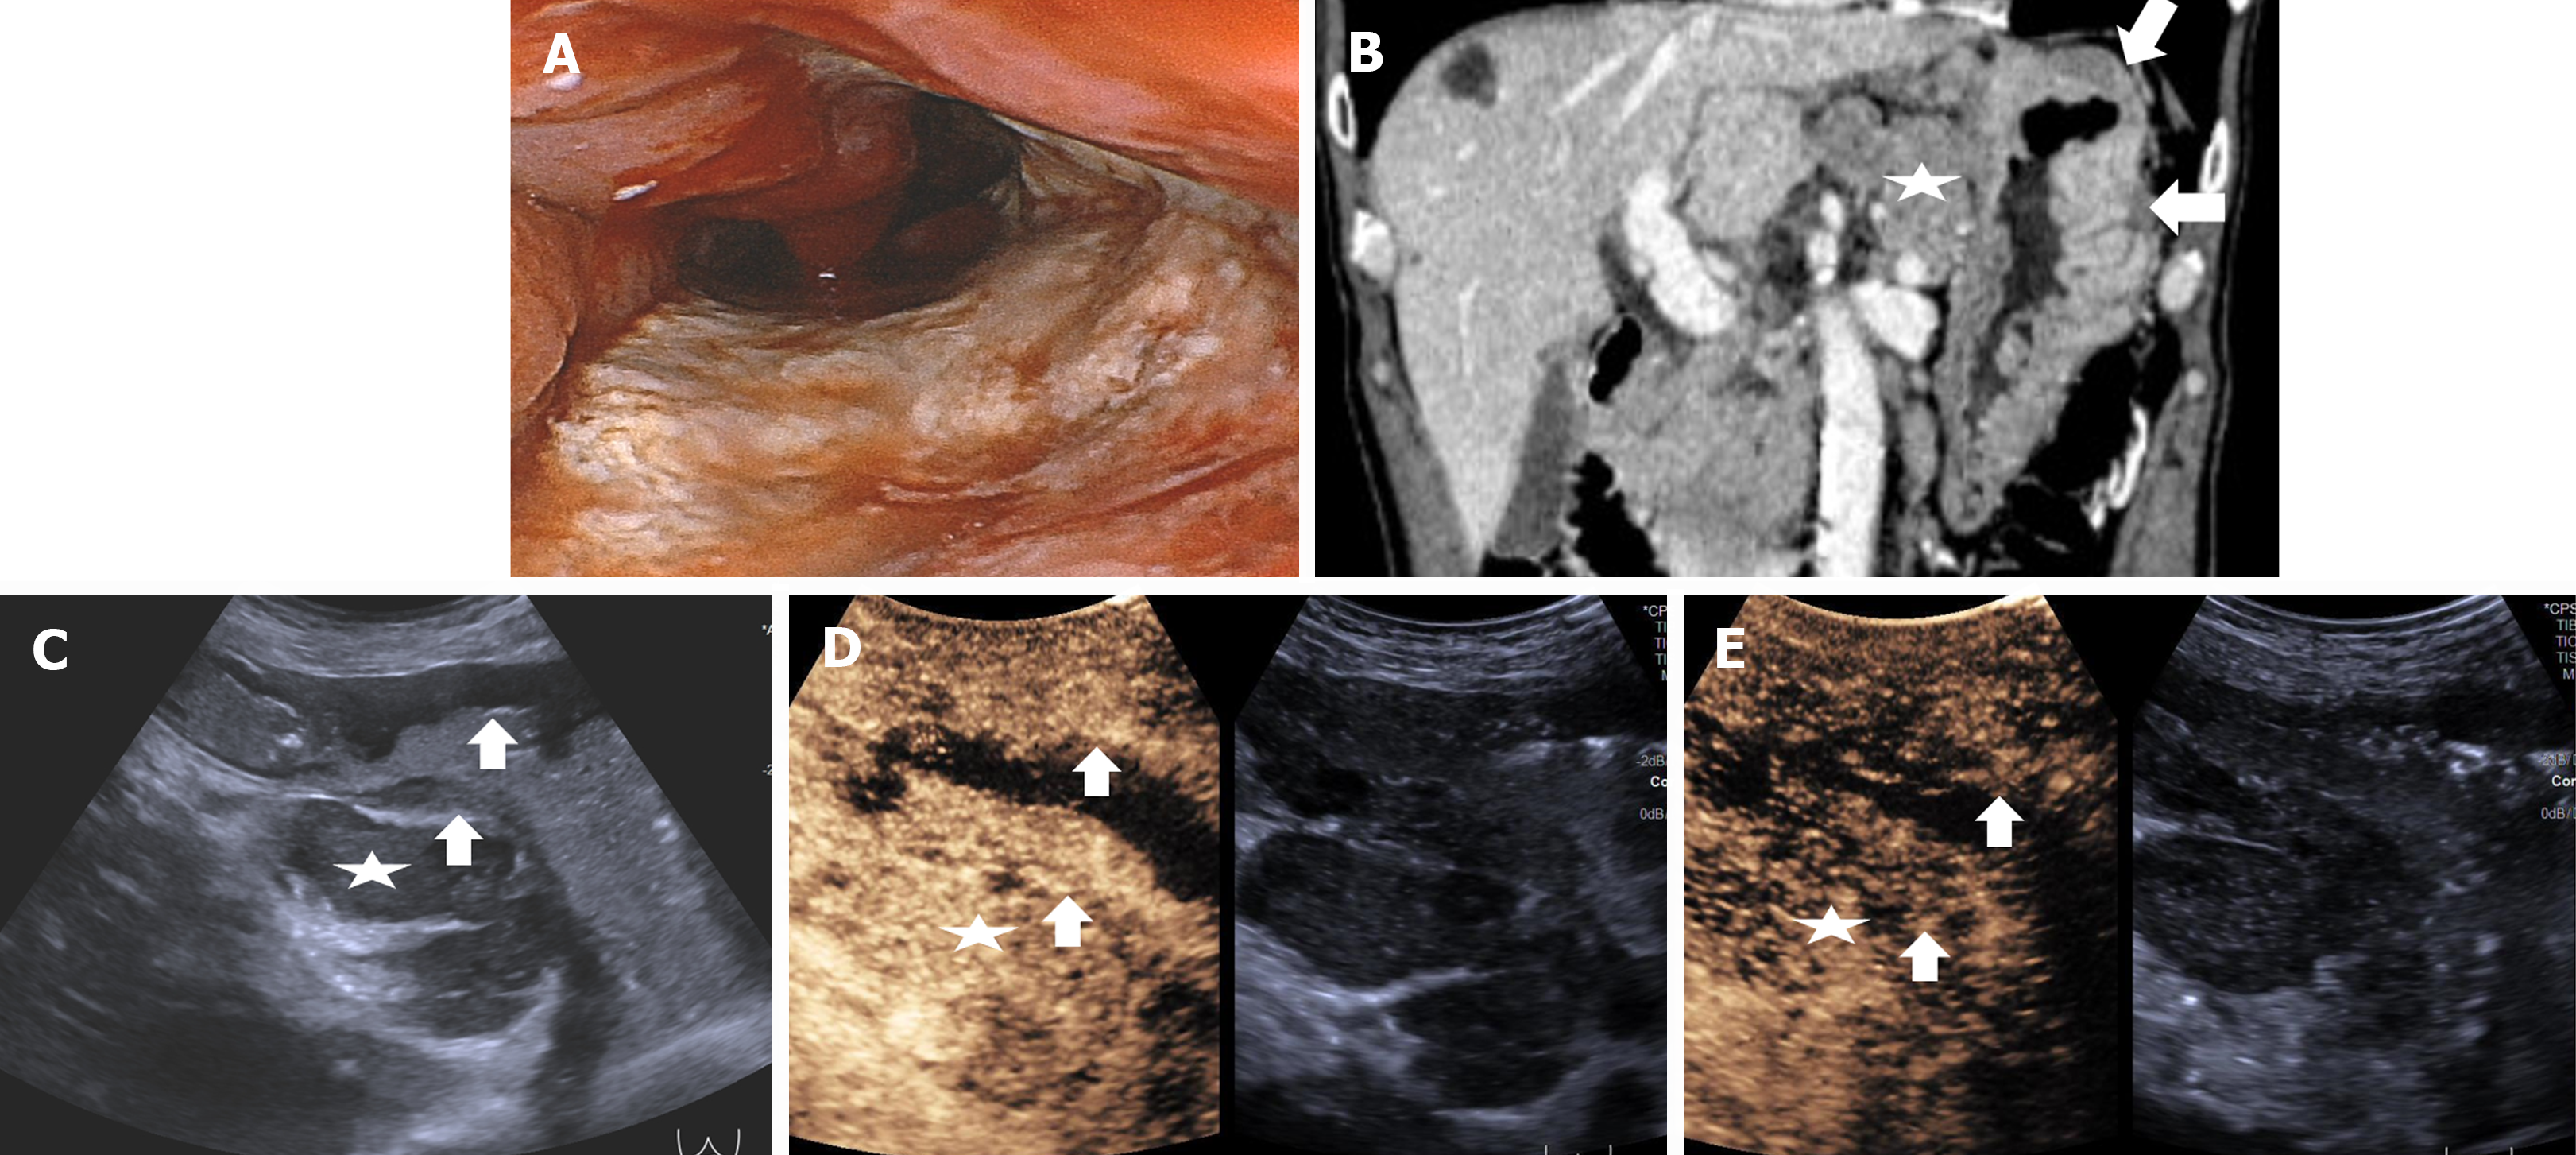
Figure 6 Images of T4a gastric cancer in a 60-year-old man.
A: Gastroscopic image shows a diffuse ulcerative tumor; B: MDCT image shows the tumor (arrows) with diffuse thickening of the whole gastric wall, band-like perigastric fat infiltration, and cluster of enhancing nodes (star) around perigastric region; C: US image shows the hypoechoic diffuse tumor (arrows) with irregular margin of the serosa, banded infiltration of the adjacent fat plane, and cluster of nodes (star) in perigastric region; D and E: CEUS images show the tumor (arrows) with surrounding perigastric fat plane and cluster of nodes (star) synchronous hyper-enhancement in the arterial phase (D), and synchronous hypo-enhancement in the venous phase (E). The hyper-enhancement strip of the submucosal and serosal layers and hypo-enhancement strip of the muscularis propria are disruptive.
- Citation: Xu YF, Ma HY, Huang GL, Zhang YT, Wang XY, Wei MJ, Pei XQ. Double contrast-enhanced ultrasonography improves diagnostic accuracy of T staging compared with multi-detector computed tomography in gastric cancer patients. World J Gastroenterol 2024; 30(23): 3005-3015
- URL: https://www.wjgnet.com/1007-9327/full/v30/i23/3005.htm
- DOI: https://dx.doi.org/10.3748/wjg.v30.i23.3005


