Copyright
©The Author(s) 2024.
World J Gastroenterol. Jun 21, 2024; 30(23): 2991-3004
Published online Jun 21, 2024. doi: 10.3748/wjg.v30.i23.2991
Published online Jun 21, 2024. doi: 10.3748/wjg.v30.i23.2991
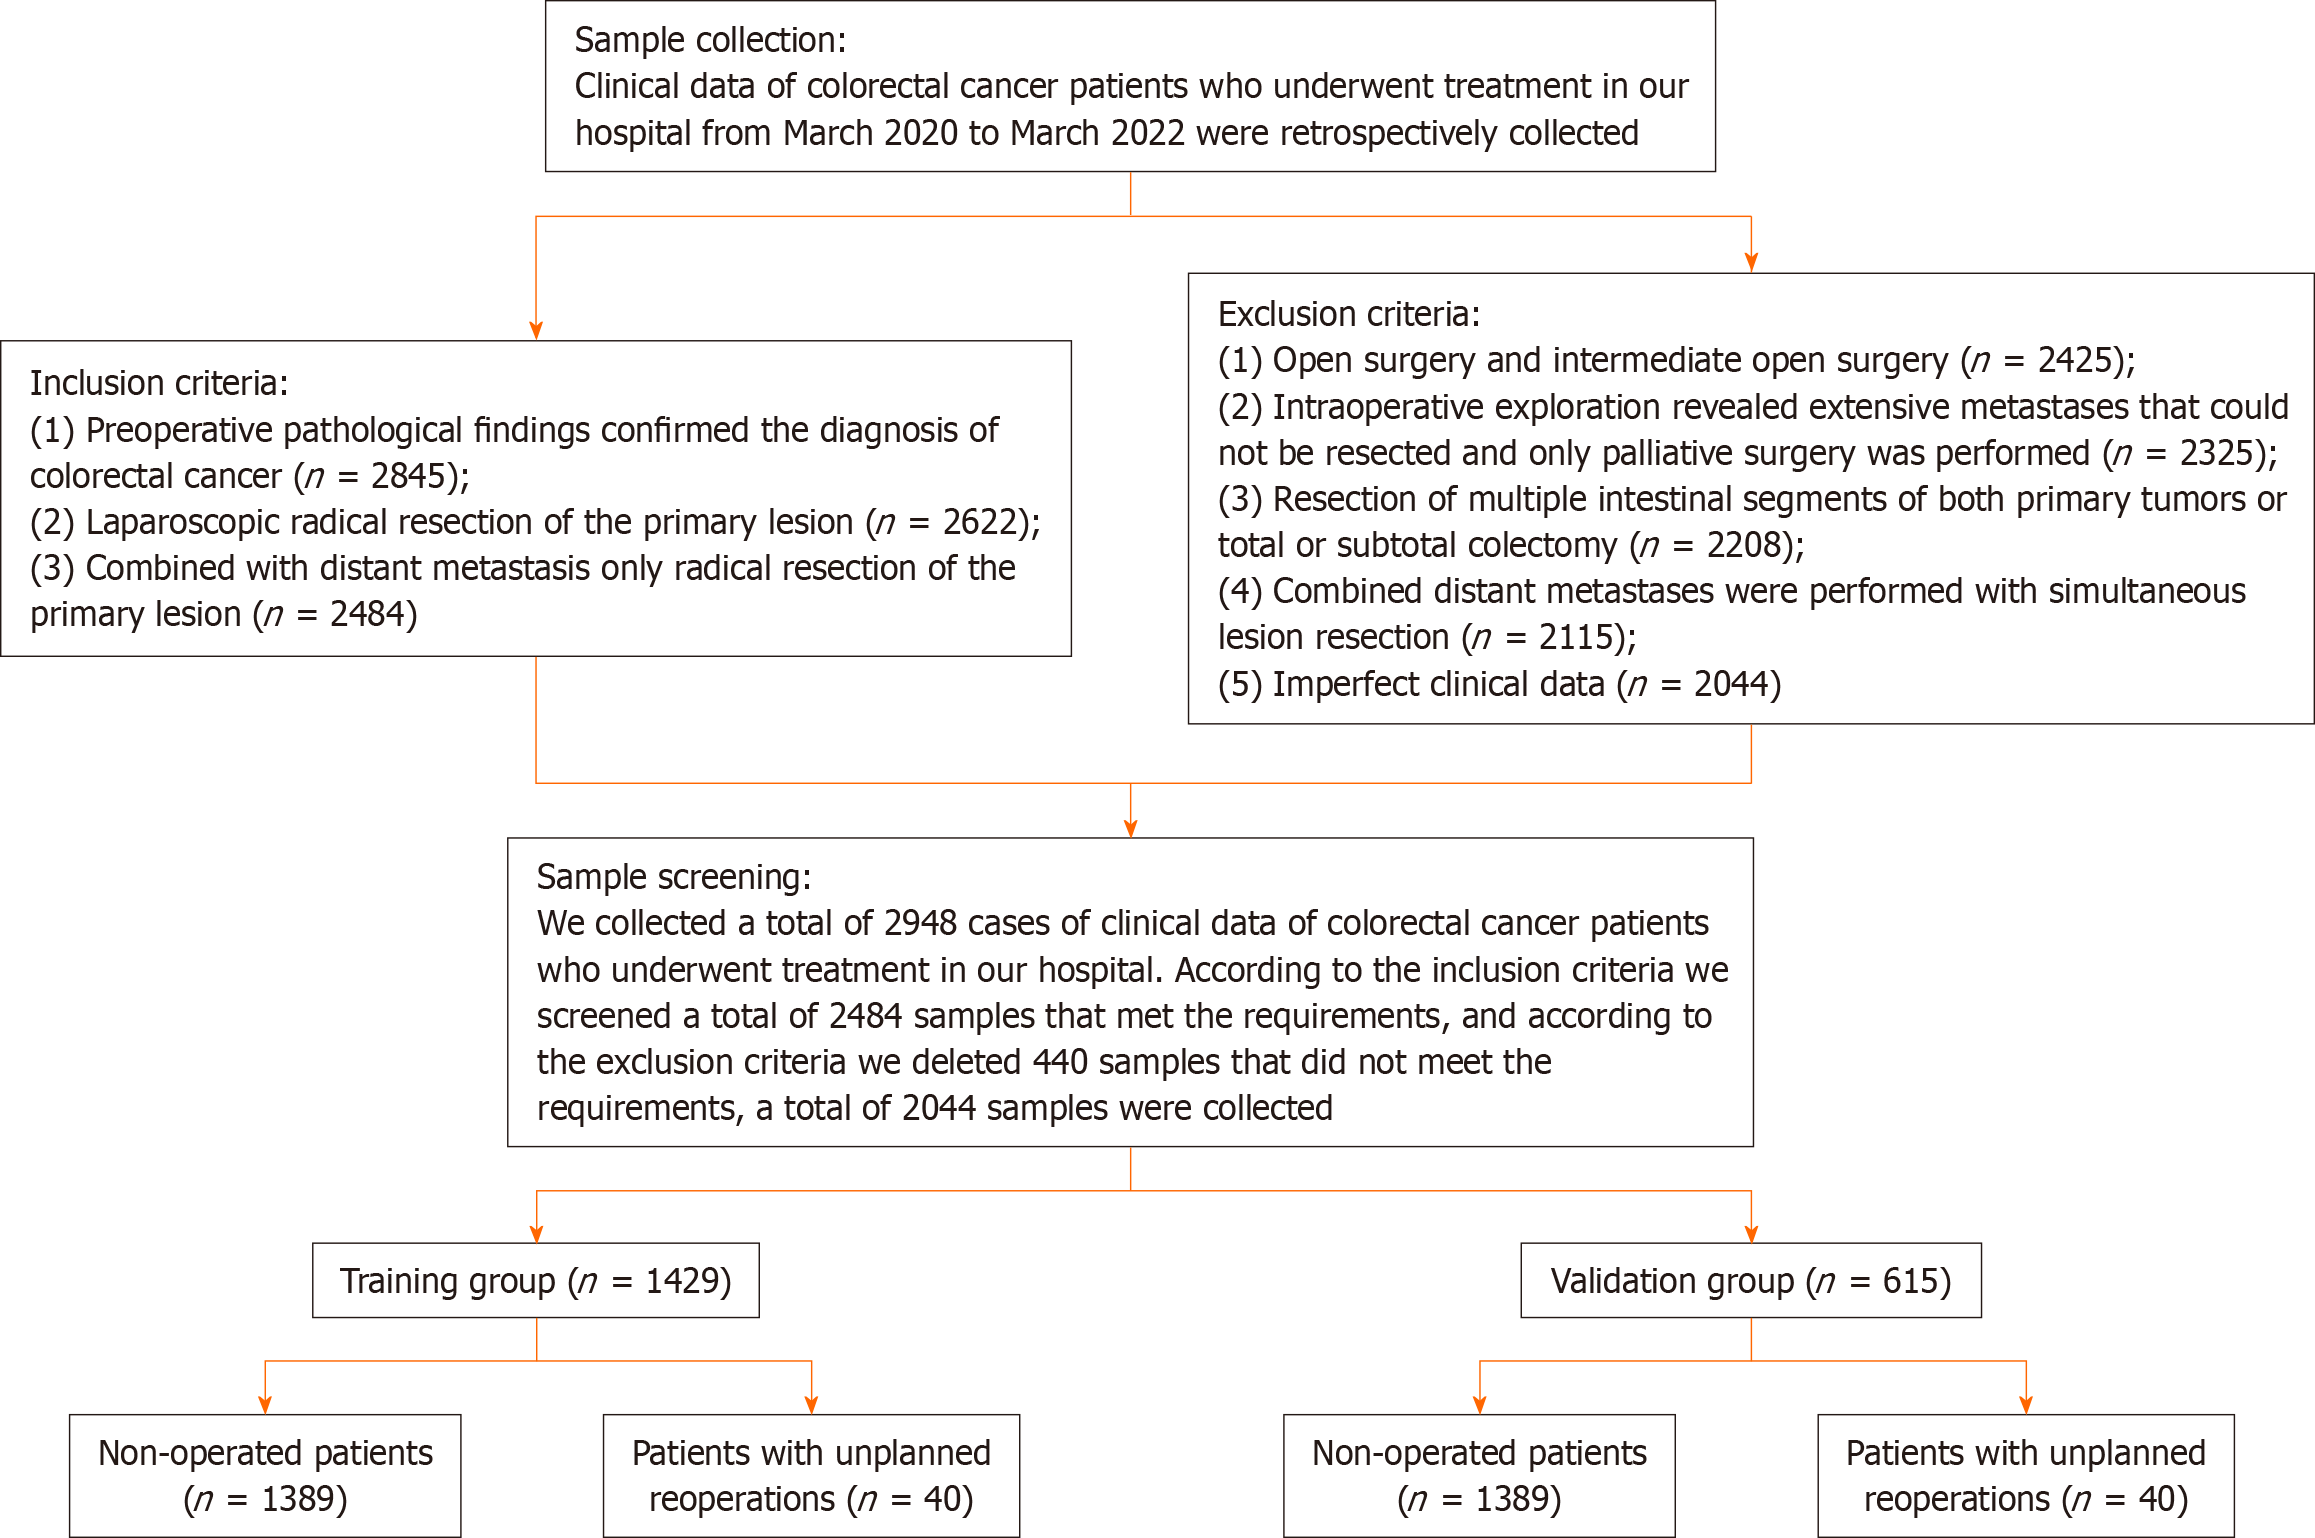
Figure 1 Sample screening flow chart.
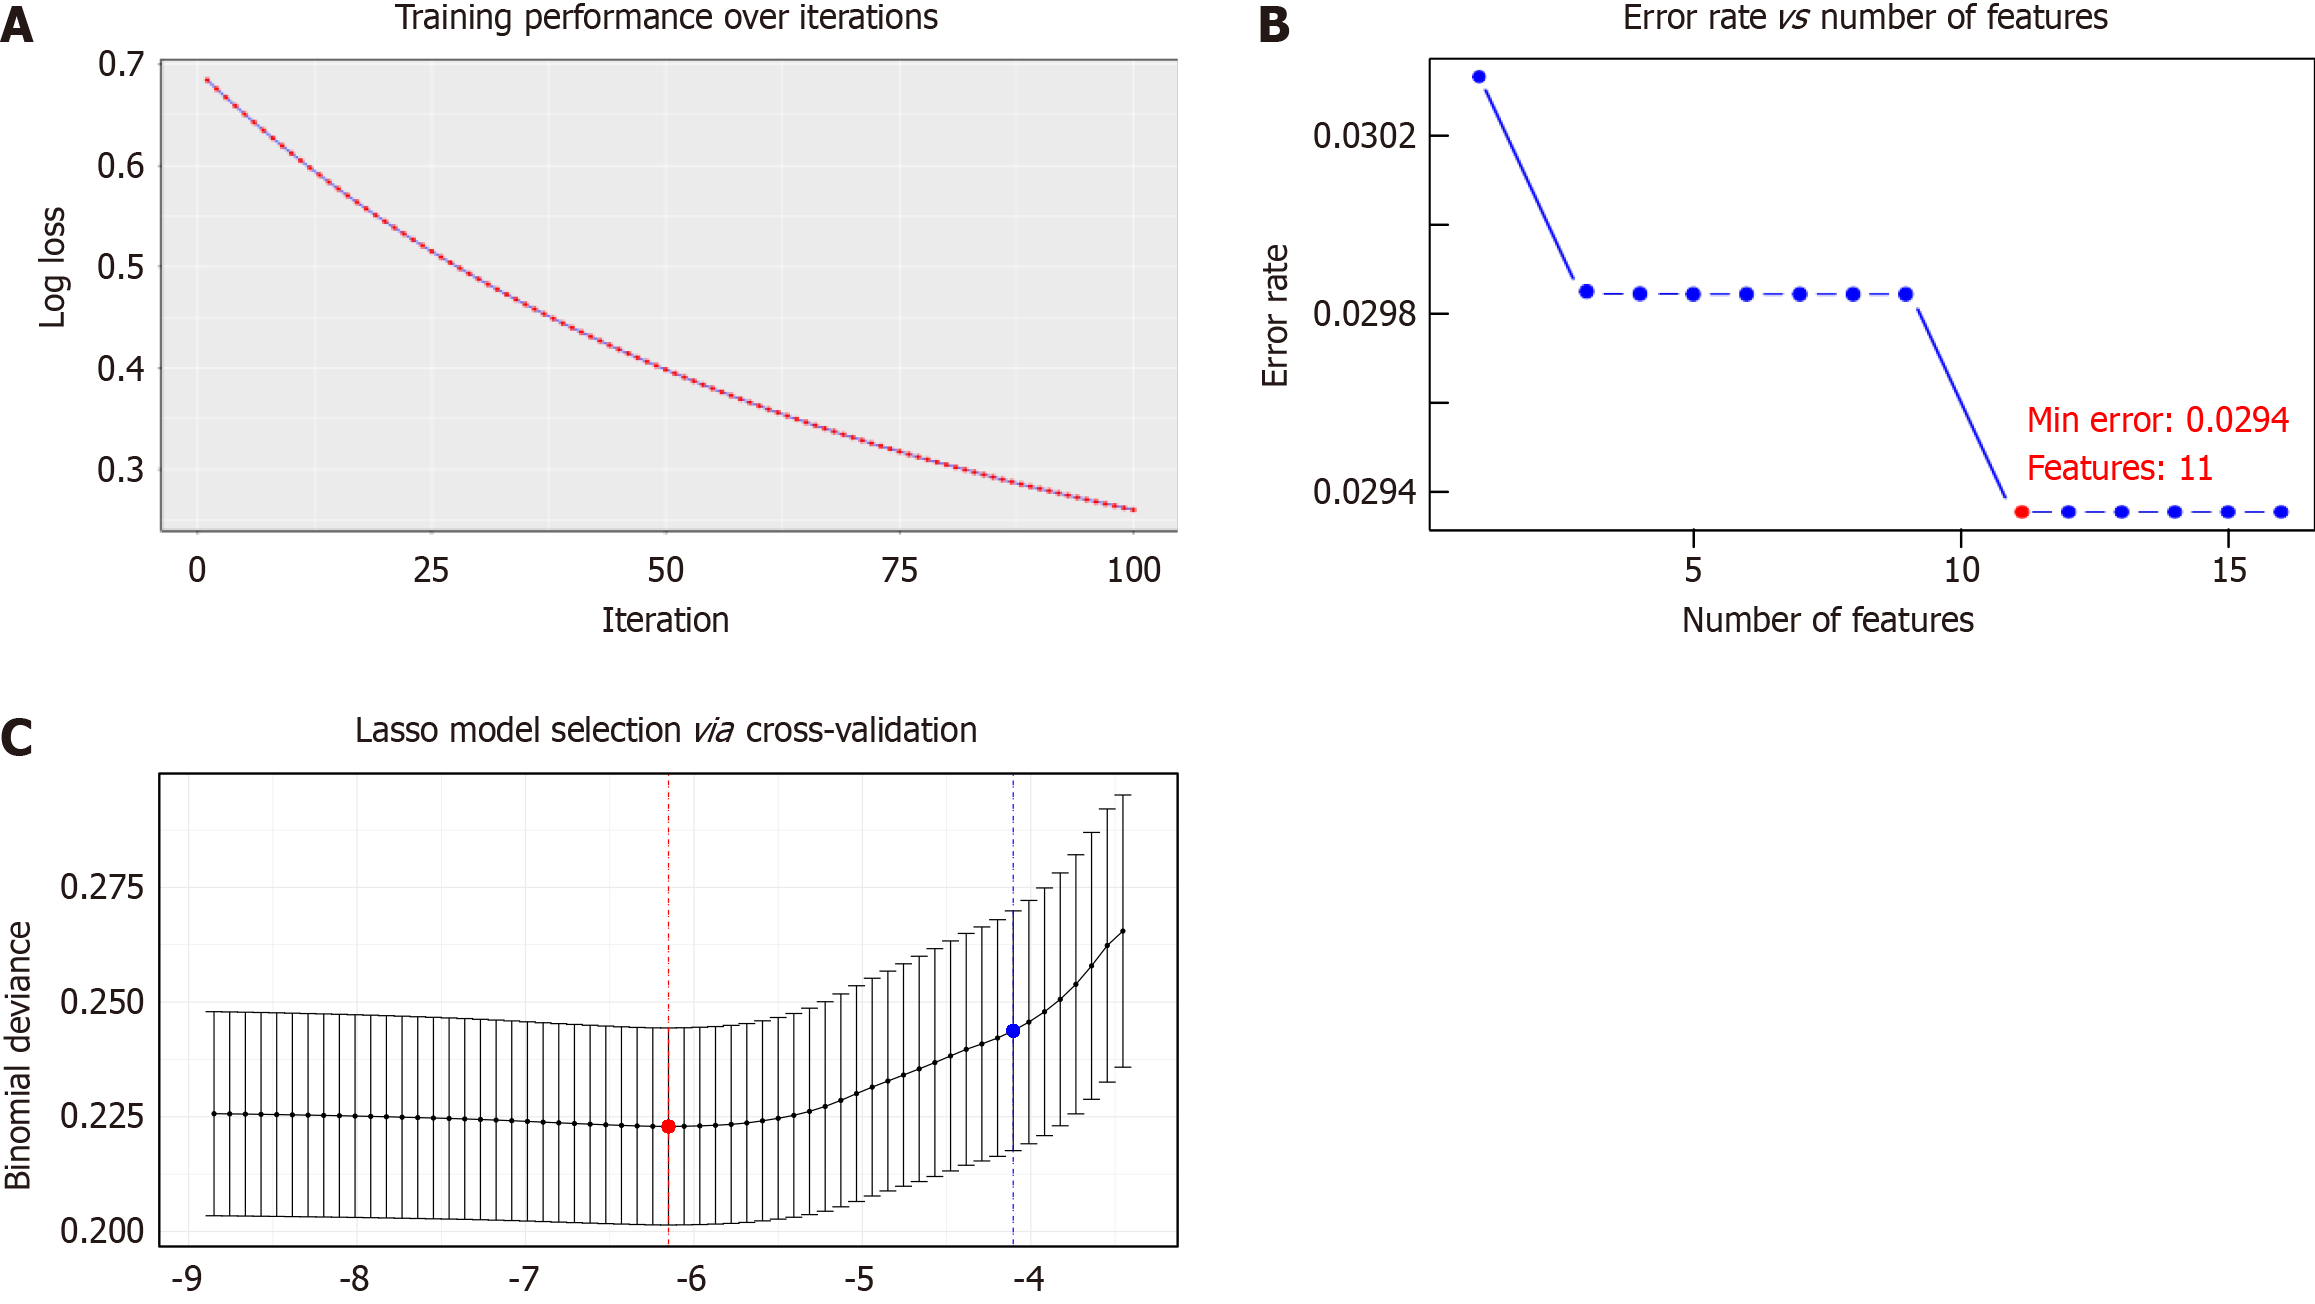
Figure 2 Comparative analysis of model performance and complexity across feature selection and regularization techniques.
A: Training performance vs model complexity; B: Error rate vs number of features; C: Lasso model selection via cross-validation.
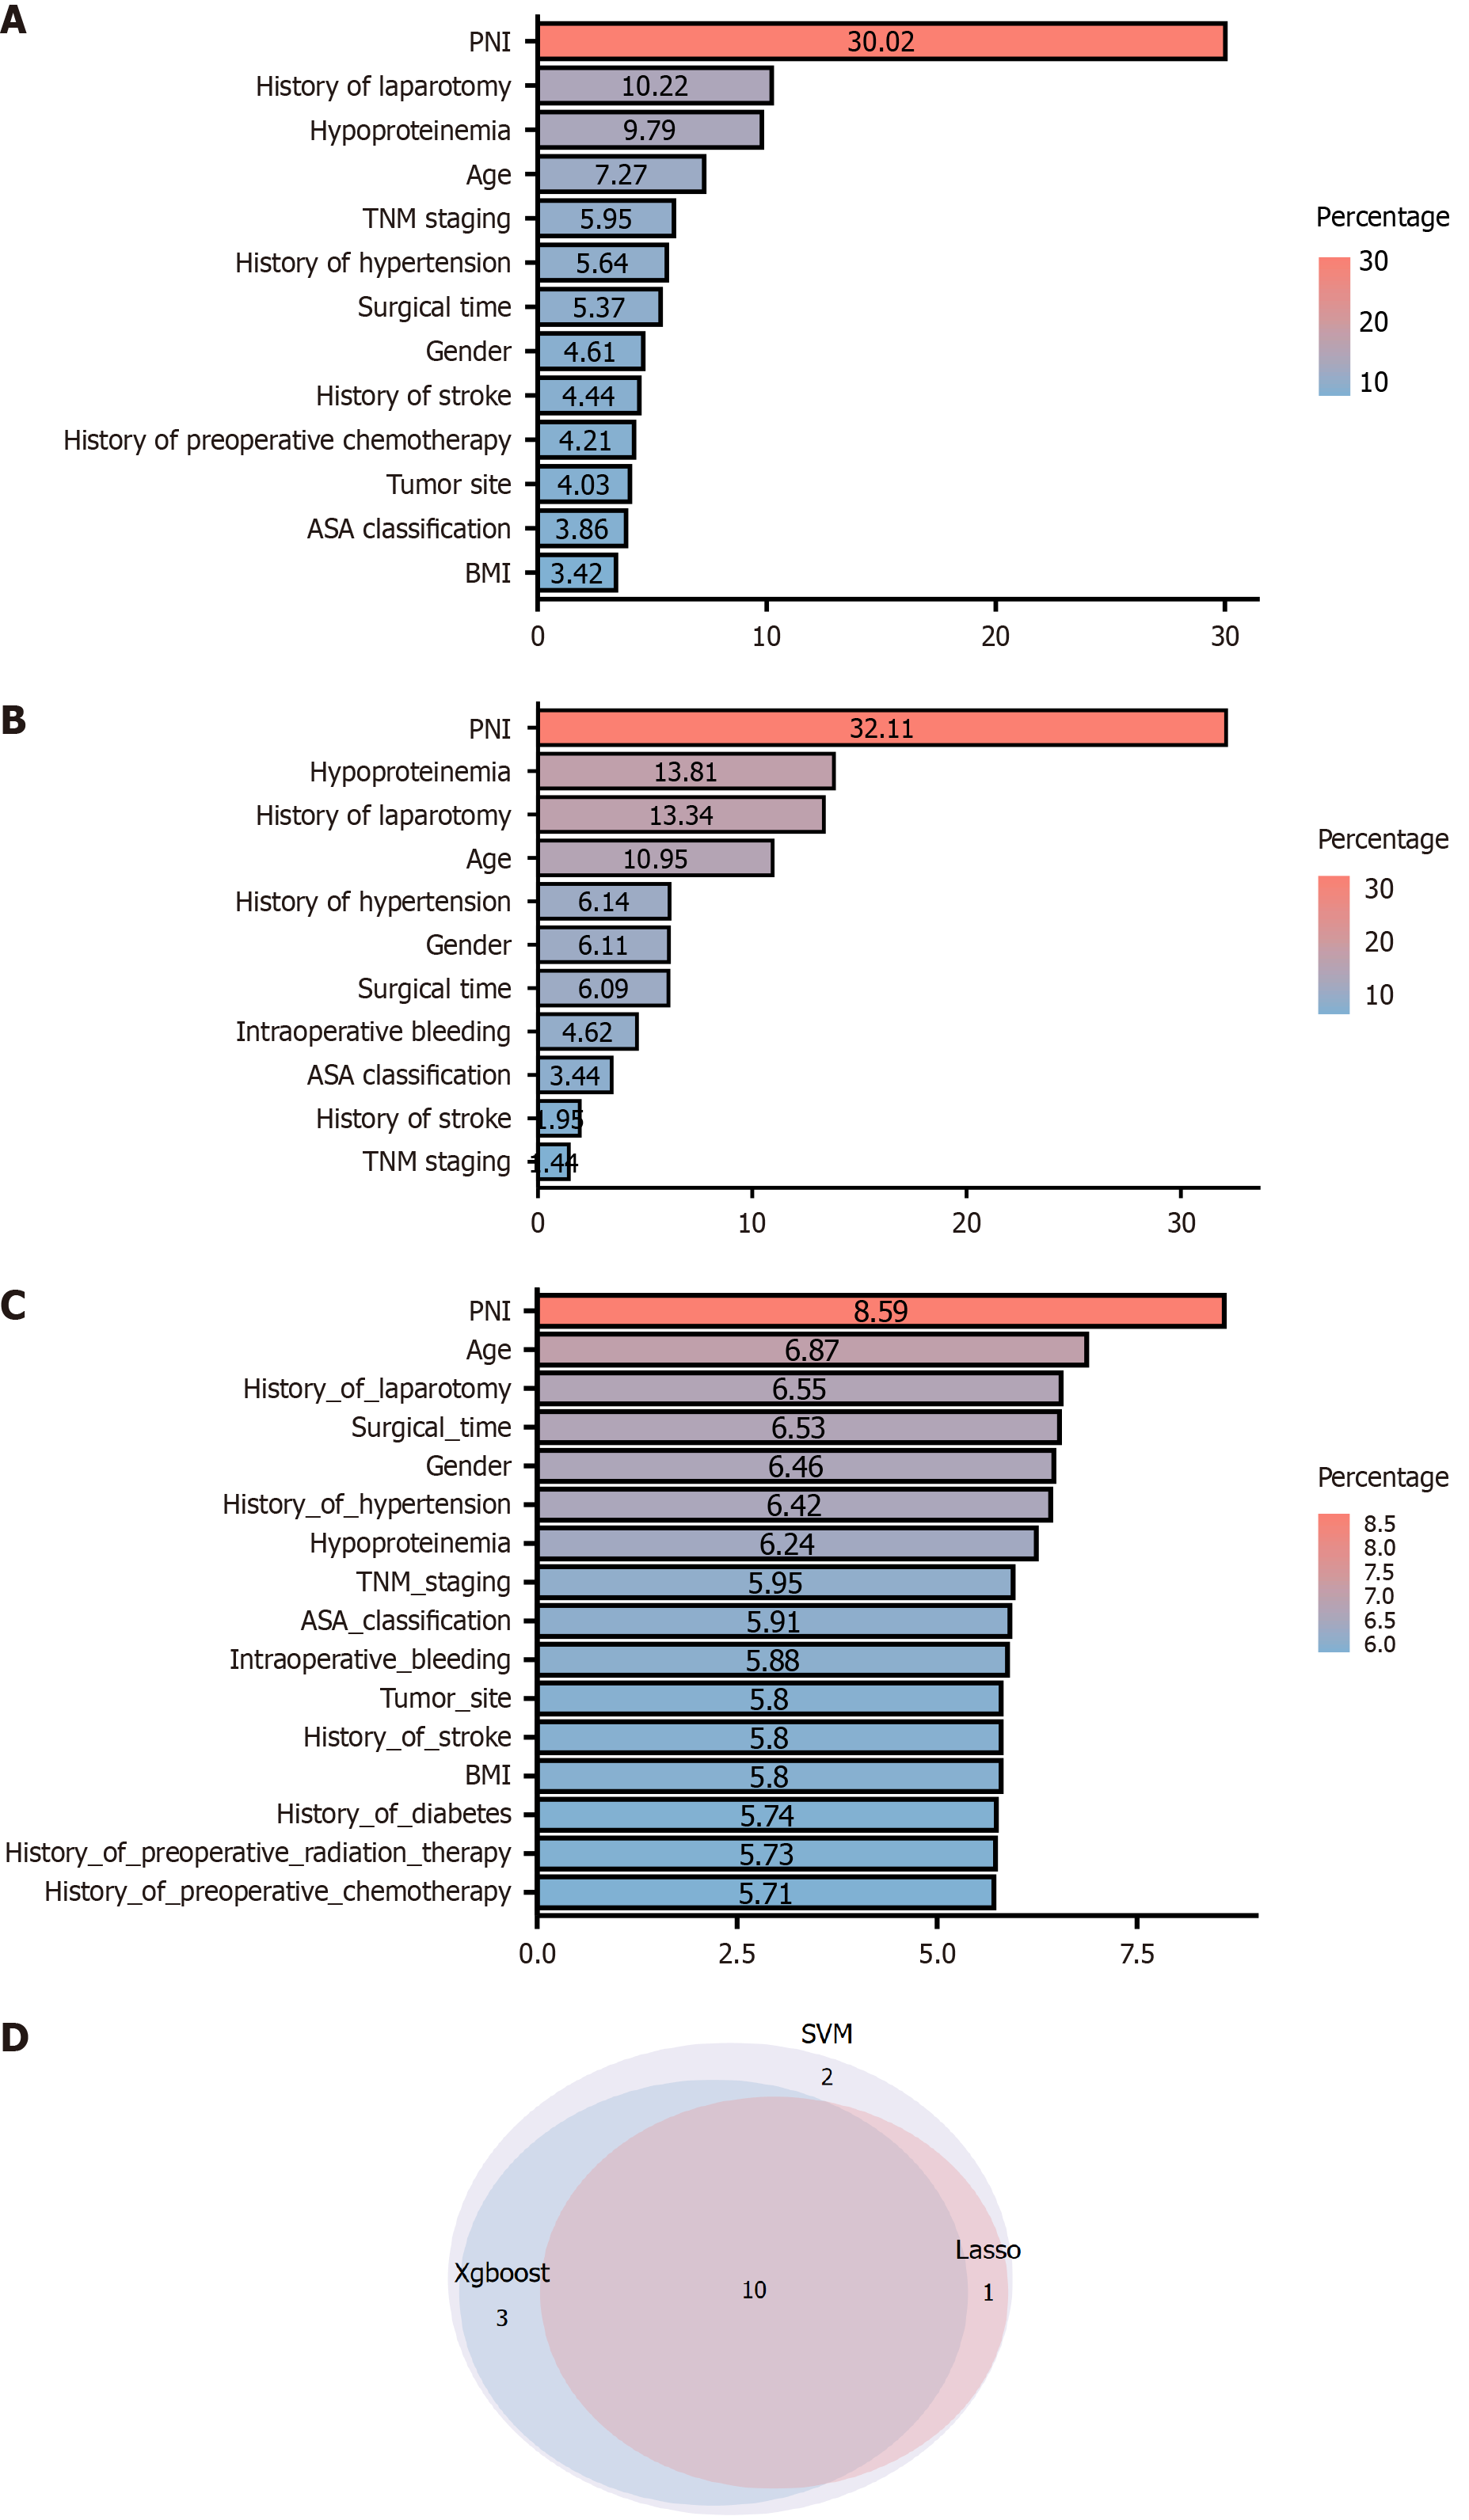
Figure 3 Signature variables of unplanned reoperation screened by machine learning.
A: Extreme gradient boosting filtered unplanned reoperation feature variable; B: Supported vector machine filtered unplanned reoperation feature variable; C: Lasso filtered unplanned reoperation feature variable; D: Feature variables common to all three learning models Venn plot. TNM: Tumor-node-metastasis; BMI: Body mass index; ASA: American Society of Anesthesiologists; PNI: Prognostic nutritional index; SVM: Supported vector machine.
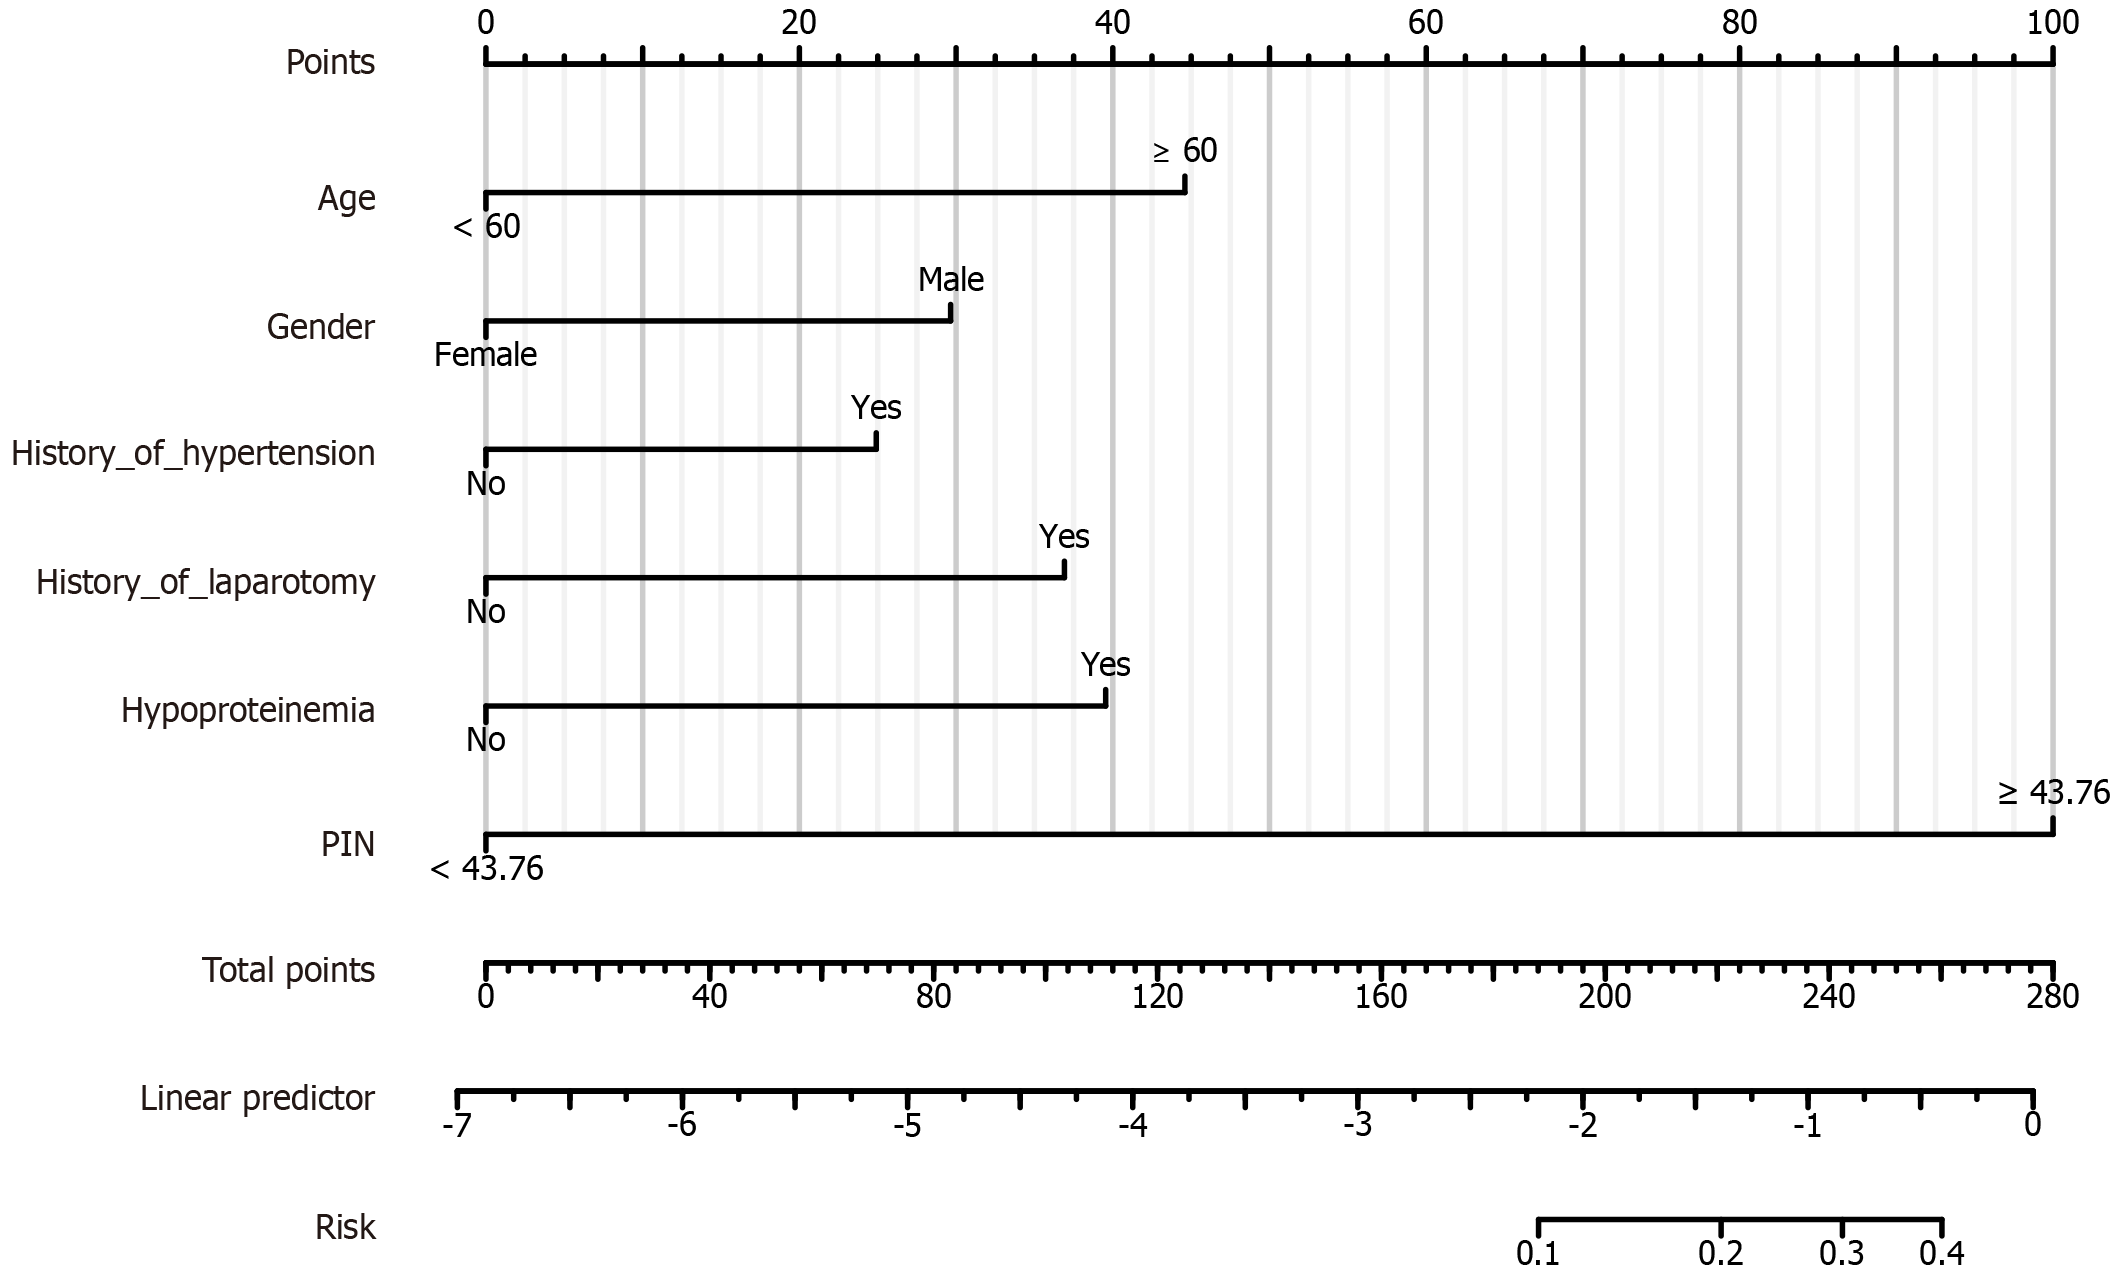
Figure 4 Nomogram of postoperative unplanned reoperation in colorectal cancer.
PNI: Prognostic nutritional index.
Figure 5 Evaluation and validation of nomogram.
A: Receiver operating characteristic curve of postoperative unplanned reoperation in colorectal cancer; B: Calibration curve of postoperative unplanned reoperation in colorectal cancer; C: Decision curve analysis curve of postoperative unplanned reoperation in colorectal cancer.
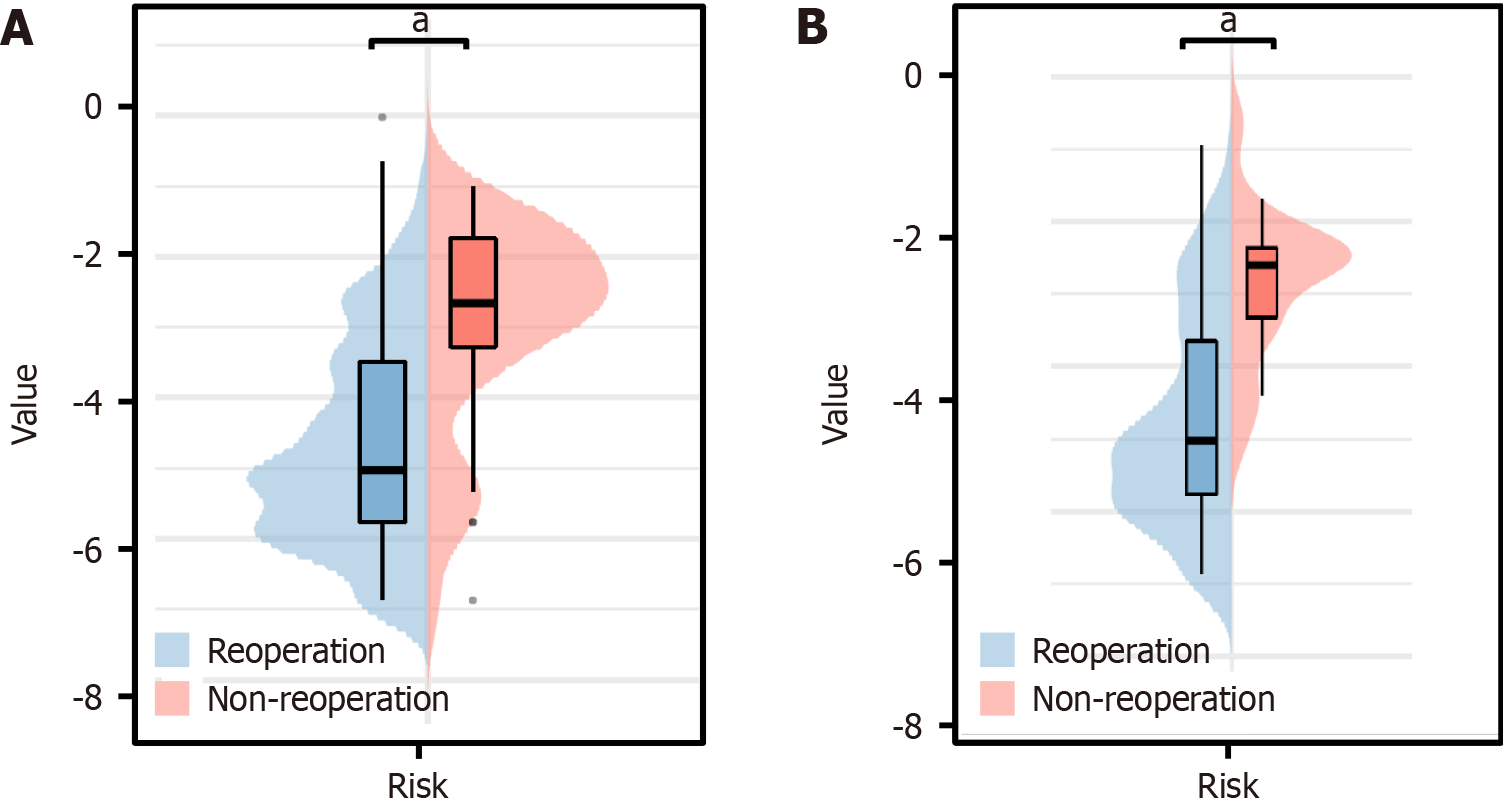
Figure 6 Calculation of risk score for training group and validation group patients.
A: Calculation of patient risk score for training group; B: Calculation of patient risk score for validation group. aP < 0.001.
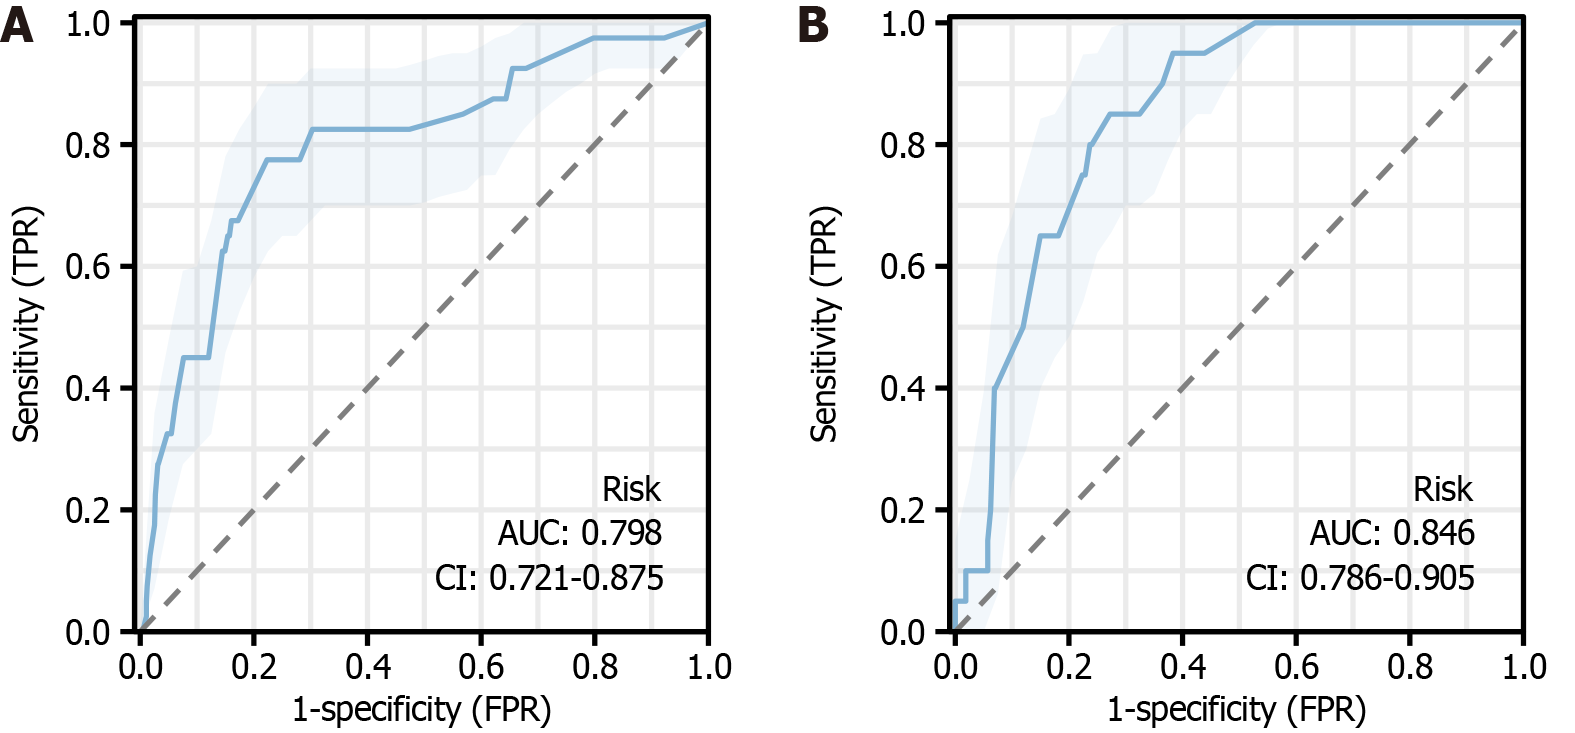
Figure 7 Receiver operating characteristic curve of training group and validation group patient risk scores in predicting patient reoperation.
A and B: Receiver operating characteristic curve of risk score in predicting patient reoperation for (A) training group patients and (B) validation group patients.
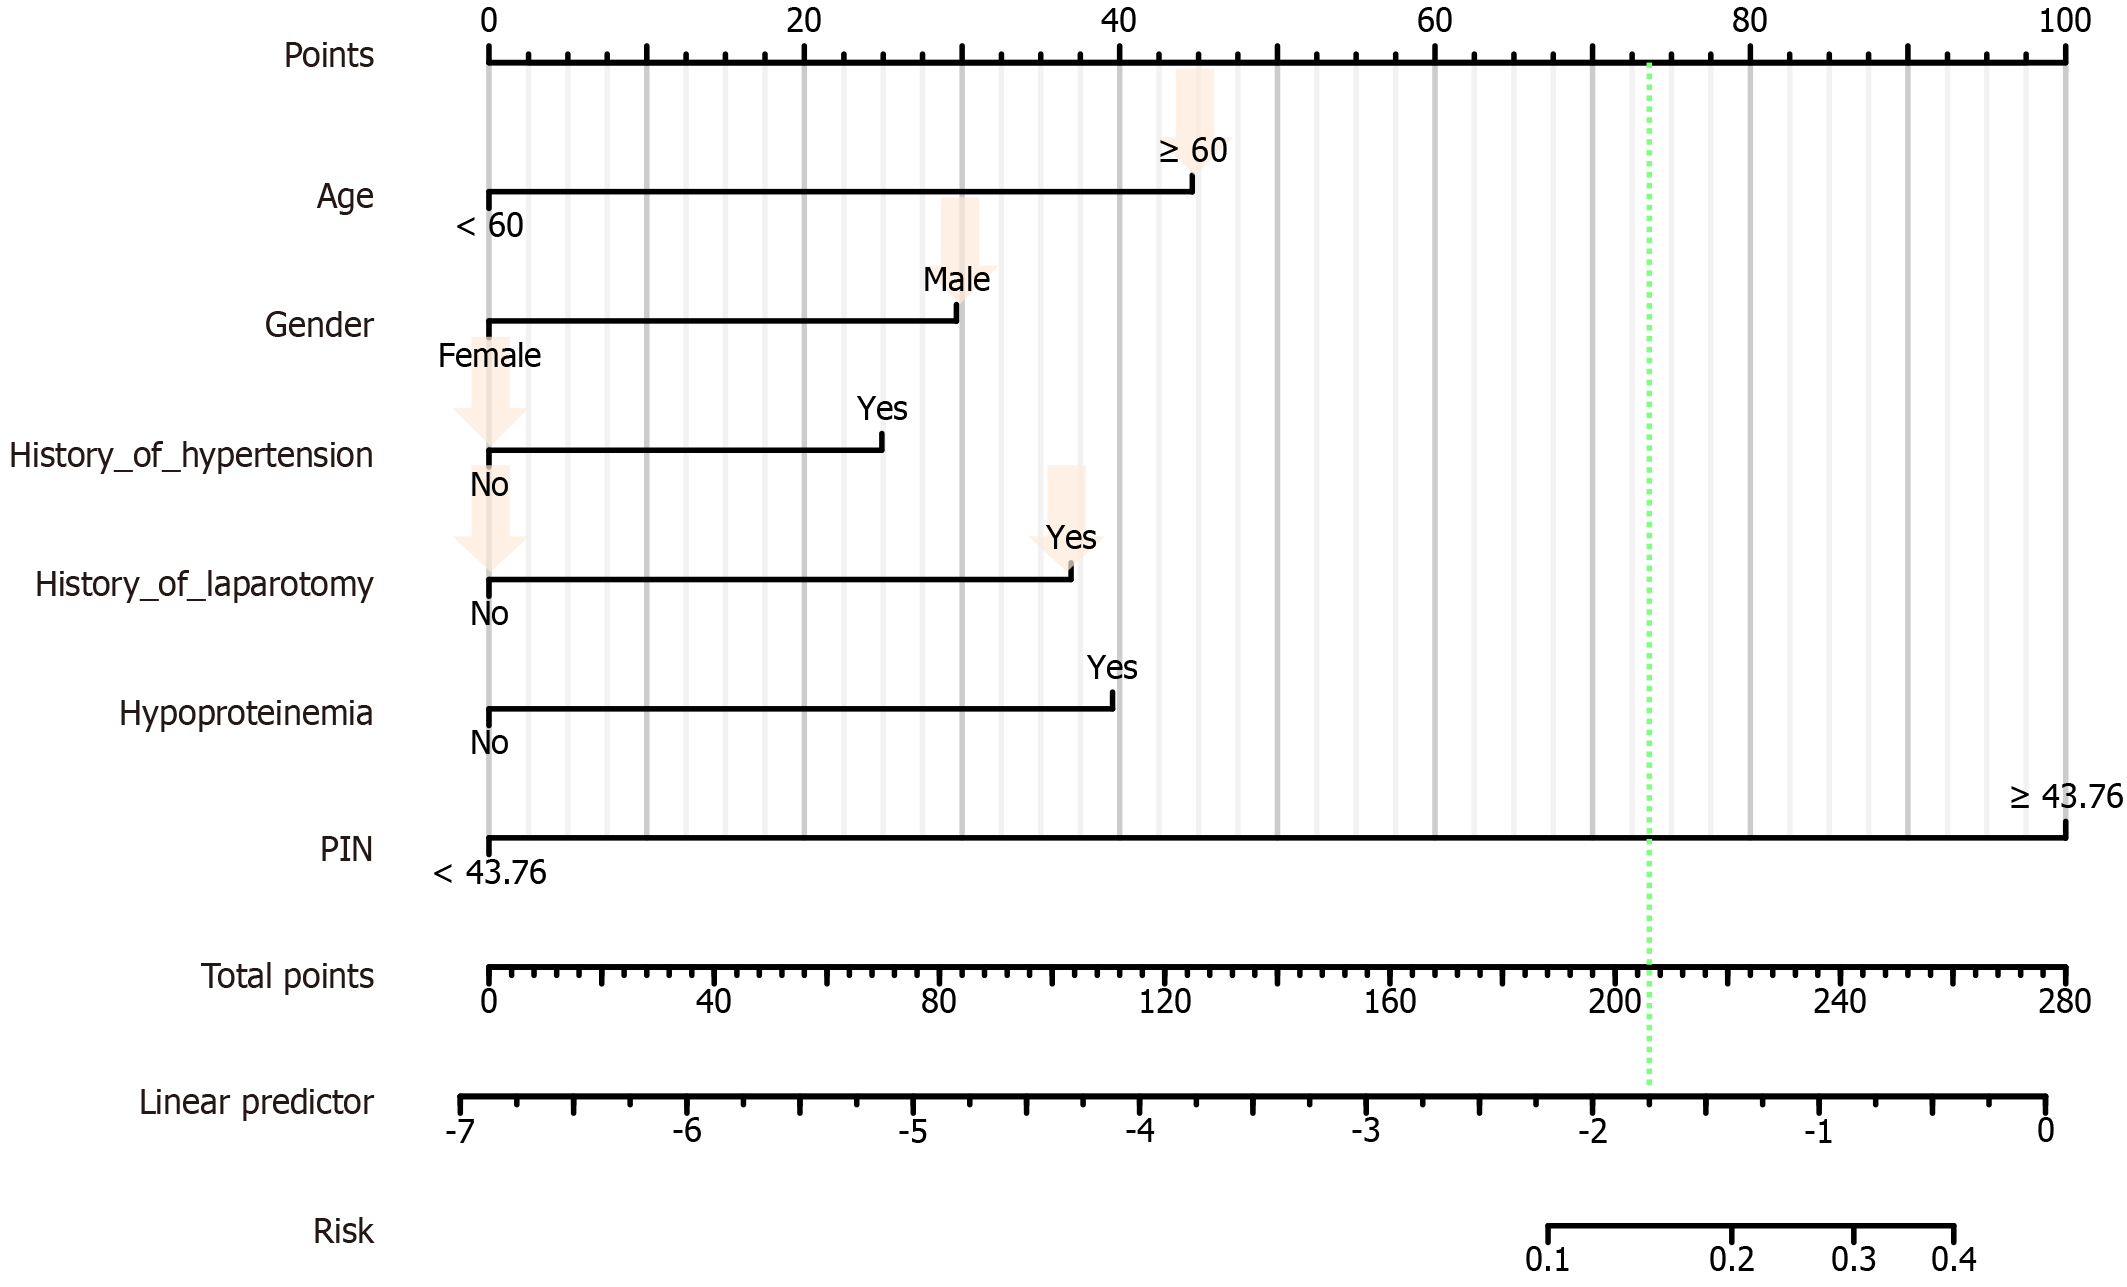
Figure 8 Clinical validation of predictive modeling.
The green dashed line is the patient total score and incidence probability marker, and the light orange arrow is the patient risk factor marker. PNI: Prognostic nutritional index.
- Citation: Cai LQ, Yang DQ, Wang RJ, Huang H, Shi YX. Establishing and clinically validating a machine learning model for predicting unplanned reoperation risk in colorectal cancer. World J Gastroenterol 2024; 30(23): 2991-3004
- URL: https://www.wjgnet.com/1007-9327/full/v30/i23/2991.htm
- DOI: https://dx.doi.org/10.3748/wjg.v30.i23.2991


