Copyright
©The Author(s) 2024.
World J Gastroenterol. Jun 14, 2024; 30(22): 2881-2892
Published online Jun 14, 2024. doi: 10.3748/wjg.v30.i22.2881
Published online Jun 14, 2024. doi: 10.3748/wjg.v30.i22.2881
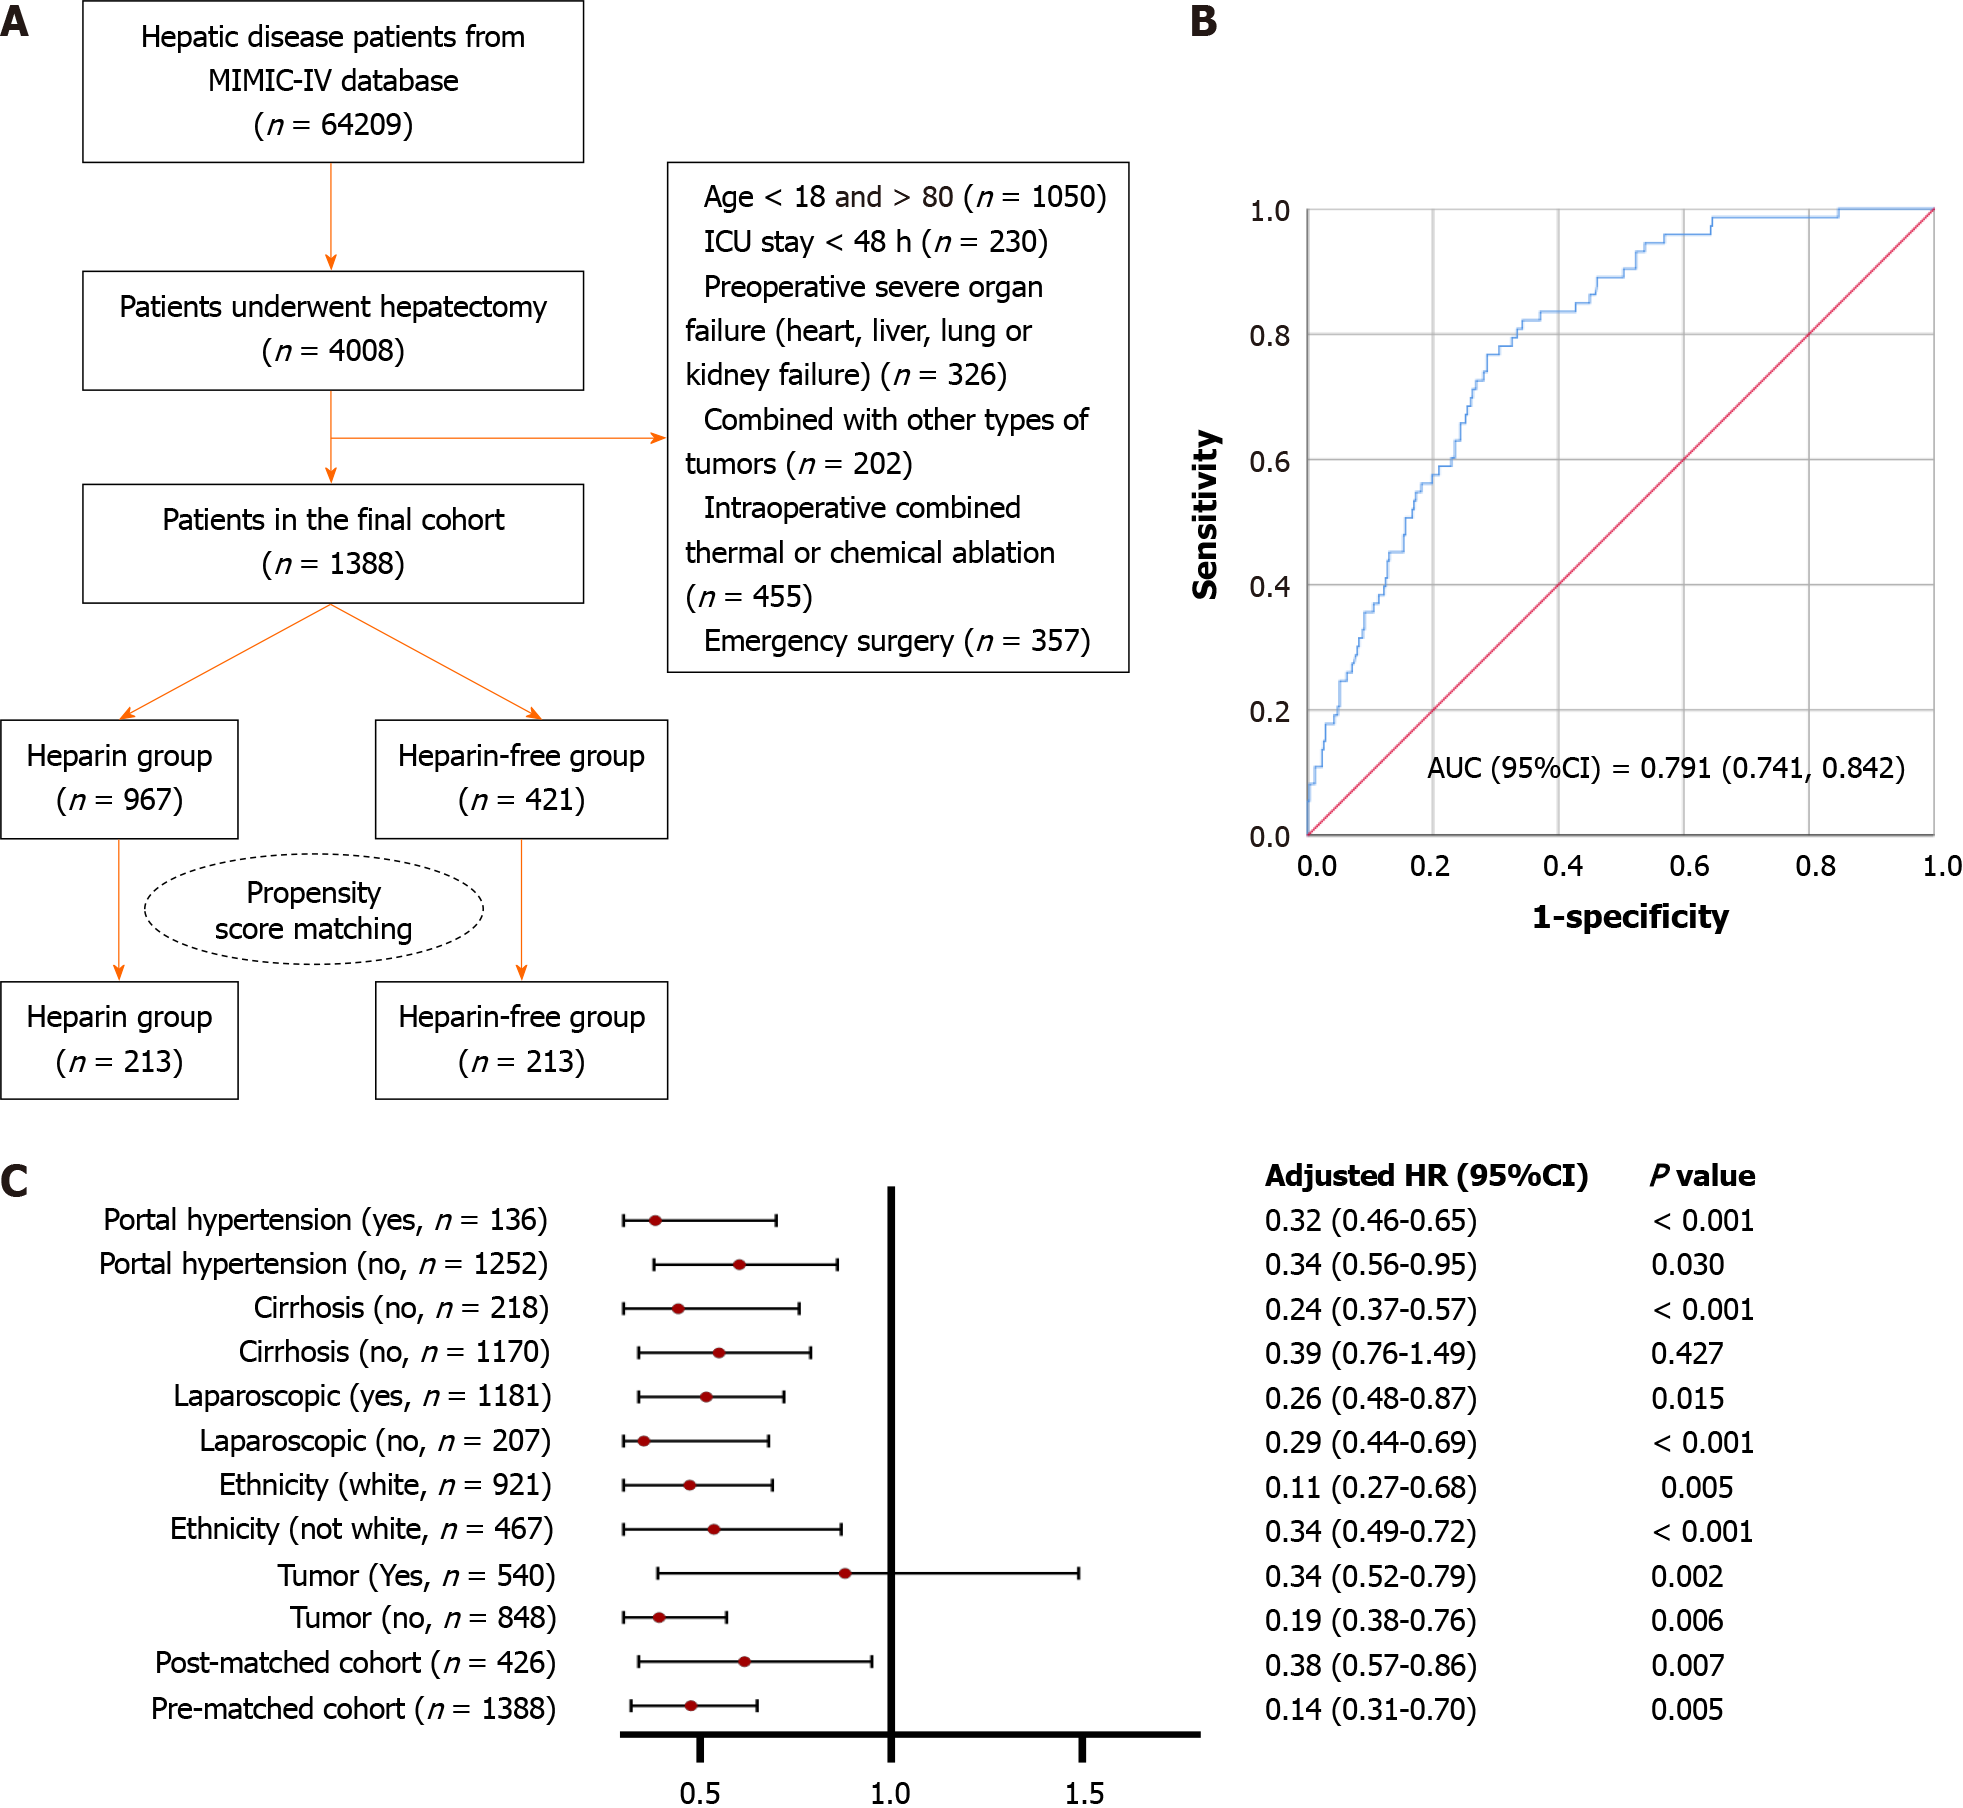
Figure 1 Study pipeline, prediction model performance, and effect of heparin on post-hepatectomy liver failure.
A: Study pipeline showing the selection of hepatic disease patients from the Multiparameter Intelligent Monitoring in Intensive Care III database, criteria for inclusion and exclusion, and the final cohort of patients who underwent hepatectomy. Propensity score matching was used to balance the heparin and heparin-free groups; B: Receiver operating characteristic curve showing the performance of the prediction model; C: Forest plot illustrating the effect of heparin on various clinical outcomes in the post-hepatectomy liver failure cohort. MIMIC: Multiparameter Intelligent Monitoring in Intensive Care; ICU: Intensive care unit; HR: Hazard ratio; 95%CI: 95% confidence interval; AUC: Area under the curve.
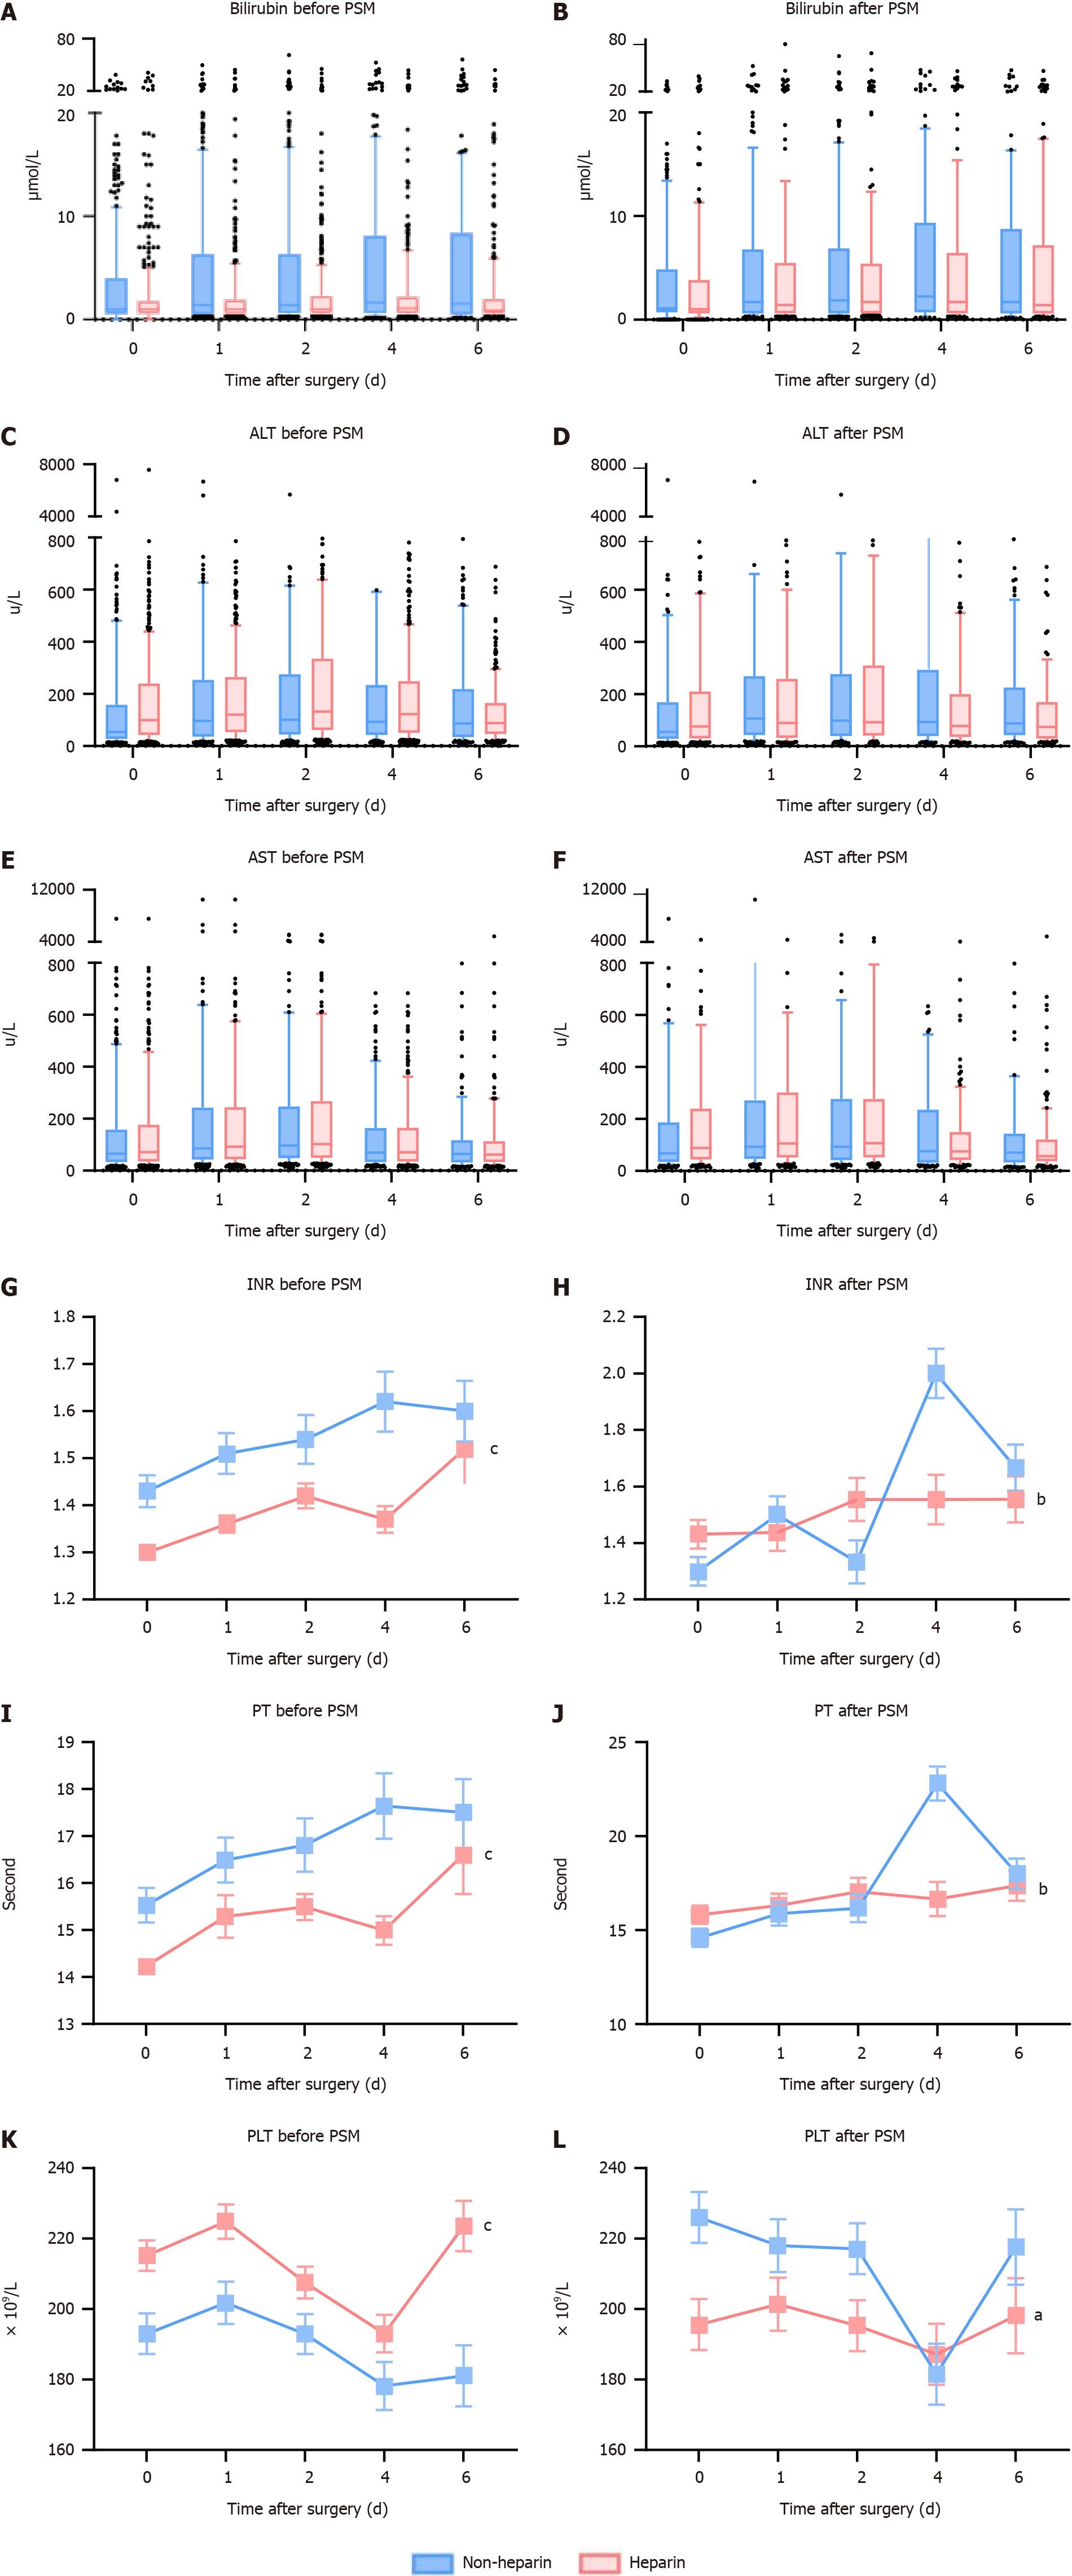
Figure 2 Baseline and postoperative liver function and coagulation results before and after propensity score matching.
A: Baseline total bilirubin levels in the heparin and non-heparin groups before propensity score matching (PSM); B: Baseline total bilirubin levels in the heparin and non-heparin groups after PSM; C: Baseline alanine transaminase (ALT) levels in the heparin and non-heparin groups before PSM; D: Baseline ALT levels in the heparin and non-heparin groups after PSM; E: Baseline aspartate transaminase (AST) levels in the heparin and non-heparin groups before PSM; F: Baseline AST levels in the heparin and non-heparin groups after PSM; G: Baseline international normalized ratio (INR) values in the heparin and non-heparin groups before PSM; H: Baseline INR values in the heparin and non-heparin groups after PSM; I: Baseline platelets (PLT) levels in the heparin and non-heparin groups before PSM; J: Baseline PLT levels in the heparin and non-heparin groups after PSM; K: Baseline prothrombin time (PT) levels in the heparin and non-heparin groups before PSM; L: Baseline PT levels in the heparin and non-heparin groups after PSM. aP < 0.05; bP < 0.01; cP < 0.001. PSM: Propensity score matching; AST: Aspartate transaminase; ALT: Alanine transaminase; INR: International normalized ratio; PLT: Platelets; PT: Prothrombin time.
- Citation: Xu ZY, Peng M, Fan MM, Zou QF, Li YR, Jiang D. Heparin is an effective treatment for preventing liver failure after hepatectomy. World J Gastroenterol 2024; 30(22): 2881-2892
- URL: https://www.wjgnet.com/1007-9327/full/v30/i22/2881.htm
- DOI: https://dx.doi.org/10.3748/wjg.v30.i22.2881


