Copyright
©The Author(s) 2024.
World J Gastroenterol. Jun 7, 2024; 30(21): 2817-2826
Published online Jun 7, 2024. doi: 10.3748/wjg.v30.i21.2817
Published online Jun 7, 2024. doi: 10.3748/wjg.v30.i21.2817
Figure 1 Experimental workflow of the preclinical models used in this study.
Wild-type or adenomatous polyposis colimultiple intestinal neoplasia/+ mice were chronically infected with the 11G5 CoPEC strain (109 bacteria per mouse) at D0 after pre-streptomycin treatment (from D-4 to D-1). Colonic low-grade inflammation was measured at D7 and D15. Elevated plus maze, Phenotyper and forced swimming test were performed at D15, D20 and D35 respectively. SPF: Specific pathogen free; CoPEC: Colibactin-producing Escherichia coli; EPM: Elevated plus maze; FST: Forced Swimming Test (Created with BioRender.com, Supplementary material).
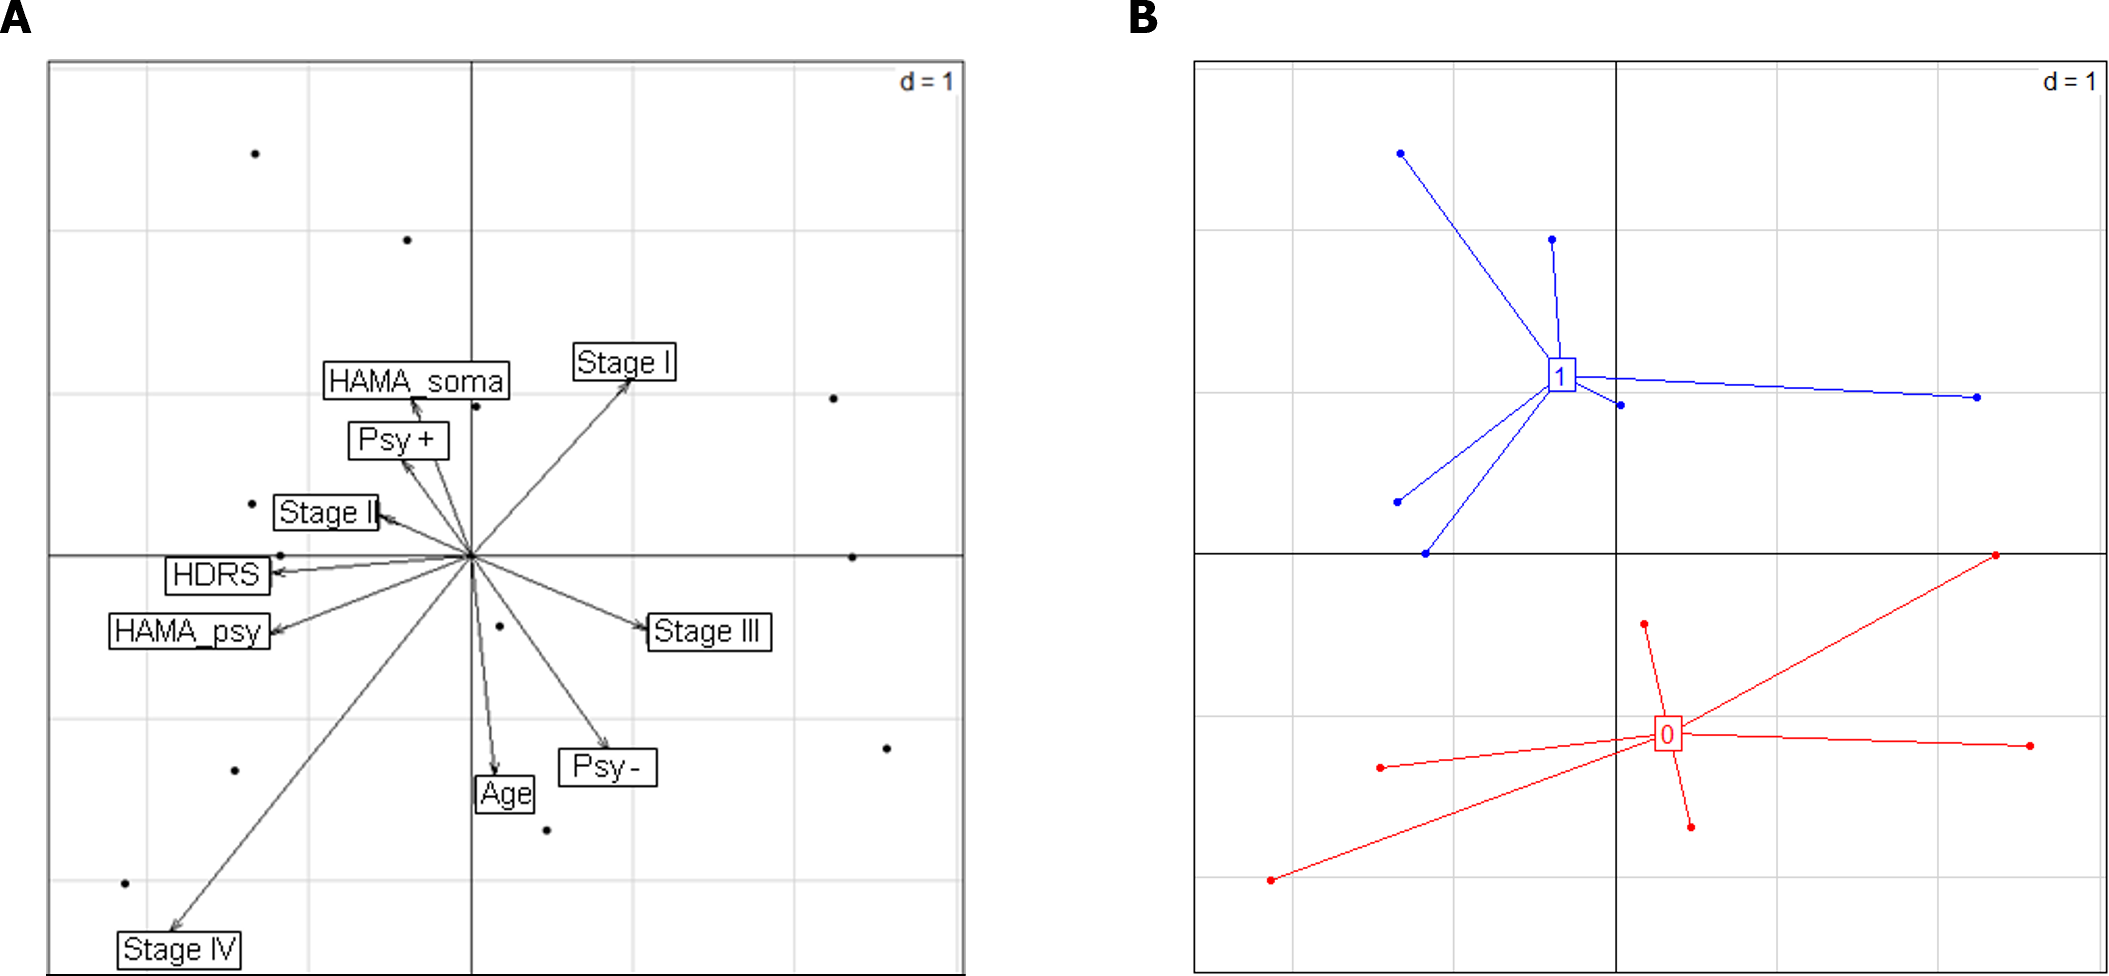
Figure 2 Clinical data of colon cancer patients stratified according to the presence of colibactin-producing Escherichia coli.
A: The correlation circles obtained via factor analysis of the mixed data show the correlations between the variables. The shorter vectors represent variables with weak correlations and less contribution to the axis; B: Patient representation (one point for each patient) reveals two different patient profiles according to the presence of colibactin-producing Escherichia coli (CoPEC) in the digestive tract and variables associated with the profiles. Patients with CoPEC are presented in blue, while patients without CoPEC are presented in red. The variables associated with the presence of CoPEC were past psychiatric disorders and higher Hamilton Anxiety Rating Scale (HAMA) somatic scores. Age: Age of patient; HAMA_psy: Hamilton psychologic anxiety score; HAMA_soma: Hamilton somatic anxiety score; HDRS: Hamilton Depression Rating Scale; Psy-: No past psychiatric disorder; Psy+: Past psychiatric disorder; Stage: TNM stage of tumor.
Figure 3 Chronic colibactin-producing Escherichia coli infection is associated with the induction of microinflammation.
A: Colonization of wild-type (WT) infected mice (n = 12) in the gastrointestinal tract followed by counting the fecal colony form units of colibactin-producing Escherichia coli (11G5 strain) at different time points. B and C: Colonic low-grade inflammation was assessed by measuring fecal lipocalin-2 levels at the peak of infection (7 DPI) and 15 DPI [WT control, n = 11 (stools could not be collected or analyzed for one mouse); WT infected mice, n = 12]. The white circles represent WT control mice, while the black circles represent WT infected mice. Statistical analysis: Student’s t test: aP < 0.05. CFU: Colony form unit.
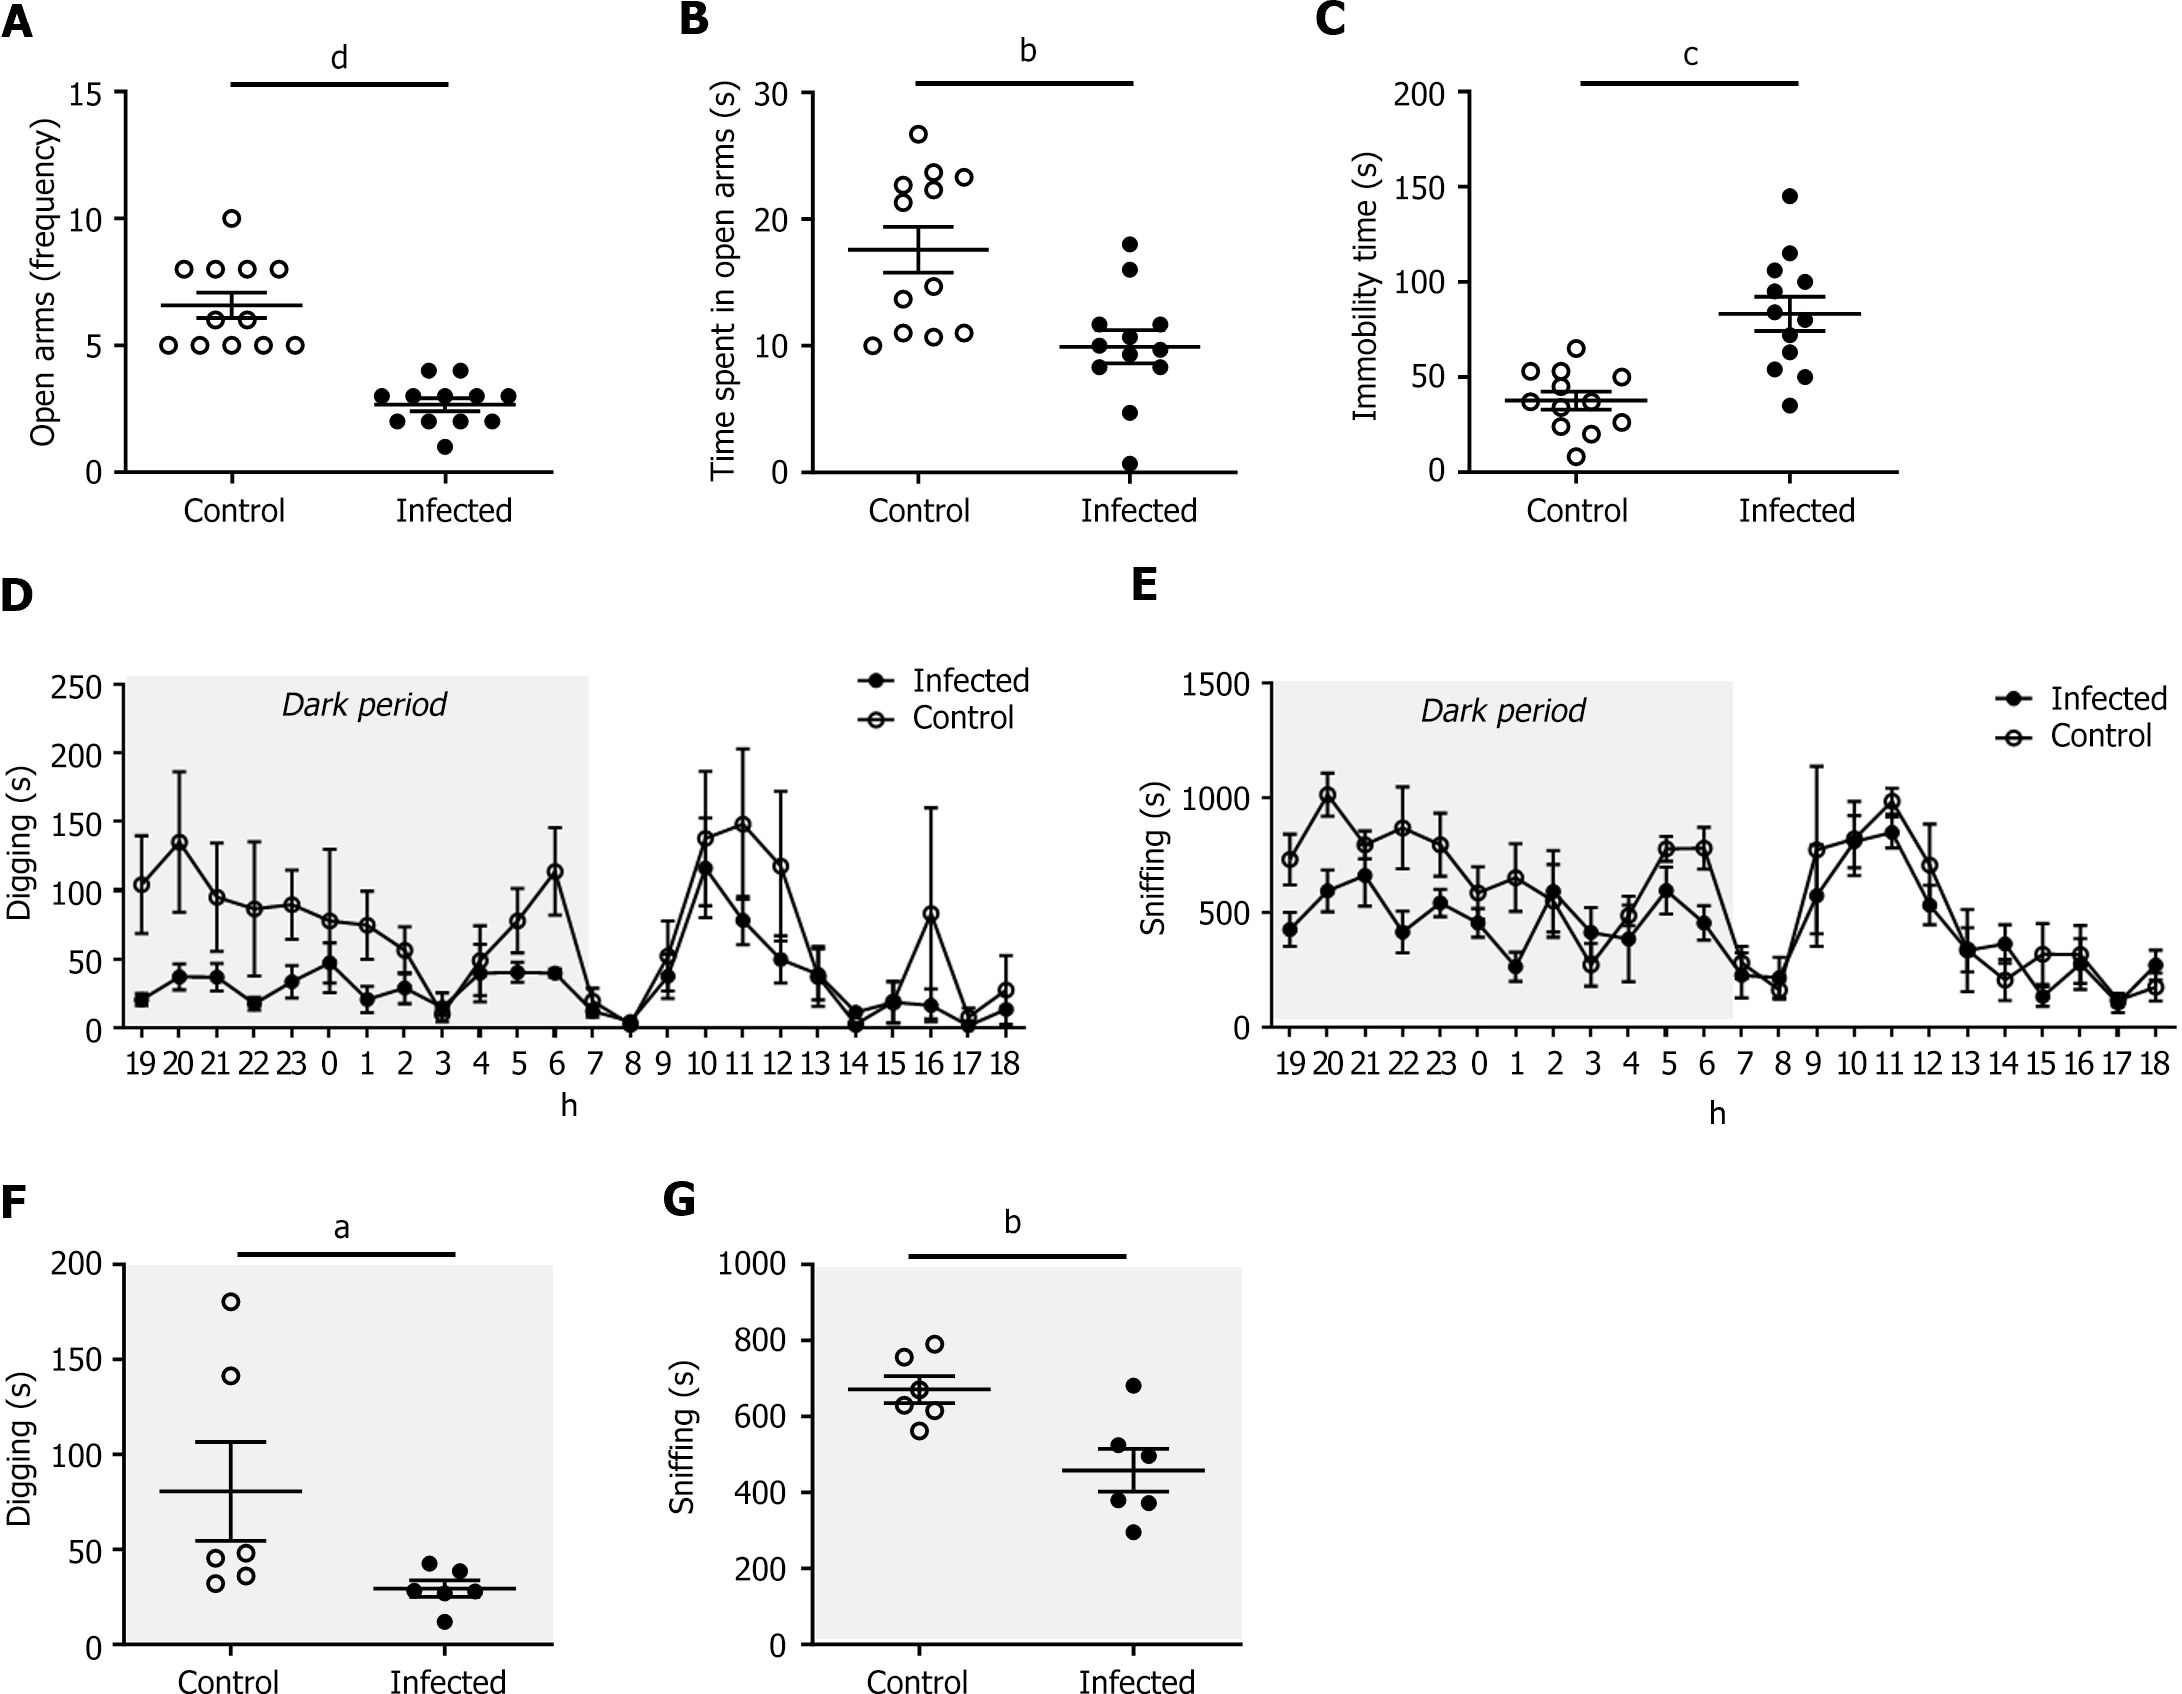
Figure 4 Anxiety- and depressive-like behaviors in wild-type mice chronically infected with colibactin-producing Escherichia coli.
A and B: Anxiety-like behavior assessed using the elevated plus maze test at 14 DPI; A: Entry frequency and B: time spent in the open arms of wild-type (WT) control and infected mice (n = 12 per group); C: Immobility time during the forced swimming test of WT control and infected mice (n = 12 per group) at 35 DPI; D-F: WT control and infected (n = 6 per group) mice were placed in a PhenoTyper® device at 20 DPI and recorded for 24 h to assess spontaneous behavior in a representative experiment; D and E: Total digging (D) and sniffing times (E) determined over 24 h; F and G: Mean digging (F) and sniffing times (G) measured only during the 12-h dark period. The white circles represent WT control mice, while the black circles represent infected mice. Statistical analysis: Student’s t test: aP < 0.05, bP < 0.01, cP < 0.001, dP < 0.0001.
Figure 5 Chronic colibactin-producing Escherichia coli infection is associated with anxiety-like behaviors in adenomatous polyposis colimultiple intestinal neoplasia/+ mice.
A: Colonization of the gastrointestinal tract in wild-type (WT, n = 12) and adenomatous polyposis coli (Apc)multiple intestinal neoplasia (Min)/+ (n = 5) mice infected with the colibactin-producing Escherichia coli strain (11G5 strain) according to fecal colony form units at different time points; B and C: Anxiety-like behavior was assessed using an elevated plus maze test at 14 DPI. Entry frequency (B) and time spent in the open arms (C) by APCMin/+ control (n = 4) and infected (n = 5) mice; D: Immobility time during the forced swimming test of APCMin/+ control and infected mice at 35 DPI. The black circles represent WT infected mice, the hollow purple circles represent APCMin/+ uninfected mice, and the purple circles represent APCMin/+ infected mice. Statistical analysis: Student’s t test: aP < 0.05, bP < 0.01. CFU: Colony form unit; APC: Adenomatous polyposis coli; Min: Multiple intestinal neoplasia; WT: Wild-type.
- Citation: Rondepierre F, Meynier M, Gagniere J, Deneuvy V, Deneuvy A, Roche G, Baudu E, Pereira B, Bonnet R, Barnich N, Carvalho FA, Pezet D, Bonnet M, Jalenques I. Preclinical and clinical evidence of the association of colibactin-producing Escherichia coli with anxiety and depression in colon cancer. World J Gastroenterol 2024; 30(21): 2817-2826
- URL: https://www.wjgnet.com/1007-9327/full/v30/i21/2817.htm
- DOI: https://dx.doi.org/10.3748/wjg.v30.i21.2817


