Copyright
©The Author(s) 2024.
World J Gastroenterol. Jun 7, 2024; 30(21): 2793-2816
Published online Jun 7, 2024. doi: 10.3748/wjg.v30.i21.2793
Published online Jun 7, 2024. doi: 10.3748/wjg.v30.i21.2793
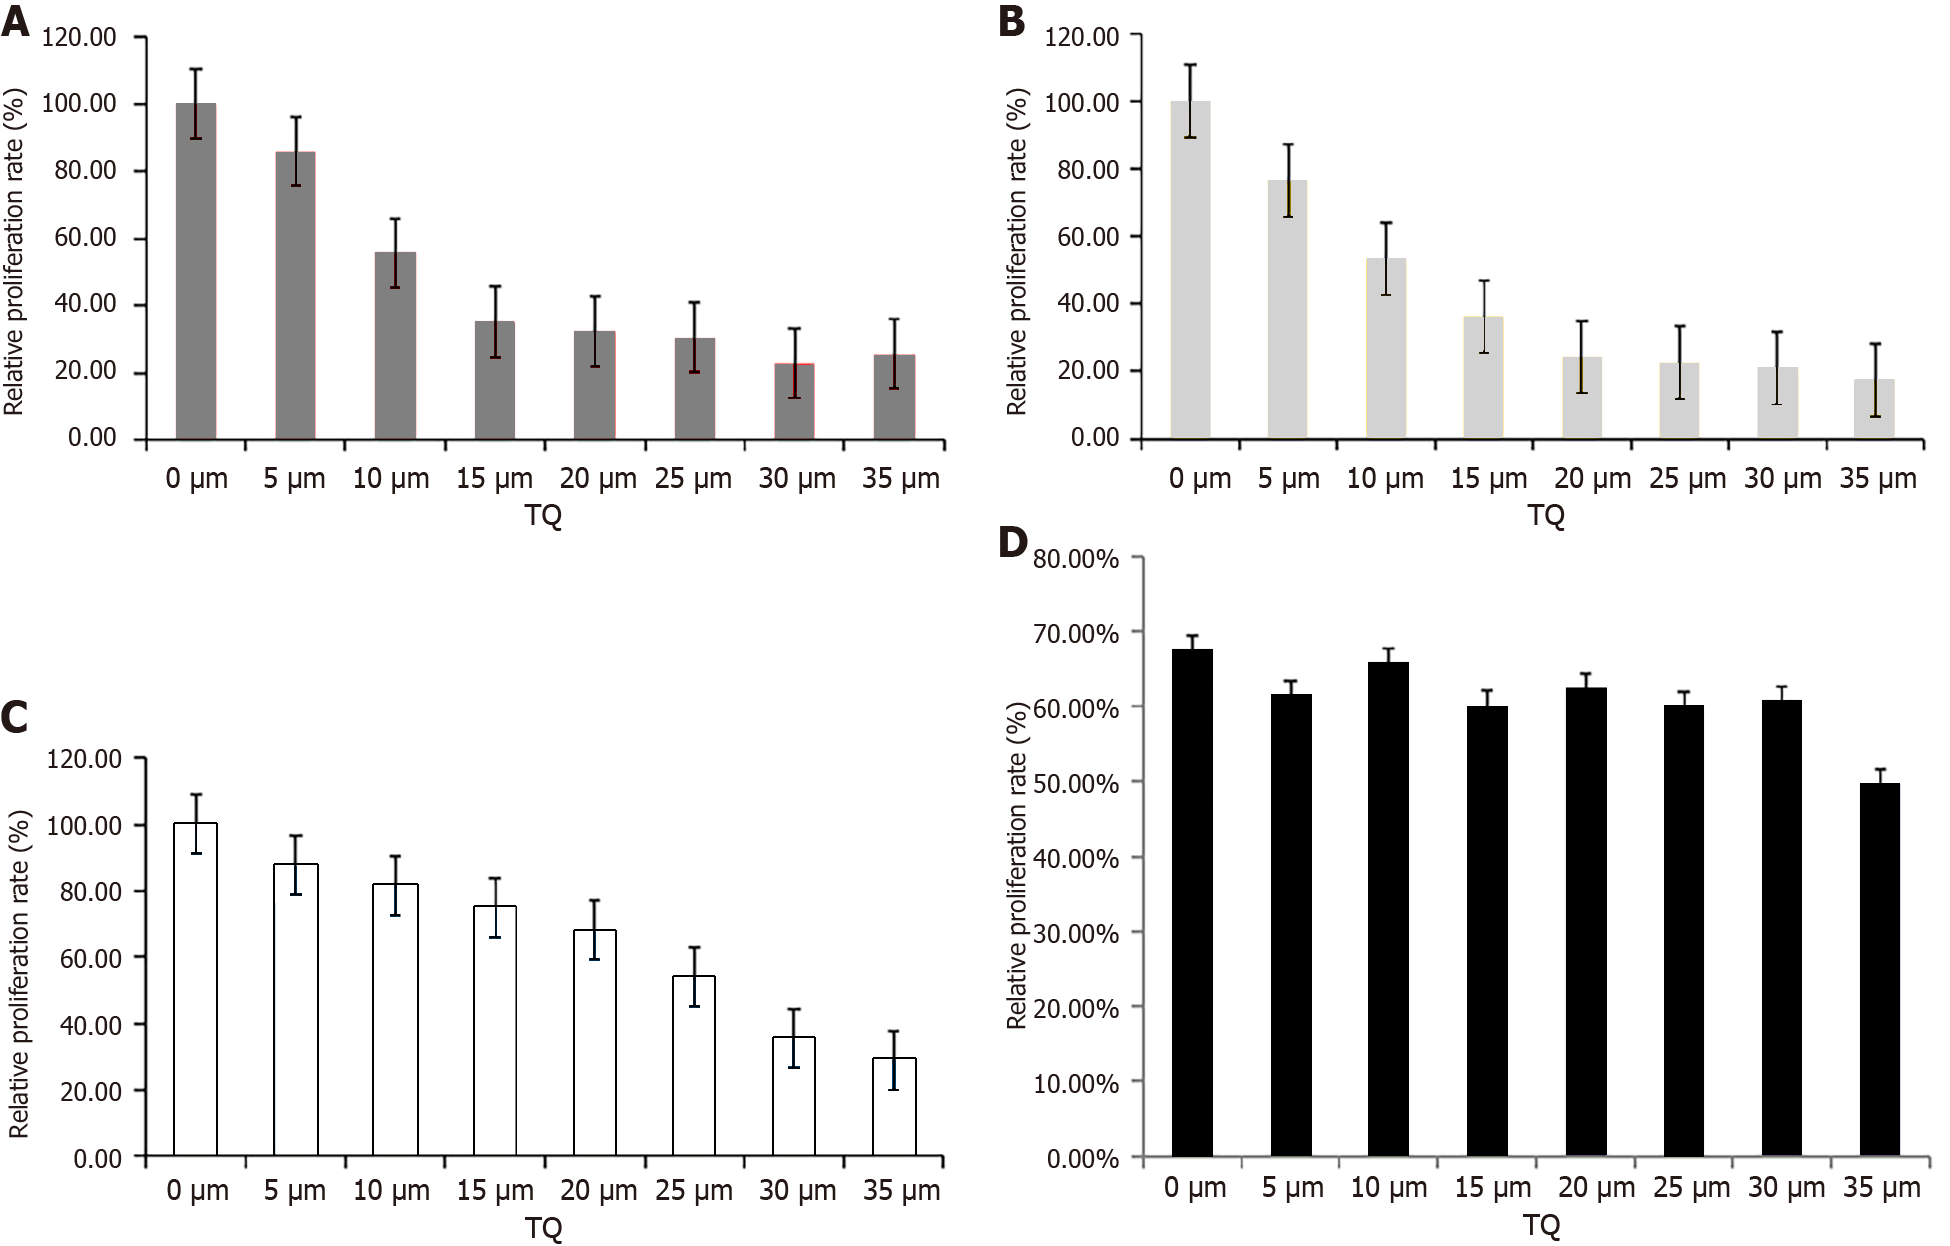
Figure 1 Cell counting kit-8 assay was performed to determine the effects of different concentrations of Thymoquinone on the proliferation rate of pancreatic cancer cells and pancreatic duct epithelial cells under hypoxia condition.
A: Cell counting kit-8 (CCK-8) assay was performed to detect the effects of Thymoquinone (TQ) on the relative proliferation rate of PANC-1 cells under hypoxia condition; B: CCK-8 assay was performed to detect the effects of TQ on the relative proliferation rate of AsPC-1 cells under hypoxia condition; C: CCK-8 assay was performed to detect the effects of TQ on the relative proliferation rate of BxPC-3 cells under hypoxia condition; D: CCK-8 assay was performed to detect the effects of TQ on the relative proliferation rate of normal pancreatic duct epithelial cells under hypoxia condition. TQ: Thymoquinone.
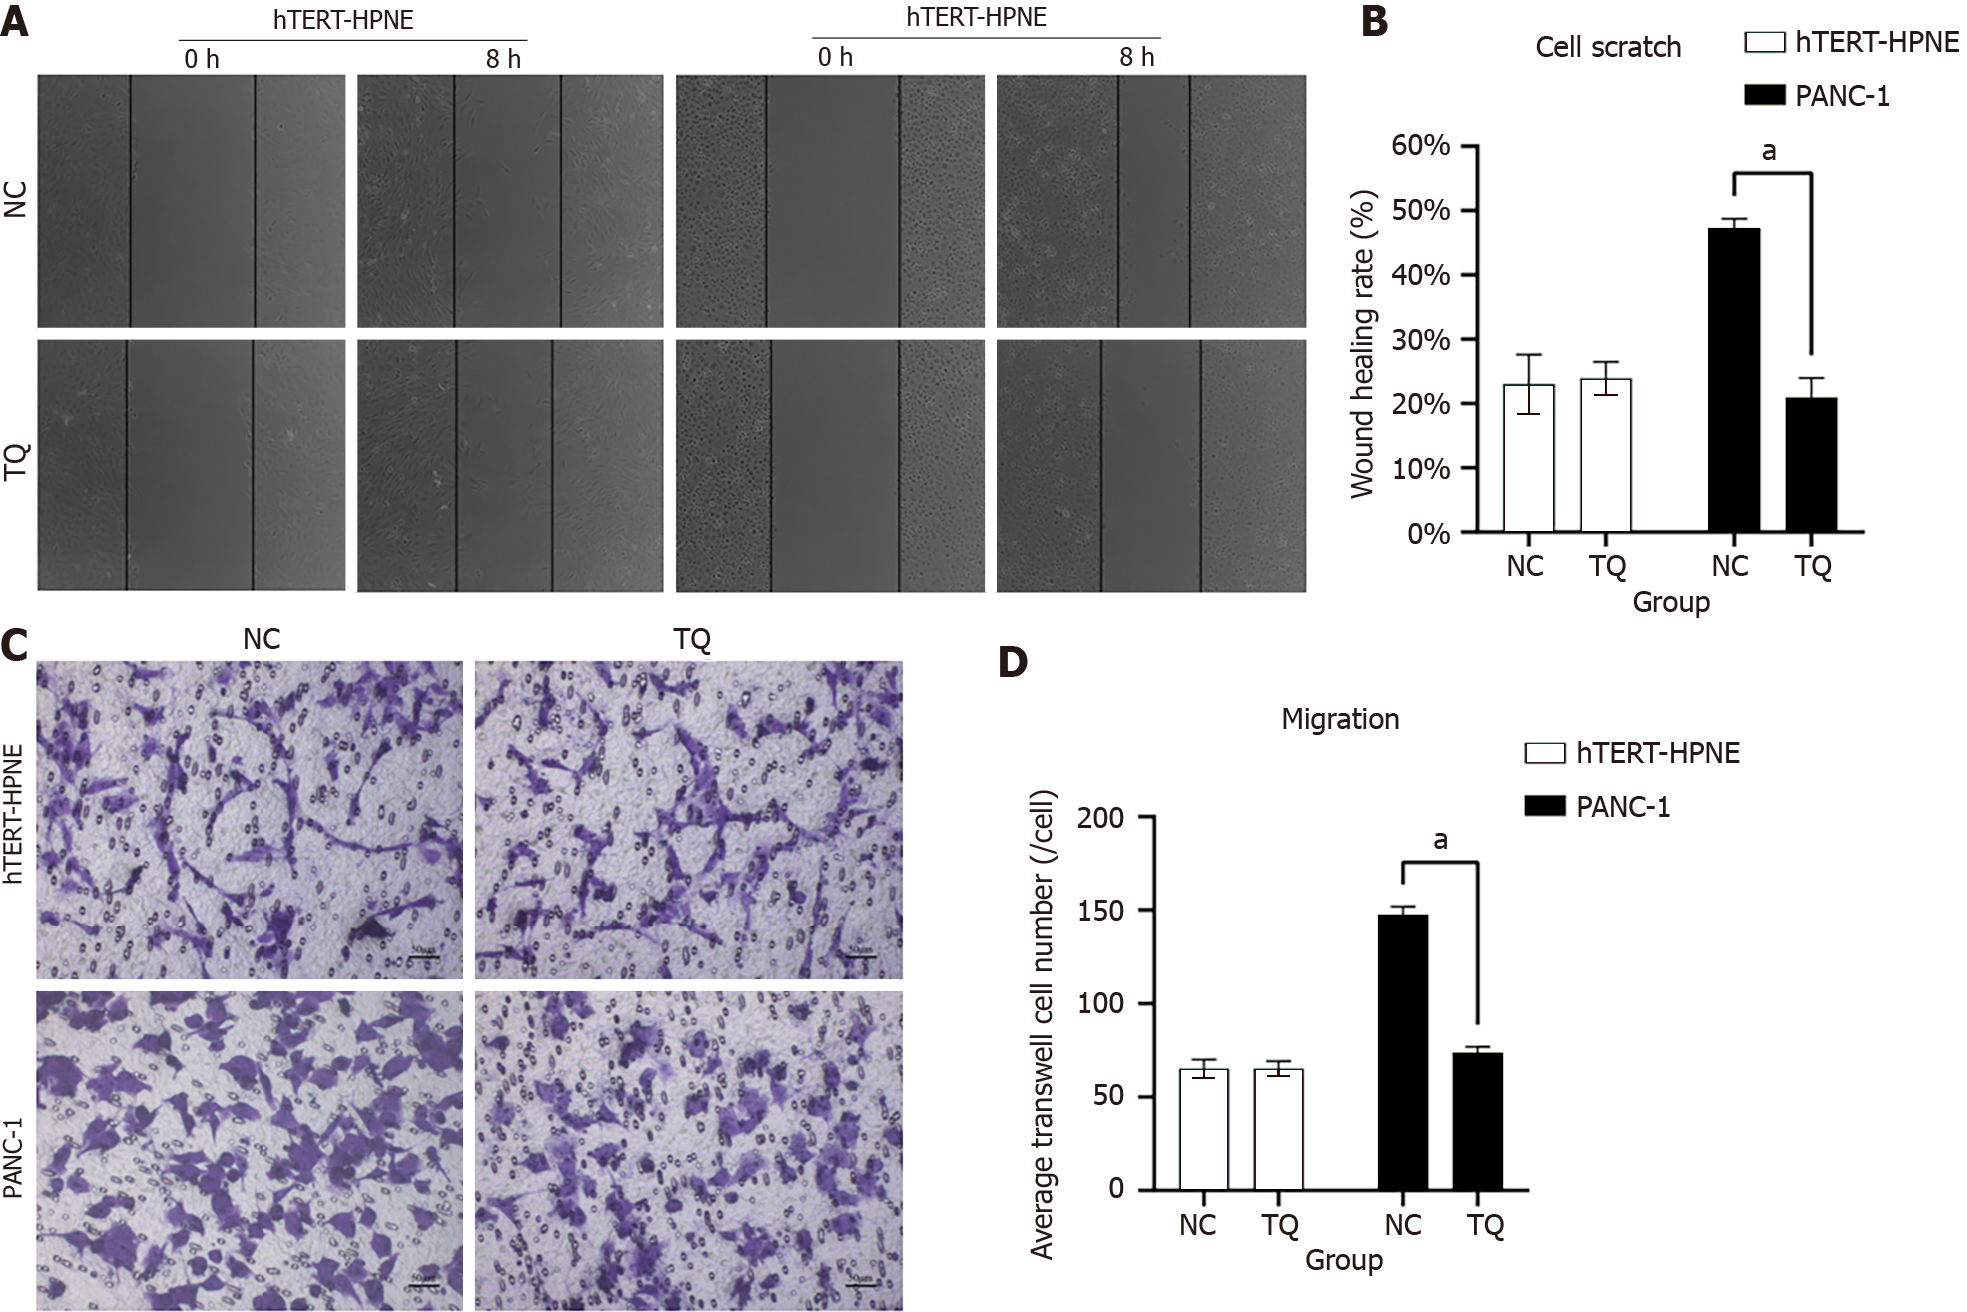
Figure 2 Effects of Thymoquinone on migration ability of normal pancreatic duct epithelial and PANC-1 cells under hypoxia condition.
A: The migration ability of normal pancreatic duct epithelial (hTERT-HPNE) cells and PANC-1 cells in normal control (NC) group and Thymoquinone (TQ) group was detected by cell scratch tassay under hypoxia condition; B: Statistical analysis of migration ability of hTERT-HPNE cells and PANC-1 cells in NC group and TQ group under hypoxia condition (cell scratch tassay); C: The migration ability of hTERT-HPNE cells and PANC-1 cells in NC group and TQ group were detected by Transwell assay under hypoxia condition (× 100); D: Statistical analysis of migration ability of hTERT-HPNE cells and PANC-1 cells in NC group and TQ group under hypoxia condition (Transwell assay). aP < 0.01. NC: Normal control; TQ: Thymoquinone; hTERT-HPNE: Normal pancreatic duct epithelial.
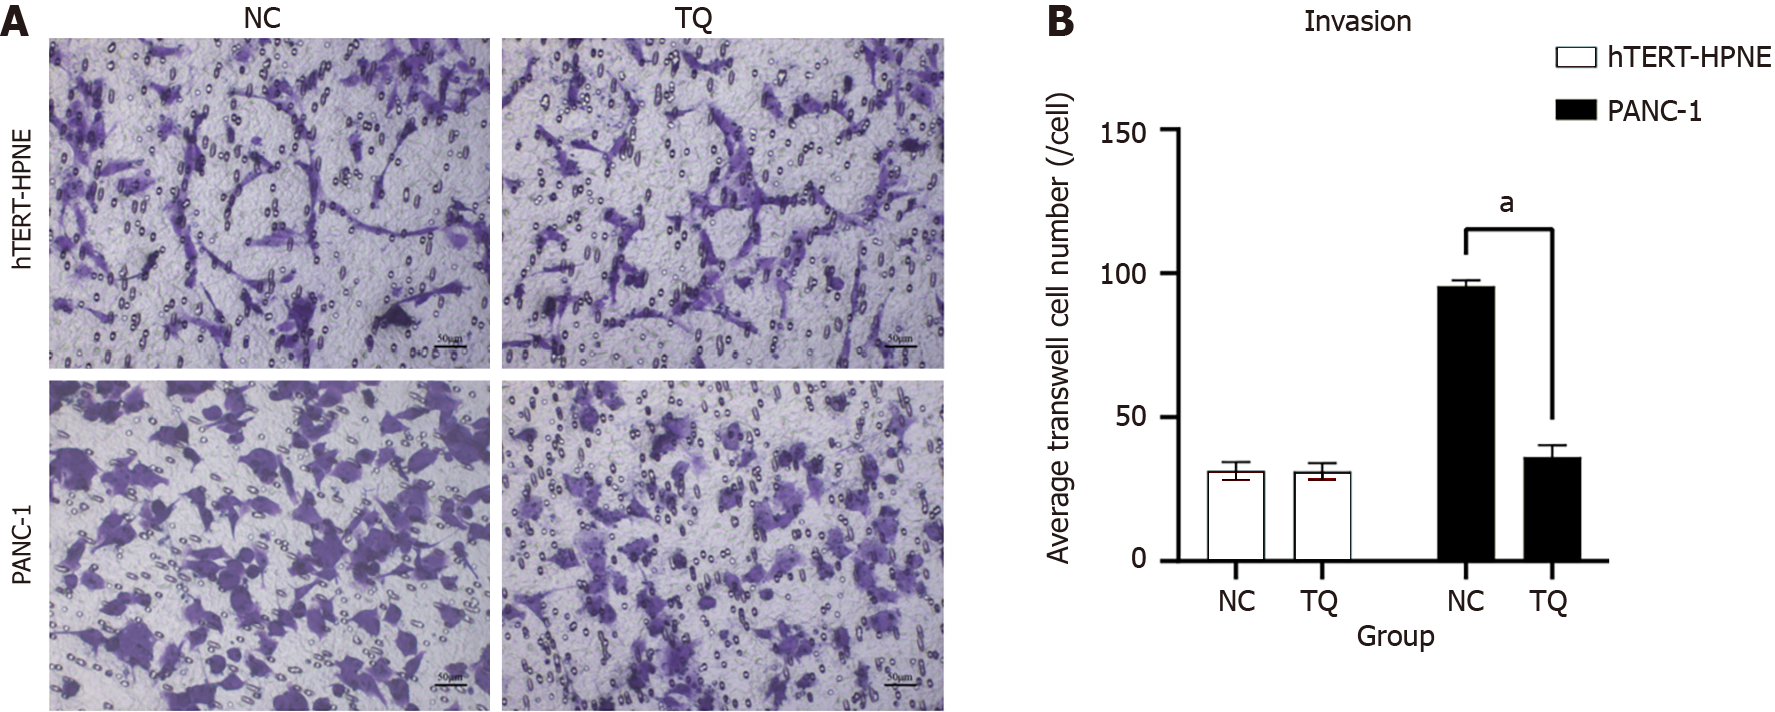
Figure 3 Effects of Thymoquinone on invasion of normal pancreatic duct epithelial and PANC-1 cells under hypoxia condition (Transwell assay).
A: The invasion ability of normal pancreatic duct epithelial (hTERT-HPNE) cells and PANC-1 cells in normal control (NC) group and Thymoquinone (TQ) group were detected by Transwell assay under hypoxia condition (× 100); B: Statistical analysis of invasion ability of hTERT-HPNE cells and PANC-1 cells in NC group and TQ group under hypoxia condition. aP < 0.01. NC: Normal control; TQ: Thymoquinone; hTERT-HPNE: Normal pancreatic duct epithelial.
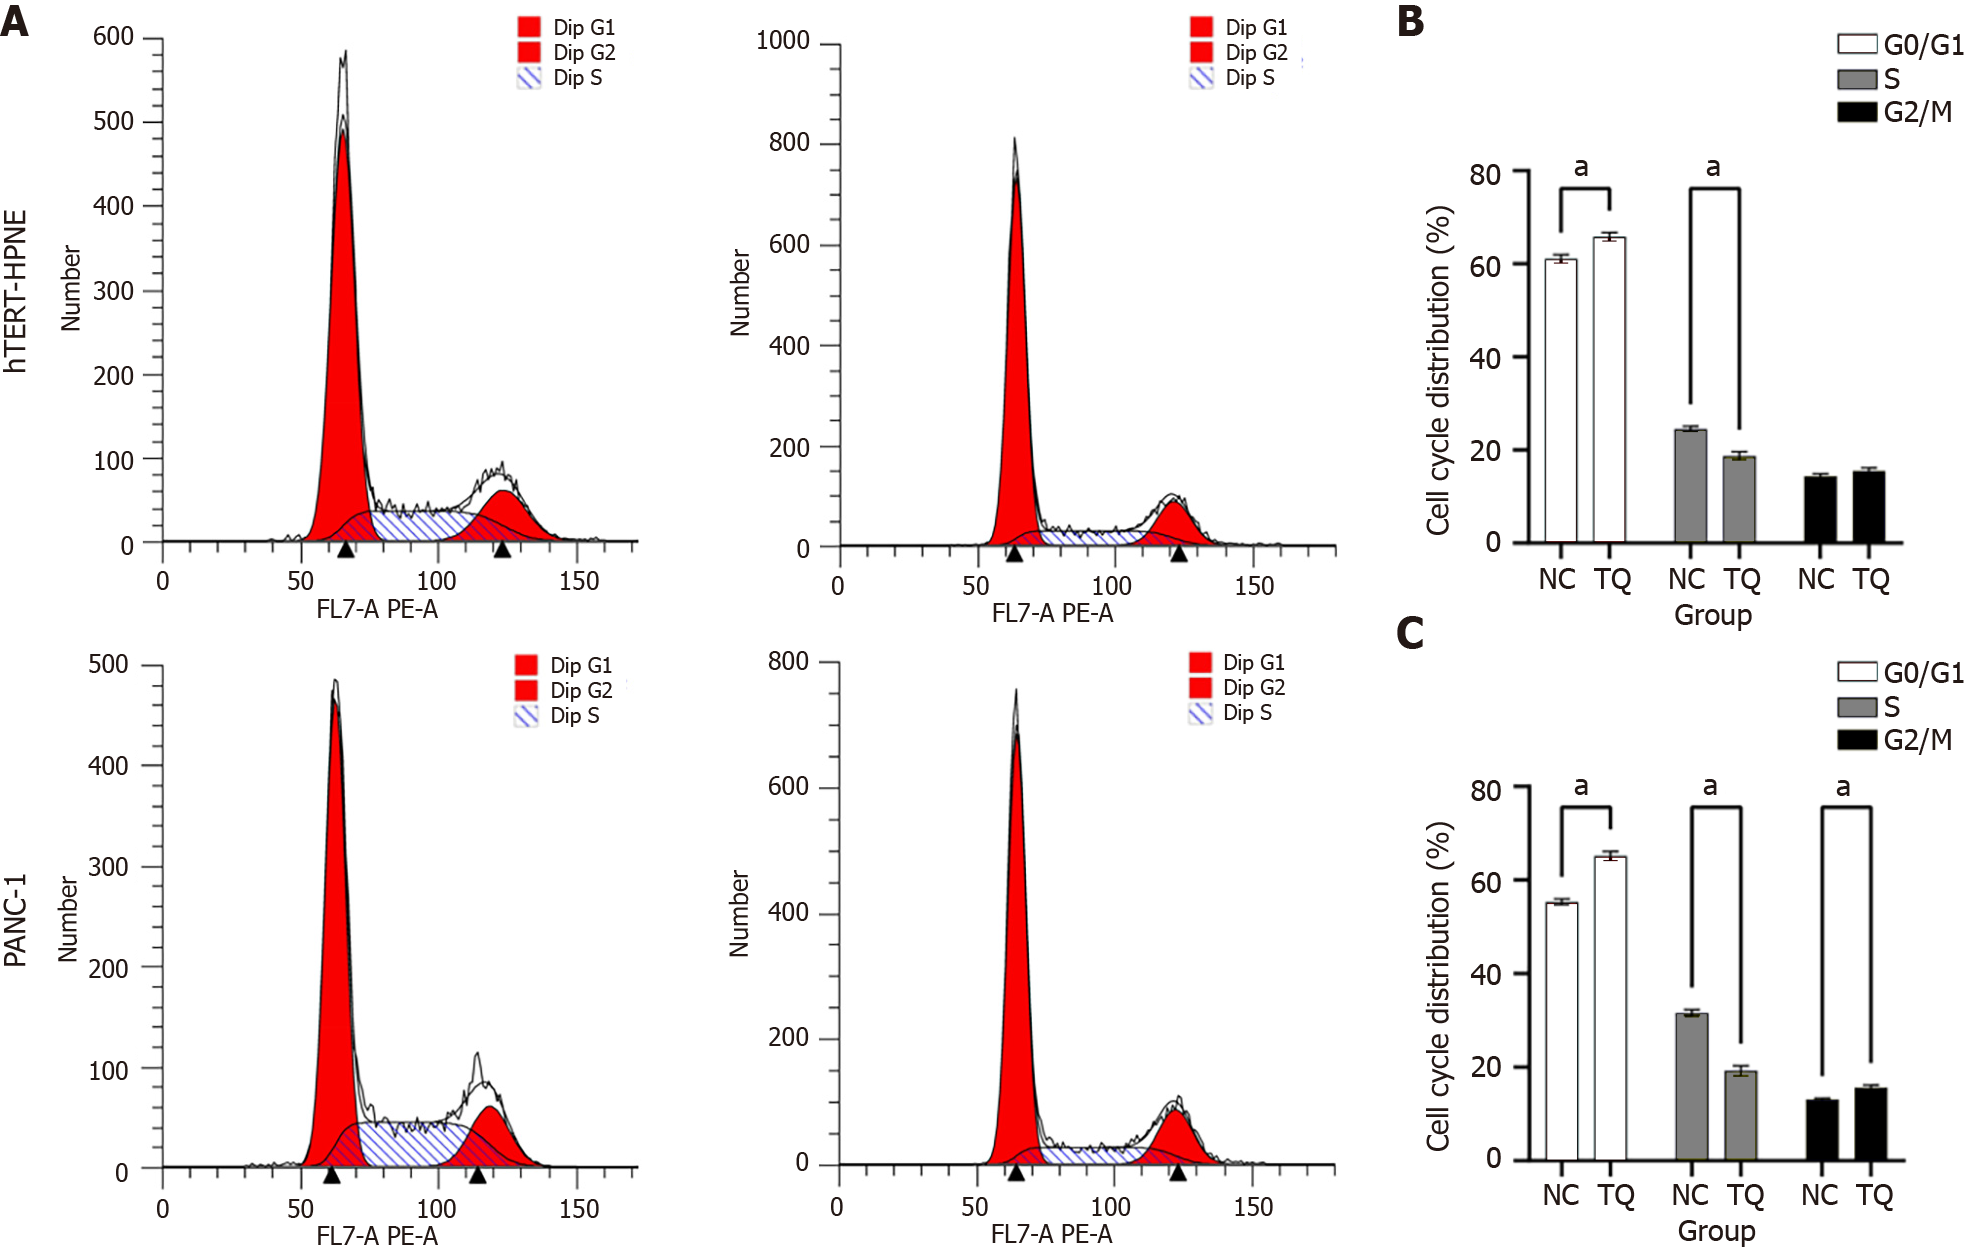
Figure 4 Effects of Thymoquinone on cell cycle of normal pancreatic duct epithelial cells and PANC-1 cells under hypoxia condition.
A: The cell cycle changes of normal pancreatic duct epithelial (hTERT-HPNE) cells and PANC-1 cells in normal control (NC) group and Thymoquinone (TQ) group were analyzed by flow cytometry; B: Statistical analysis of cell cycle changes of hTERT-HPNE cells in NC group and TQ group under hypoxia condition; C: Statistical analysis of cell cycle changes of PANC-1 cells in NC group and TQ group under hypoxia condition. aP < 0.01. NC: Normal control; TQ: Thymoquinone; hTERT-HPNE: Normal pancreatic duct epithelial.
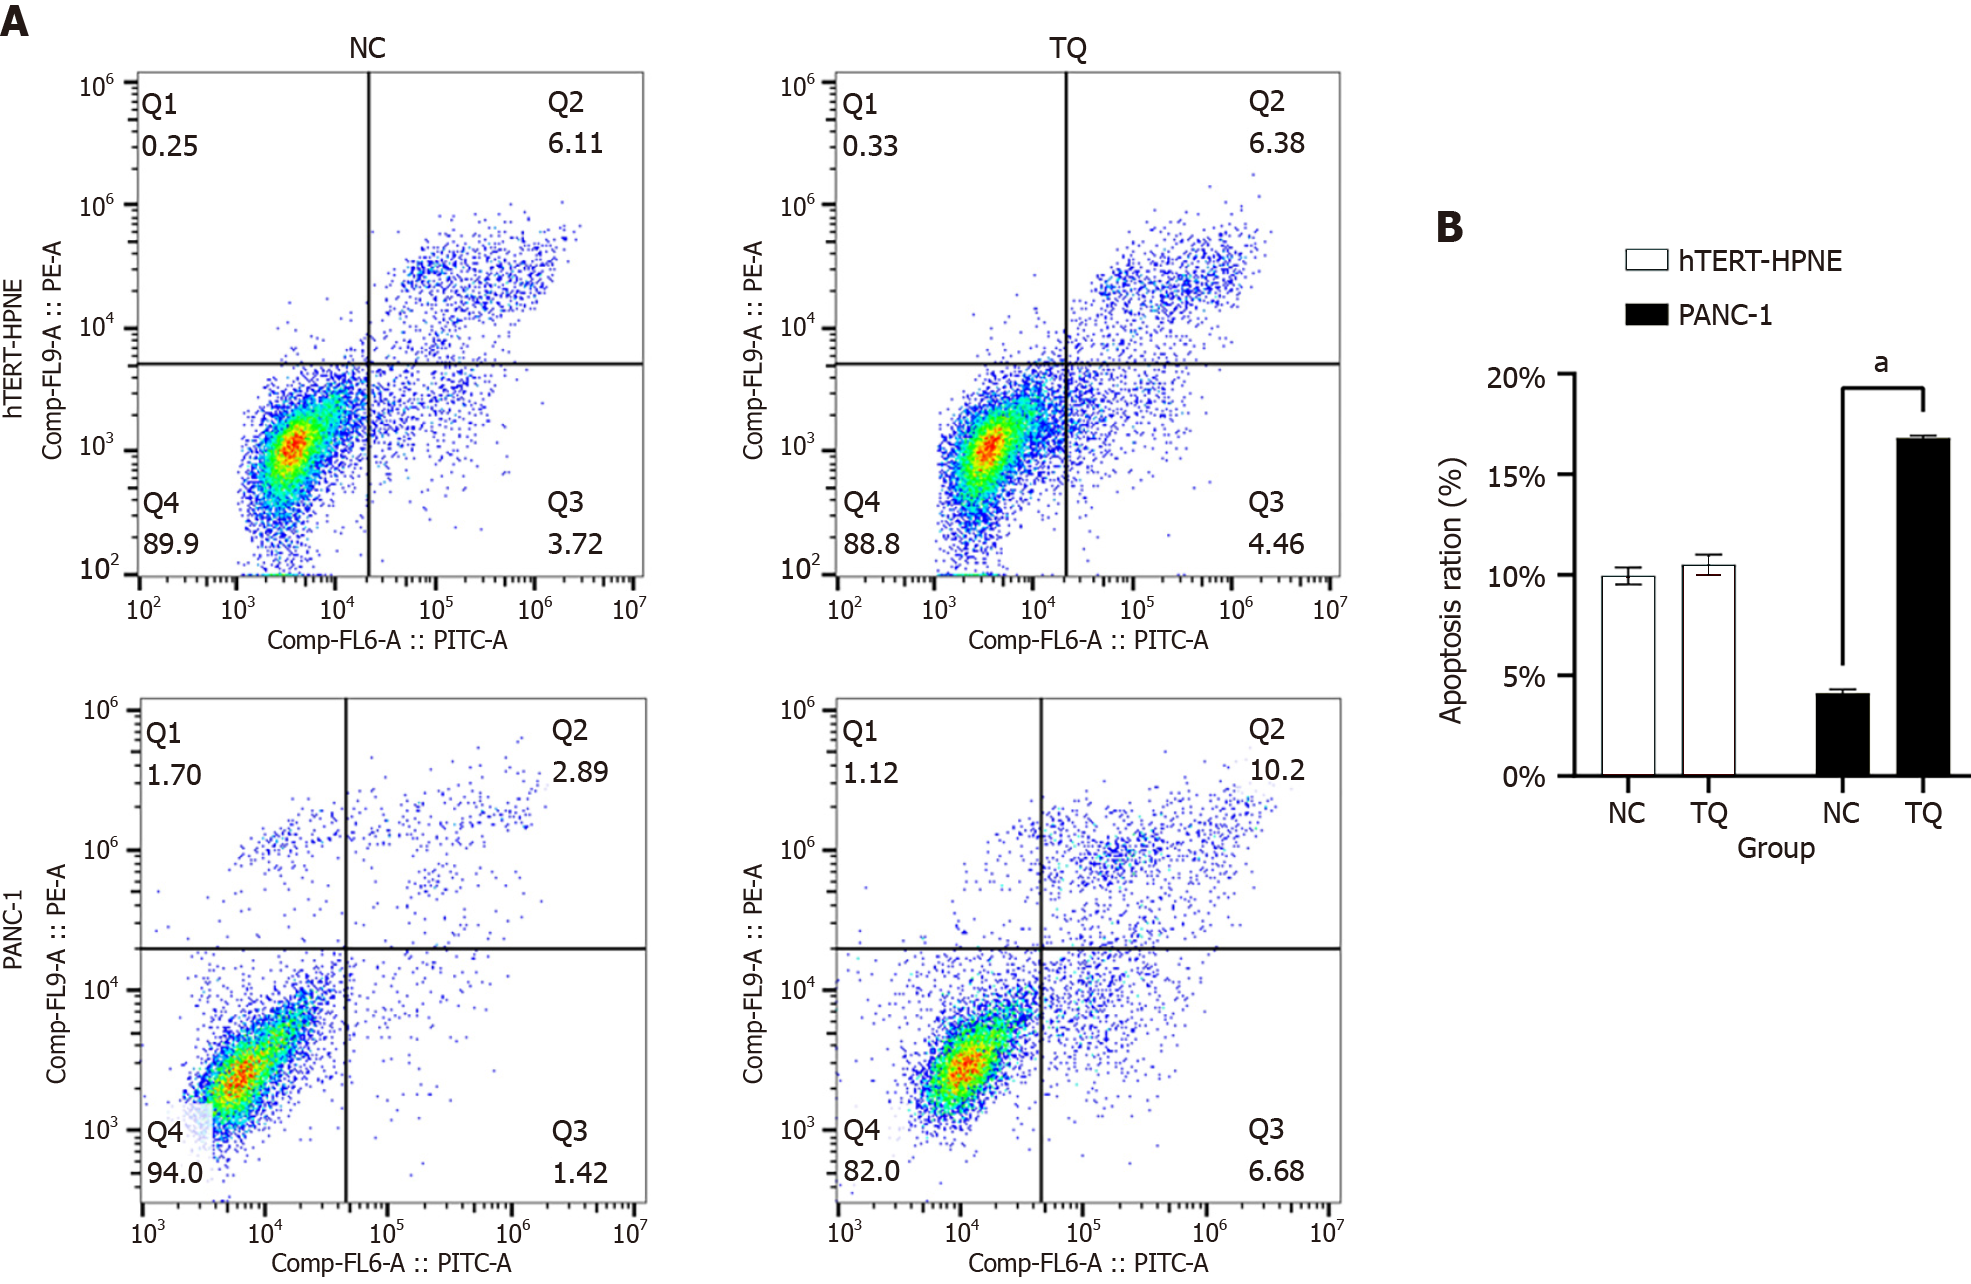
Figure 5 Effects of Thymoquinone on apoptosis of normal pancreatic duct epithelial cells and PANC-1 cells under hypoxia condition.
A: Flow cytometry was performed to detect the apoptosis of normal pancreatic duct epithelial (hTERT-HPNE) cells and PANC-1 cells in normal control (NC) group and Thymoquinone (TQ) under hypoxia condition; B: Statistical analysis of apoptosis of hTERT-HPNE cells and PANC-1 cells in NC group and TQ group under hypoxia condition. aP < 0.01. NC: Normal control; TQ: Thymoquinone; hTERT-HPNE: Normal pancreatic duct epithelial.
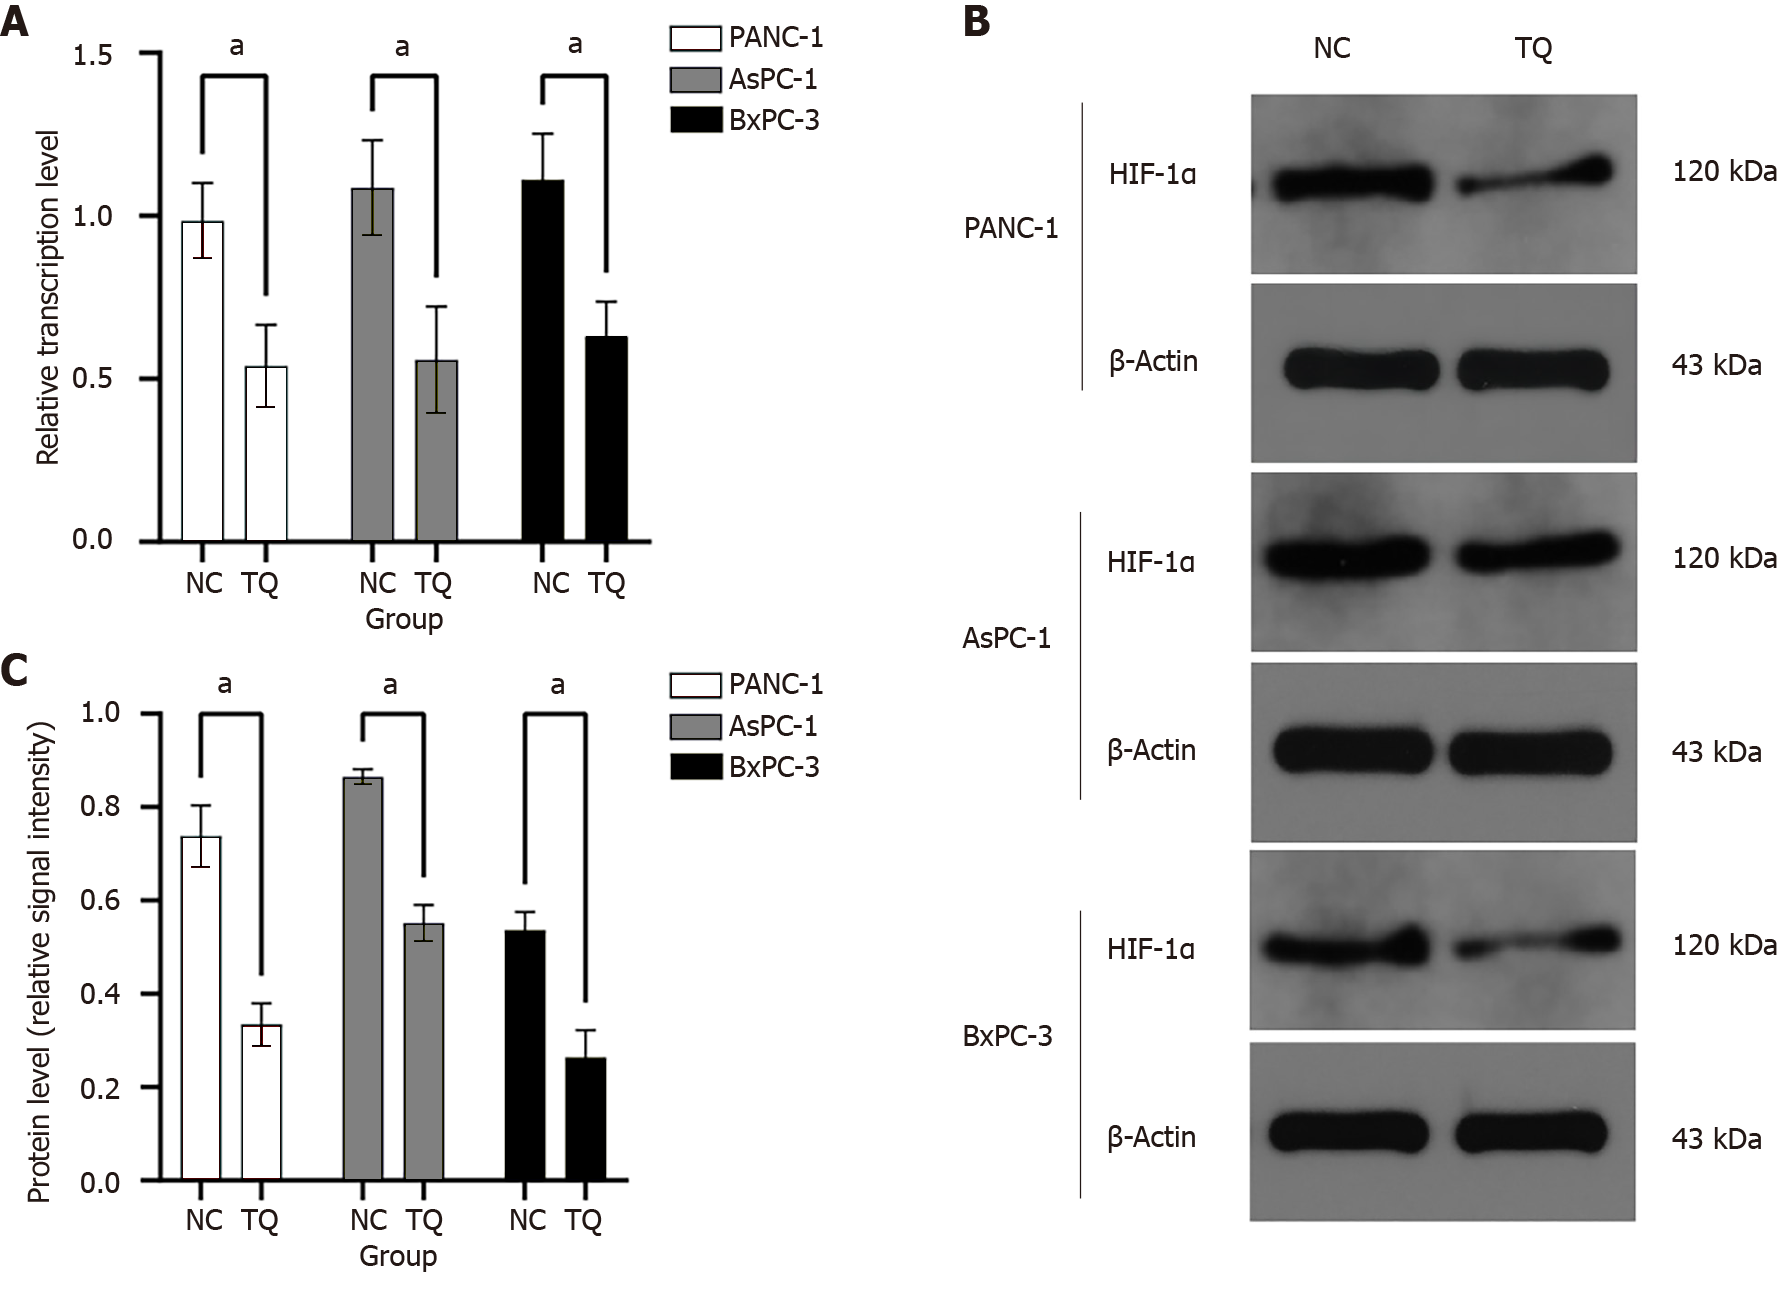
Figure 6 Effects of Thymoquinone on hypoxia-inducible factor-1αmRNA and protein expression in PANC-1, AsPC-1 and BxPC-3 cells under hypoxia condition.
A: Statistical analysis of hypoxia-inducible factor-1α (HIF-1α) mRNA expression of PANC-1, AsPC-1 and BxPC-3 cells in normal control (NC) group and Thymoquinone (TQ) group under hypoxia condition; B: Western blot assay was performed to detect HIF-1α protein expression of PANC-1, AsPC-1 and BxPC-3 cells in NC group and TQ group under hypoxia condition; C: Statistical analysis of HIF-1α protein expression of PANC-1, AsPC-1 and BxPC-3 cells in NC group and TQ group under hypoxia condition. aP < 0.01. NC: Normal control; TQ: Thymoquinone; HIF-1α: Hypoxia-inducible factor-1α.
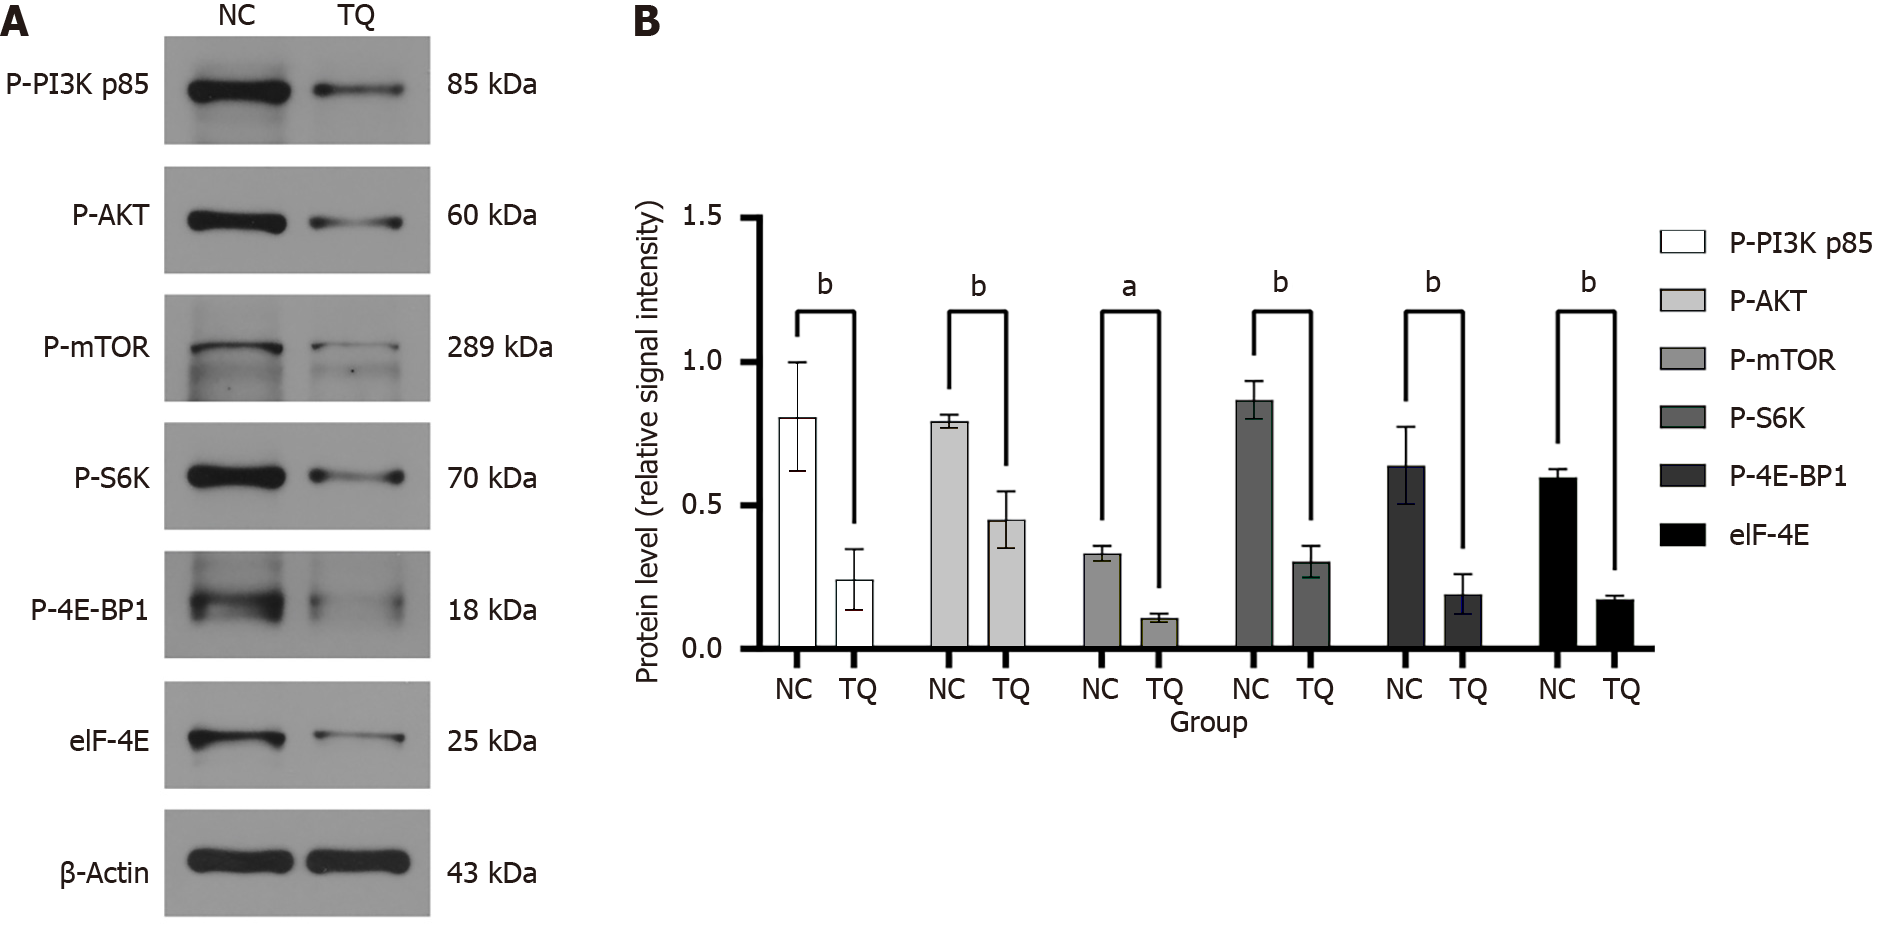
Figure 7 Effects of Thymoquinone on PI3K/AKT/mTOR upstream pathway of hypoxia-inducible factor-1αprotein under hypoxia condition.
A: Western blot assay was performed to detect the expression of p-PI3K-p85α, p-AKT, p-mTOR, p-S6K, p-4E-BP1 and eIF-4E of PANC-1 cells in normal control (NC) group and Thymoquinone (TQ) group under hypoxia condition; B: Statistical analysis of the expression of p-PI3K-p85α, p-AKT, p-mTOR, p-S6K, p-4E-BP1 and eIF-4E of PANC-1 cells in NC and TQ groups under hypoxia condition. aP < 0.05; bP < 0.01. NC: Normal control; TQ: Thymoquinone.
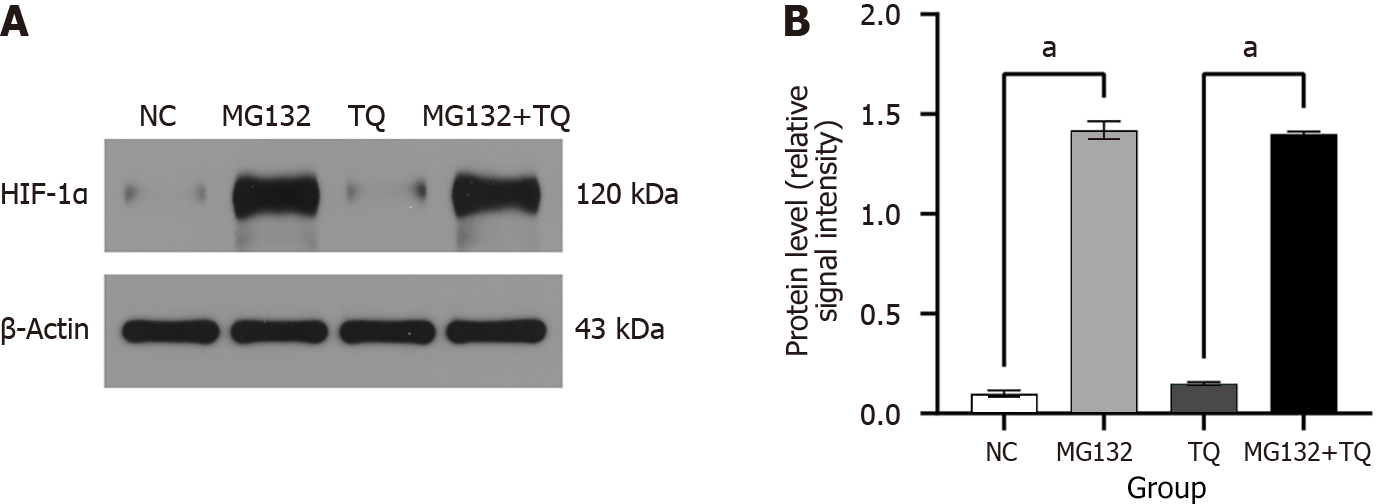
Figure 8 Effects of Thymoquinone on ubiquitination degradation of hypoxia-inducible factor-1α protein under normoxia condition.
A: Western blot assay was performed to detect hypoxia-inducible factor-1α (HIF-1α) expression of PANC-1 cells in normal control (NC) group, MG132 group, Thymoquinone (TQ) group and MG132+TQ group under normoxia condition; B: Statistical analysis of HIF-1α protein expression of PANC-1 cells in NC group, MG132 group, TQ group and MG132+TQ group under normoxia condition. aP < 0.01. NC: Normal control; TQ: Thymoquinone; HIF-1α: Hypoxia-inducible factor-1α.
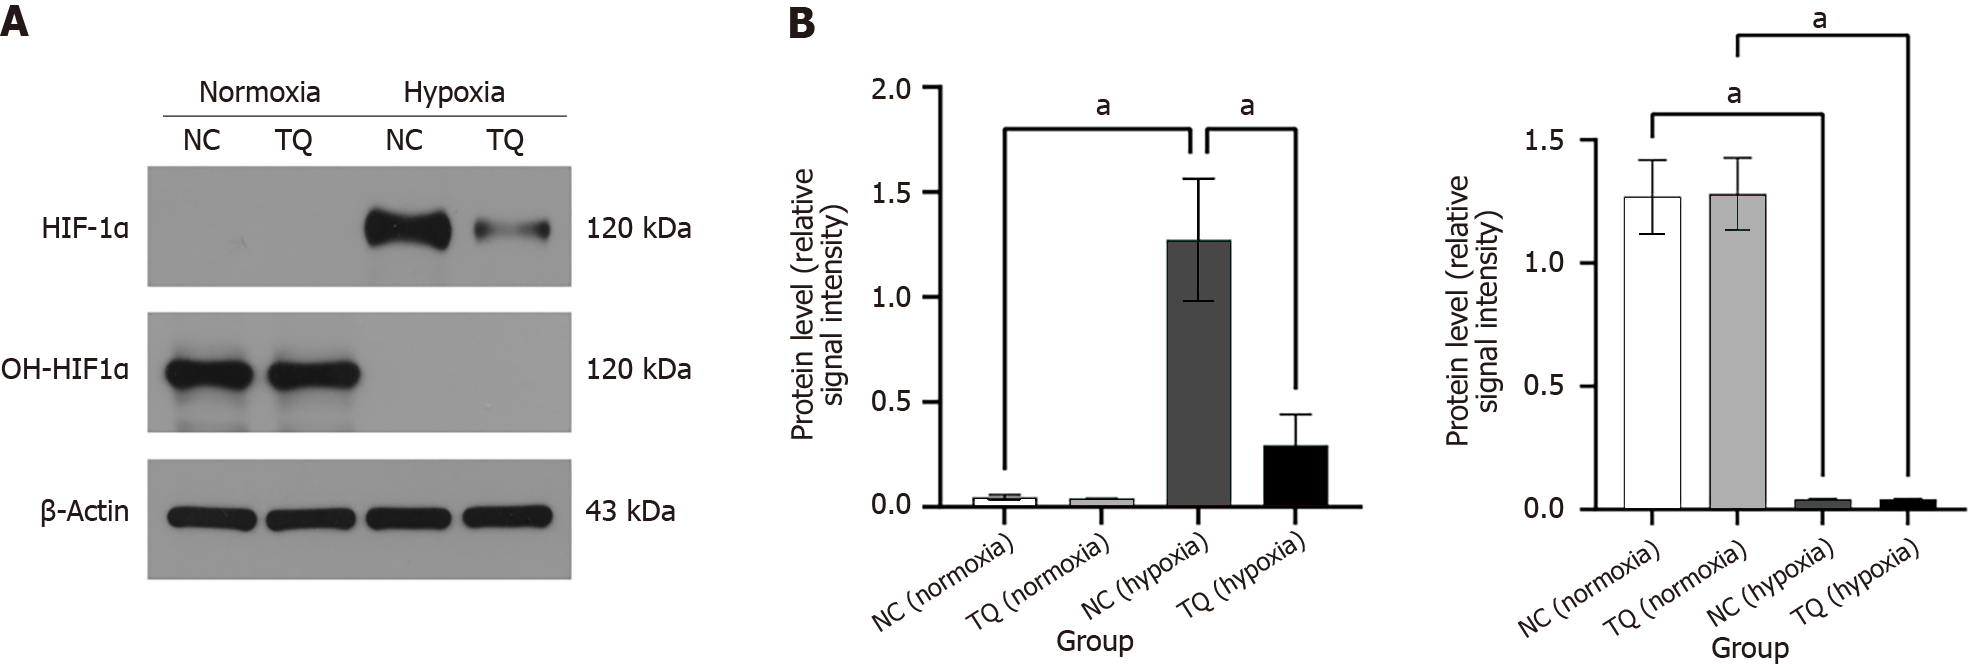
Figure 9 Effects of Thymoquinone on hydroxylation of hypoxia-inducible factor-1αprotein.
A: Western blot assay was performed to detect hypoxia-inducible factor-1α (HIF-1α) and OH-HIF-1α expression of PANC-1 cells in normal control (NC) group and Thymoquinone (TQ) group under normoxia and hypoxia conditions; B: Statistical analysis of HIF-1α protein expression of PANC-1 cells in NC group and TQ group under normoxia and hypoxia conditions; C: Statistical analysis of OH-HIF-1α protein expression of PANC-1 cells in NC group and TQ group under normoxia and hypoxia conditions. aP < 0.01. NC: Normal control; TQ: Thymoquinone; HIF-1α: Hypoxia-inducible factor-1α.
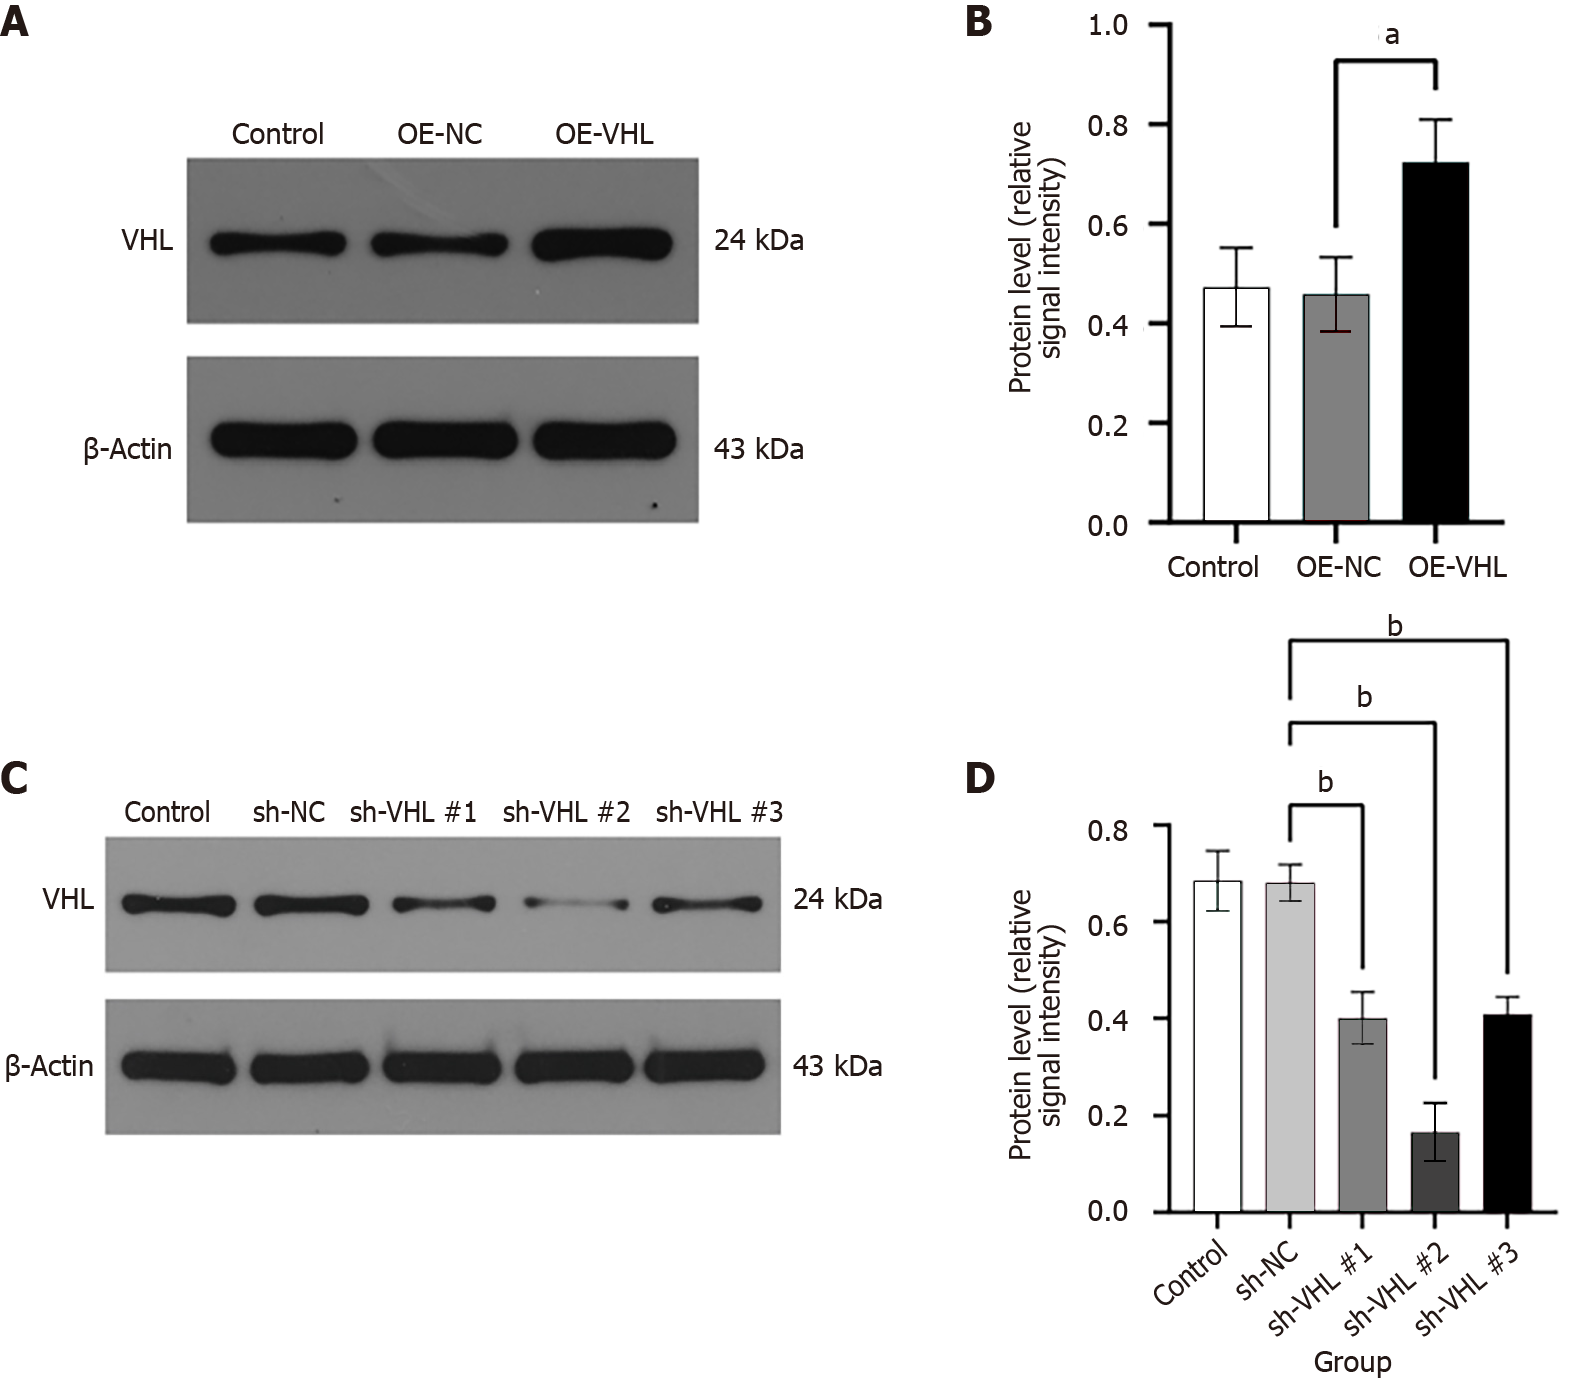
Figure 10 Expression of von Hippel Lindau protein in von Hippel Lindau overexpression and von Hippel Lindau knockdown cell models under normoxia condition.
A: Western blot assay was performed to detect von Hippel Lindau (VHL) protein expression in cell models of control group, overexpressed empty carrier (OE-NC) group and VHL overexpressed (OE-VHL) group under normoxia condition; B: Statistical analysis of VHL protein expression in cell models of control group, OE-NC group and OE-VHL group under normoxia condition; C: Western blot assay was performed to detect VHL protein expression in cell models of control group, knockdown empty vector (sh-NC) group and VHL knockdown (sh-VHL) group under normoxia condition; D: Statistical analysis of VHL protein expression in cell models of control group, sh-NC group and sh-VHL group under normoxia condition. aP < 0.05; bP < 0.01. VHL: von Hippel Lindau; OE-NC: Overexpressed empty carrier; OE-VHL: VHL overexpressed; sh-NC: Knockdown empty vector; sh-VHL: VHL knockdown.
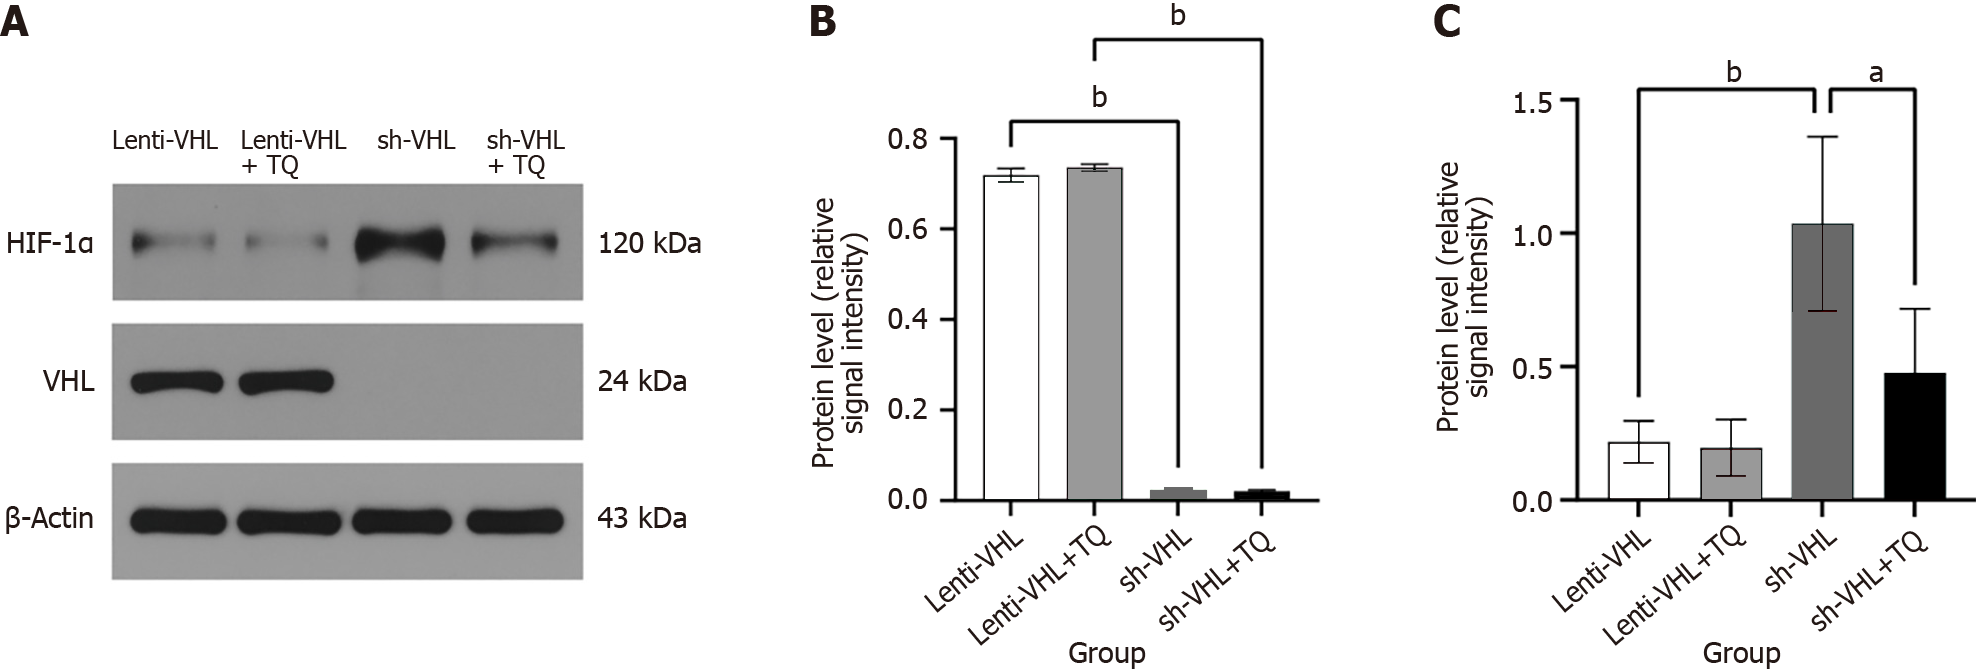
Figure 11 Effects of Thymoquinone on ubiquitination degradation of hypoxia-inducible factor-1α protein mediated by von Hippel Lindau under normoxia condition.
A: Western blot analysis was performed to detect the expression of von Hippel Lindau (VHL) protein and hypoxia-inducible factor-1α (HIF-1α) protein in Lenti-VHL group, Lenti-VHL + Thymoquinone (TQ) group, VHL knockdown (sh-VHL) group and sh-VHL+TQ group under normoxia condition; B: Statistical analysis of VHL protein expression in the Lenti-VHL group, Lenti-VHL+TQ group, sh-VHL group and sh-VHL+TQ group under normoxia condition; C: Statistical analysis of HIF-1α expression in Lenti-VHL group, Lenti-VHL+TQ group, sh-VHL group and sh-VHL+TQ group under normoxia condition. aP < 0.05; bP < 0.01. TQ: Thymoquinone; VHL: von Hippel Lindau; sh-VHL: VHL knockdown; HIF-1α: Hypoxia-inducible factor-1α.
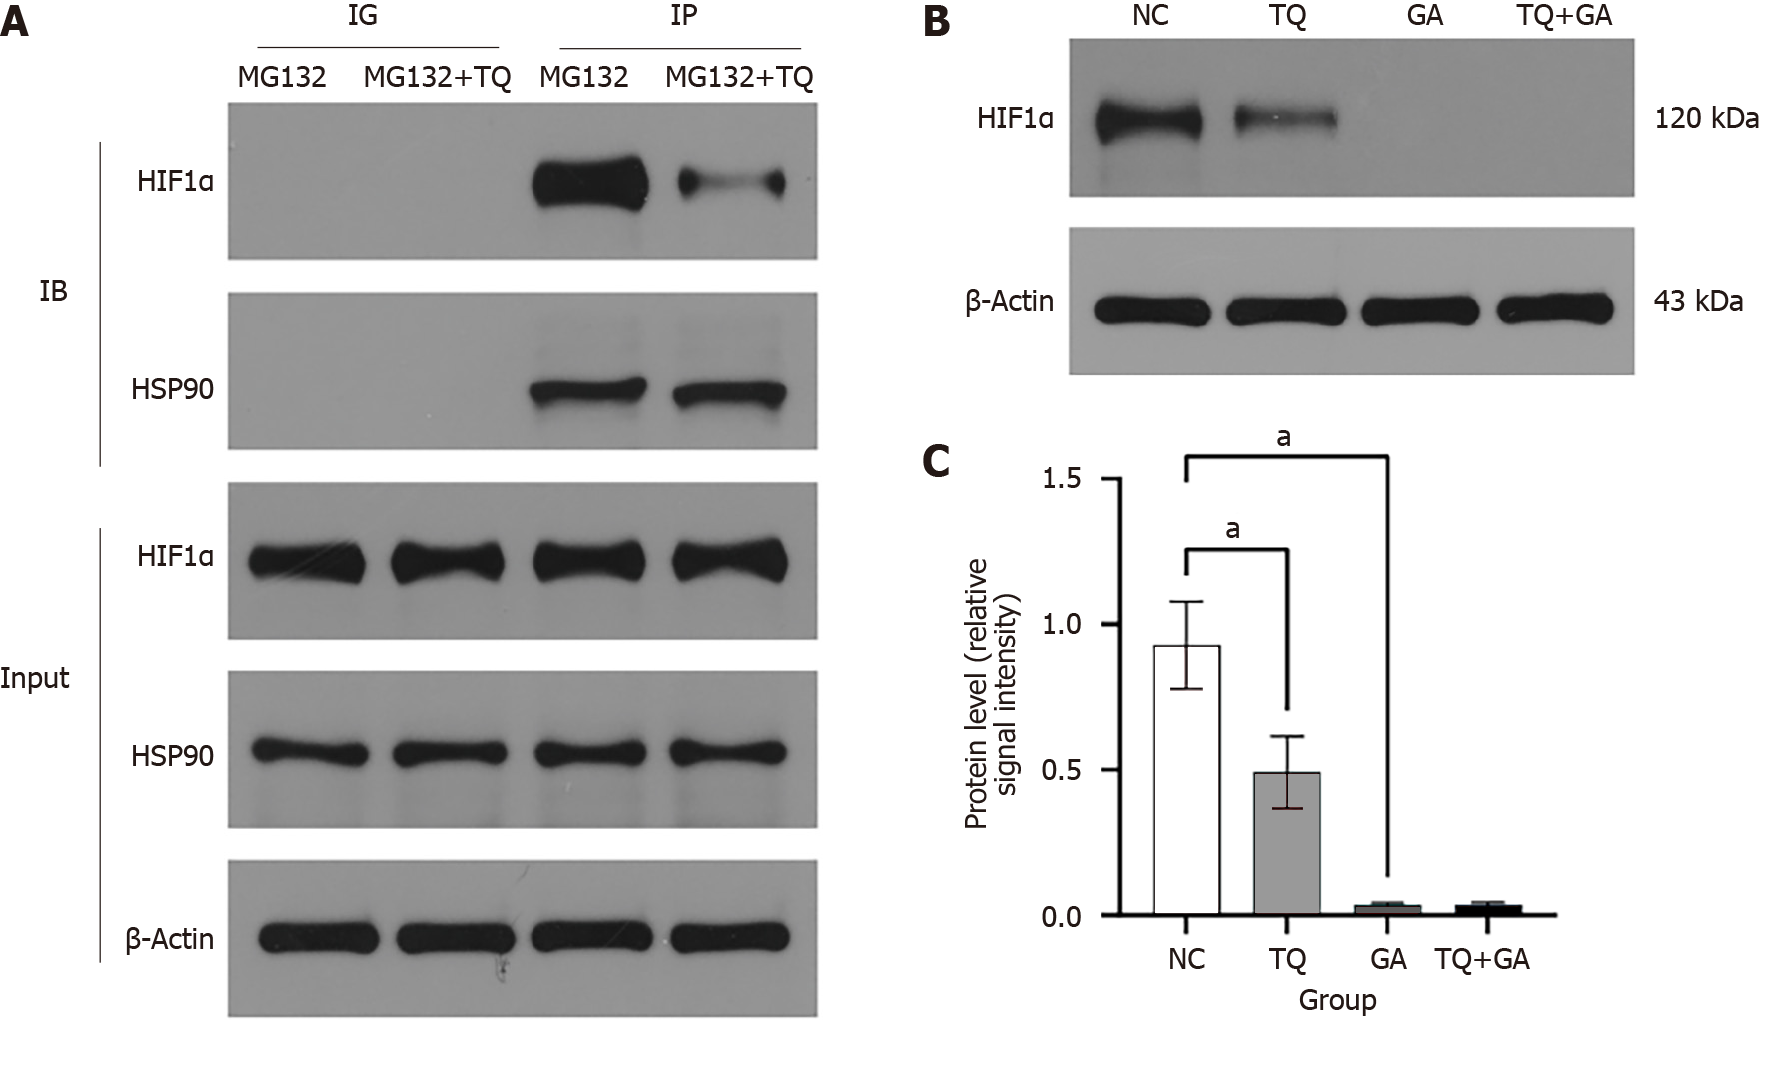
Figure 12 Effects of Thymoquinone on interaction between hypoxia-inducible factor-1α and HSP90.
A: Immunoprecipitation assay was performed to detect the hypoxia-inducible factor-1α (HIF-1α) and HSP90 immunoprecipitation of PANC-1 cells in MG132 group and MG132 + Thymoquinone (TQ) group under normoxia condition; B: Western blot assay was performed to detect HIF-1α expression of PANC-1 cells in normal control (NC) group, TQ group, geldanamycin (GA) group and TQ+GA group under hypoxia condition; C: Statistical analysis of HIF-1α protein expression of PANC-1 cells in NC group, TQ group, GA group and TQ+GA group under hypoxia condition. aP < 0.01. NC: Normal control; TQ: Thymoquinone; GA: Geldanamycin; HIF-1α: Hypoxia-inducible factor-1α.
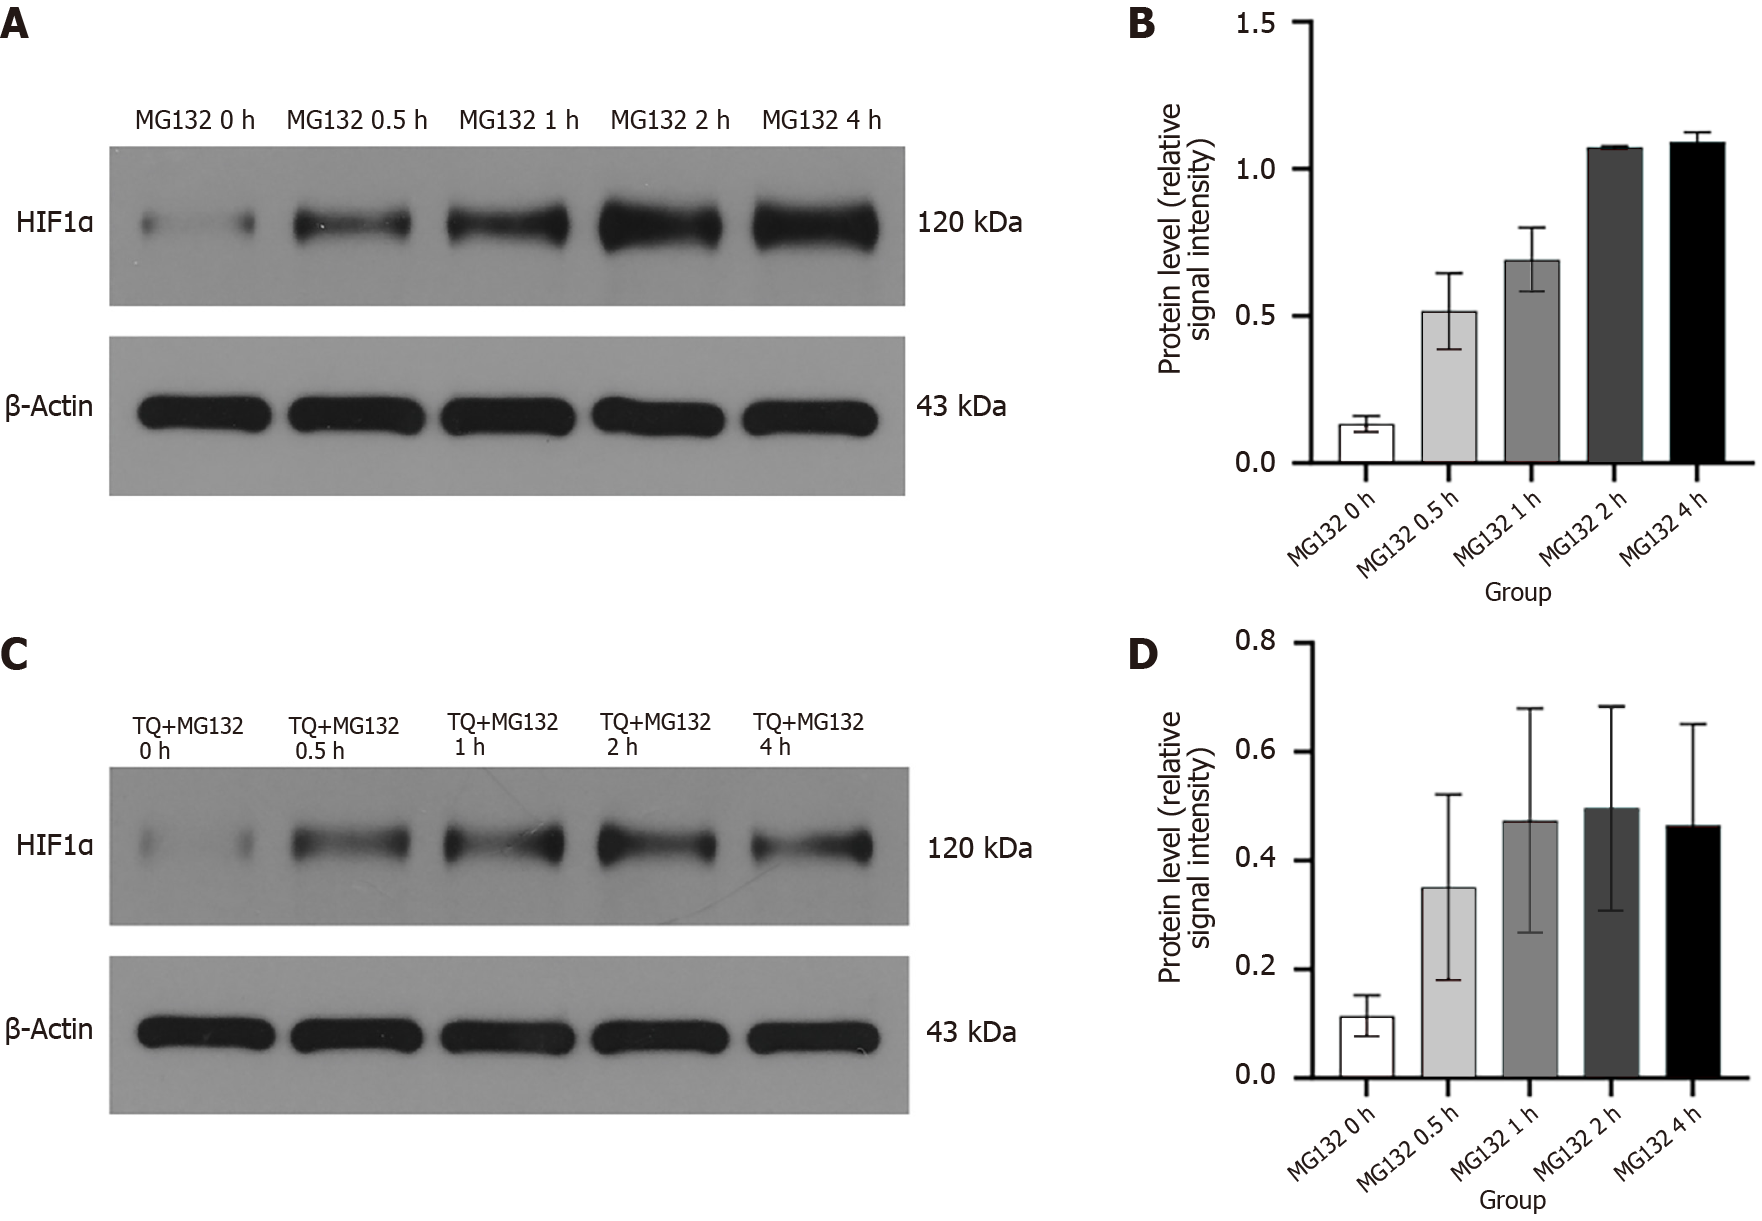
Figure 13 Further verification of the effects of Thymoquinone on the initial expression of hypoxia-inducible factor-1α protein.
A: Western blot assay was performed to detect hypoxia-inducible factor-1α (HIF-1α) expression in PANC-1 cells treated with MG132 at 0 h, 0.5 h, 1 h, 2 h and 4 h under normoxia condition; B: Statistical analysis of HIF-1α protein expression in PANC-1 cells treated with MG132 at 0 h, 0.5 h, 1 h, 2 h and 4 h under normoxia condition; C: Western blot assay was performed to detect HIF-1α expression in PANC-1 cells treated with MG132 + Thymoquinone (TQ) at 0 h, 0.5 h, 1 h, 2 h and 4 h under normoxia condition; D: Statistical analysis of HIF-1α protein expression in PANC-1 cells treated with MG132+TQ at 0 h, 0.5 h, 1 h, 2 h and 4 h under normoxia condition. TQ: Thymoquinone; HIF-1α: Hypoxia-inducible factor-1α.
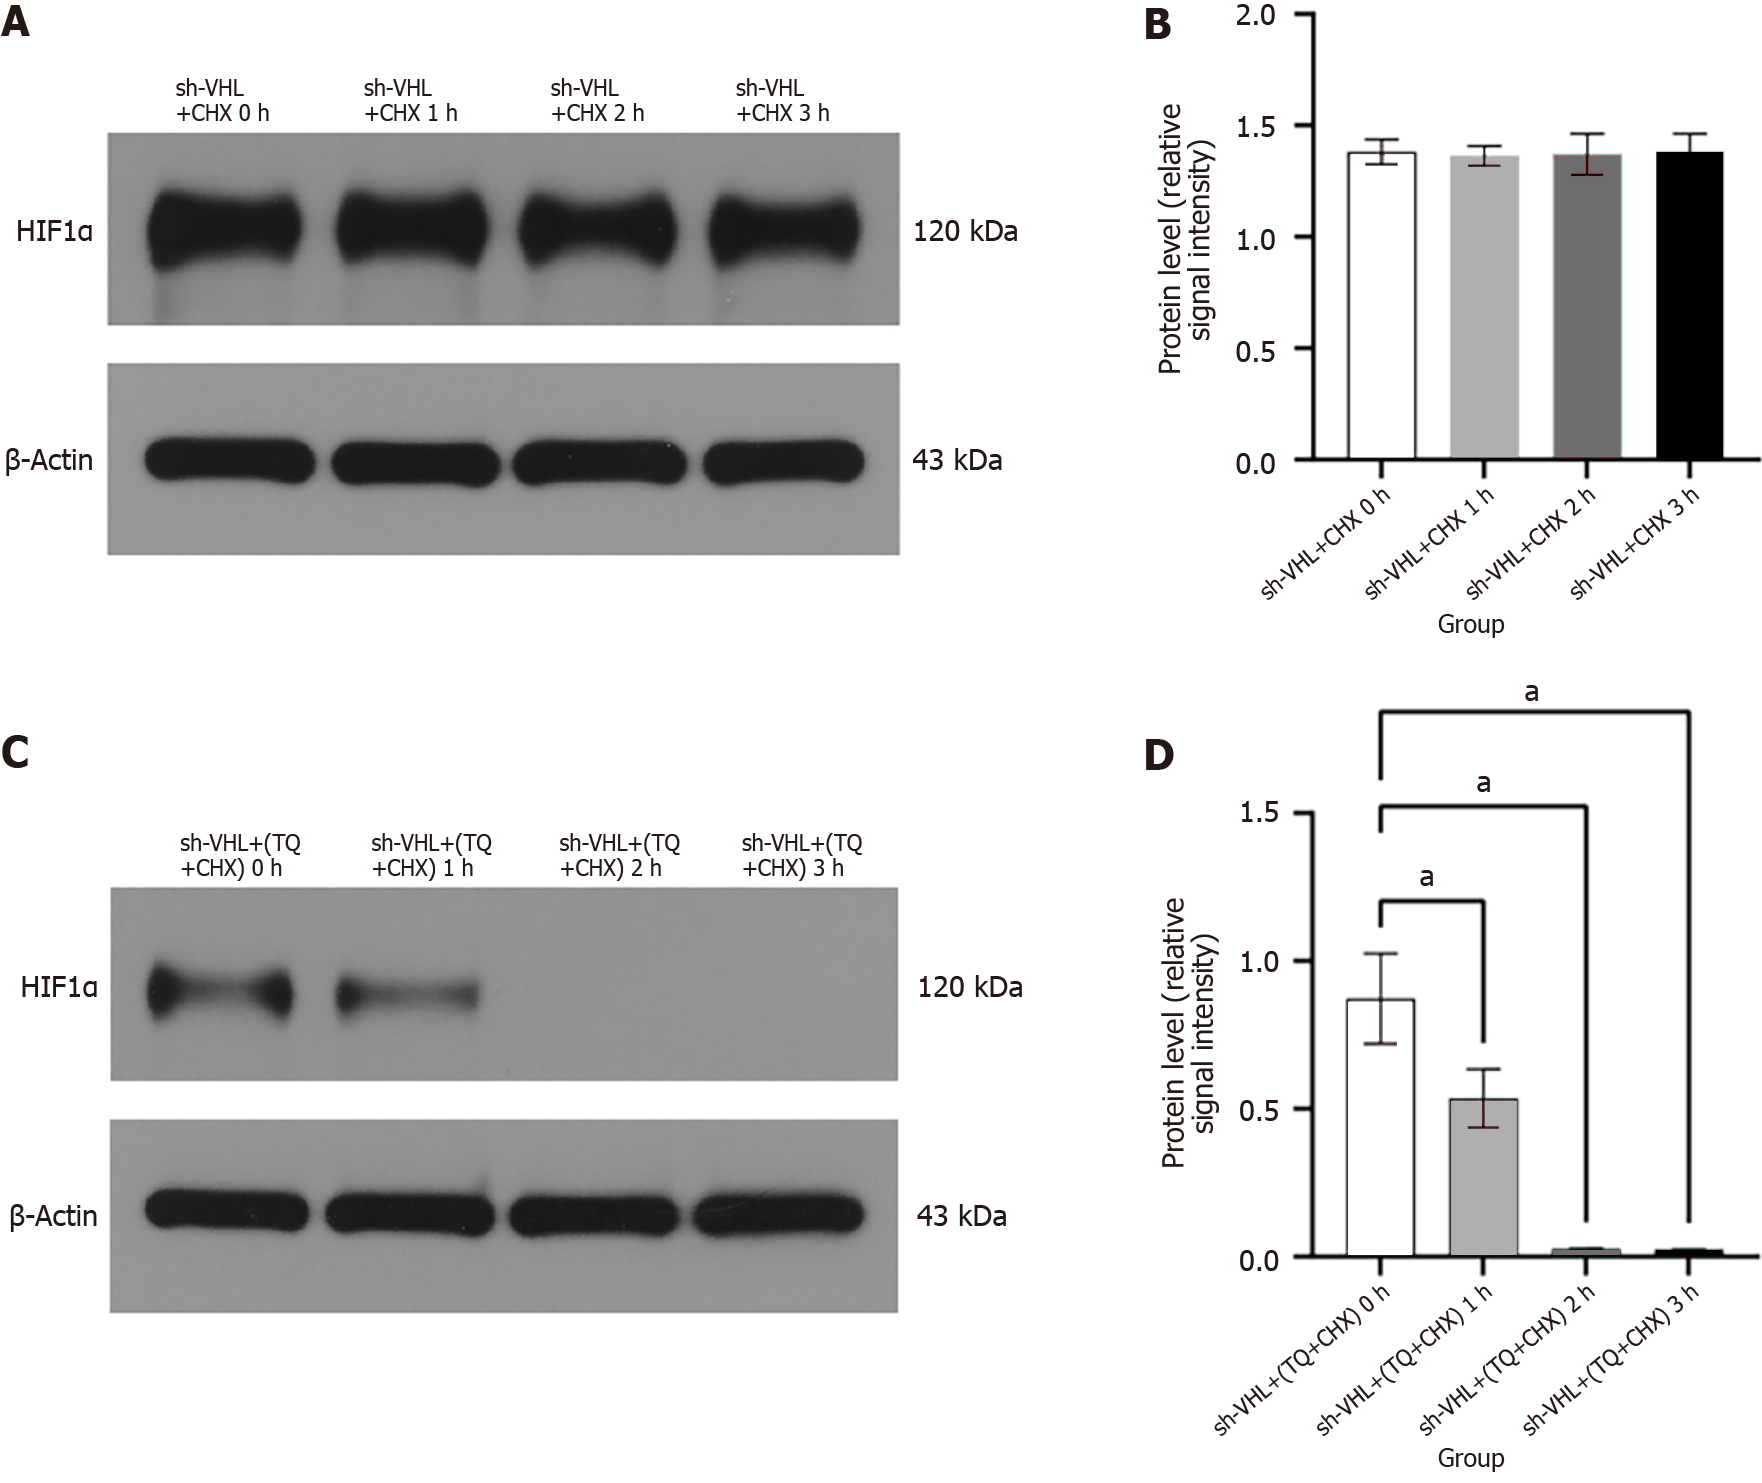
Figure 14 Further validation of the effects of Thymoquinone on ubiquitination degradation of hypoxia-inducible factor-1αprotein.
A: Western blot assay was performed to detect hypoxia-inducible factor-1α (HIF-1α) expression in von Hippel Lindau (VHL) knockdown PANC-1 cells treated with cycloheximide (CHX) at 0 h, 1 h, 2 h and 3 h under normoxia condition; B: Statistical analysis of HIF-1α protein expression in VHL knockdown PANC-1 cells treated with CHX at 0 h, 1 h, 2 h and 3 h under normoxia condition; C: Western blot assay was performed to detect HIF-1α expression in VHL knockdown PANC-1 cells treated with CHX + Thymoquinone (TQ) at 0 h, 1 h, 2 h and 3 h under normoxia condition; D: Statistical analysis of HIF-1α expression in VHL knockdown PANC-1 cells treated with CHX+TQ at 0 h, 1 h, 2 h and 3 h under normoxia conditions. aP < 0.01. CHX: Cycloheximide; VHL: von Hippel Lindau; sh-VHL: VHL knockdown; HIF-1α: Hypoxia-inducible factor-1α.
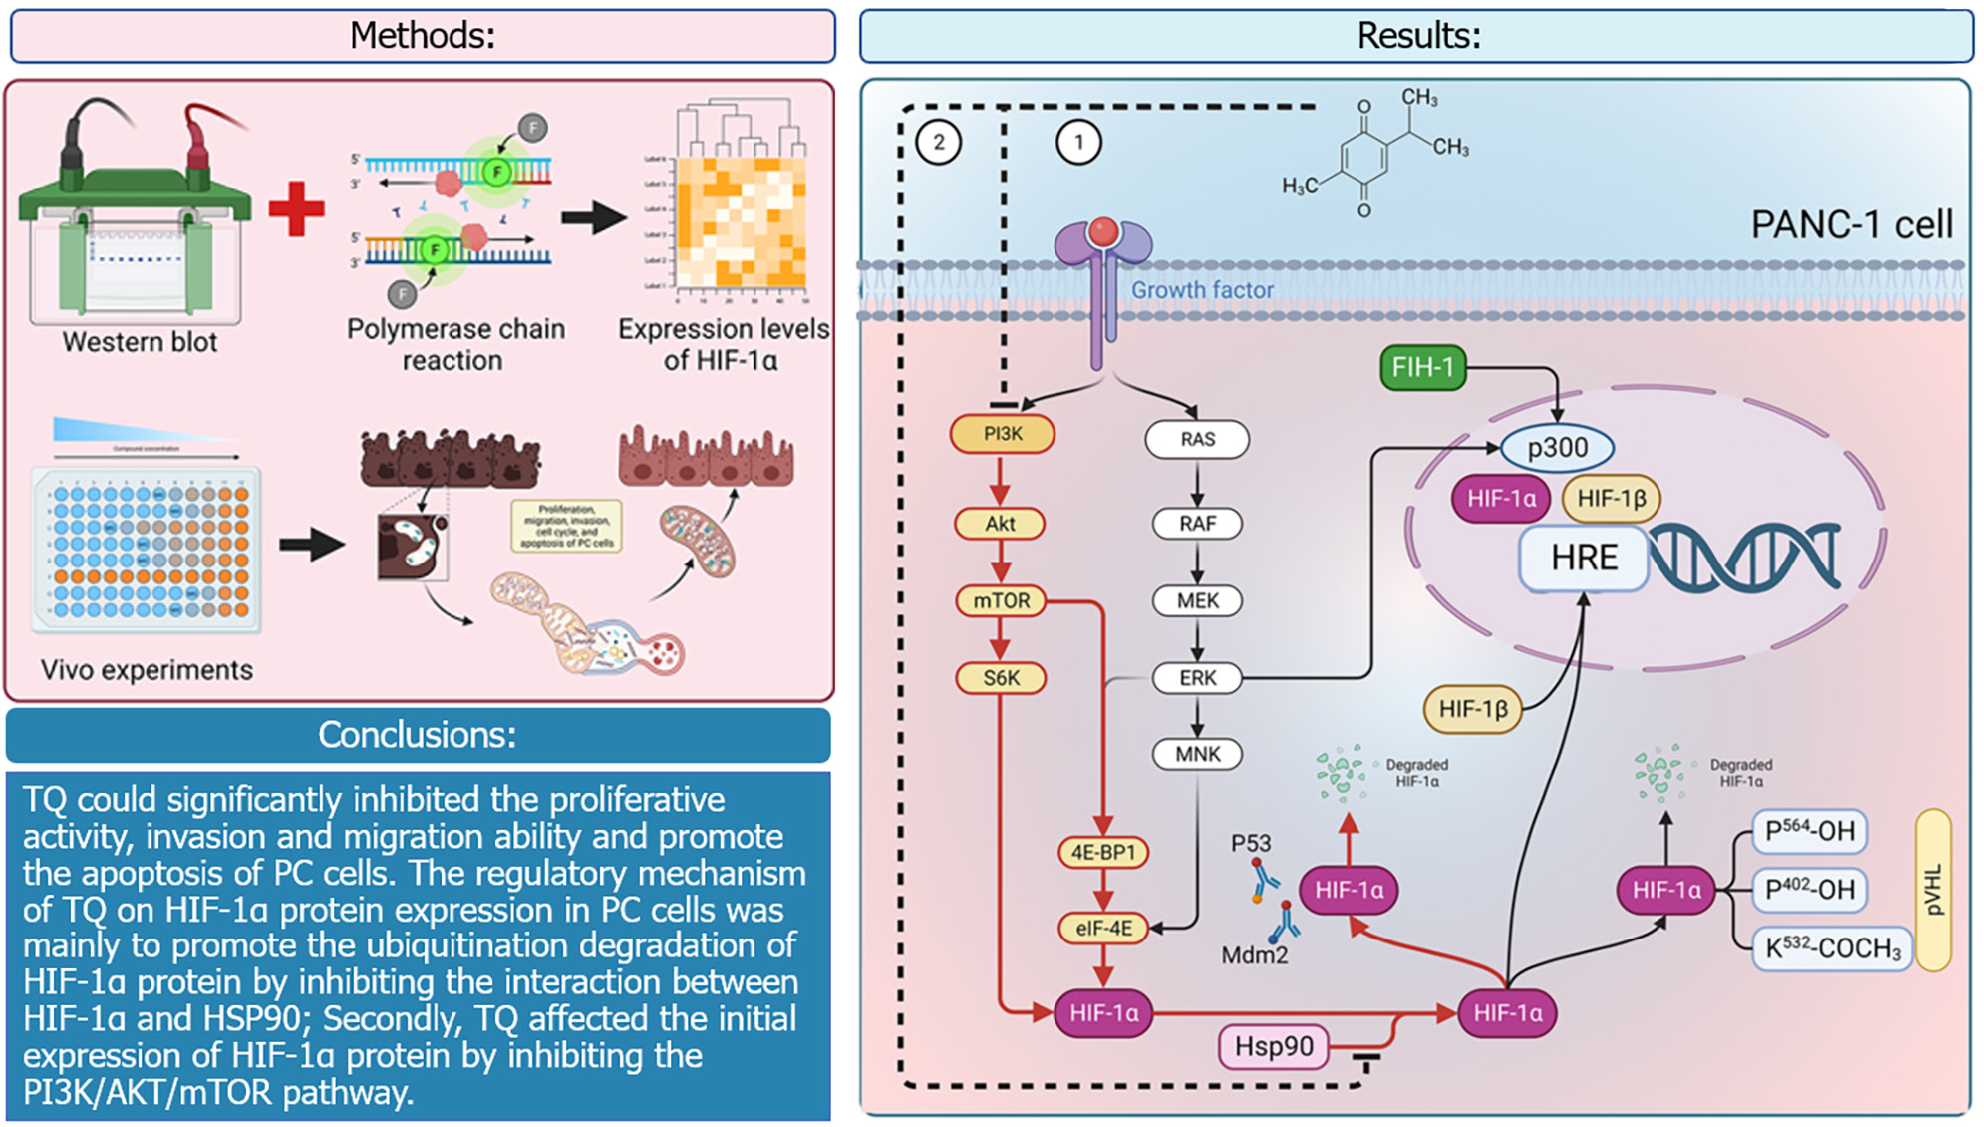
Figure 15 Full text summary.
HIF-1α: Hypoxia-inducible factor-1α; HIF-1β: Hypoxia-inducible factor-1β; PI3K: Phosphatidyl inositol-4,5-bisphosphate-3-kinase; Akt: Protein kinase B; mTOR: Mammalian target of rapamycin; 4E-BP1: Eukaryotic translation initiation factor 4E binding protein 1; eIF-4E: Eukaryotic translation initiation factor 4E; S6K: S6 kinase; Ras: Rat sarcoma; Raf: Rapidly accelerated fibrosarcoma; MAPK: Mitogen-activated protein kinases; ERK: Extracellular signal-regulated kinase; MEK: Mitogen extracellular signal-regulated kinas; MNK: MAP kinase interacting kinase; HRE: Hypoxia response elements; HSP90: Heat shock protein 90; pVHL: von Hippel-Lindau protein; Mdm2: Murine double-minute 2.
- Citation: Zhao ZX, Li S, Liu LX. Thymoquinone affects hypoxia-inducible factor-1α expression in pancreatic cancer cells via HSP90 and PI3K/AKT/mTOR pathways. World J Gastroenterol 2024; 30(21): 2793-2816
- URL: https://www.wjgnet.com/1007-9327/full/v30/i21/2793.htm
- DOI: https://dx.doi.org/10.3748/wjg.v30.i21.2793


