Copyright
©The Author(s) 2024.
World J Gastroenterol. Jun 7, 2024; 30(21): 2763-2776
Published online Jun 7, 2024. doi: 10.3748/wjg.v30.i21.2763
Published online Jun 7, 2024. doi: 10.3748/wjg.v30.i21.2763
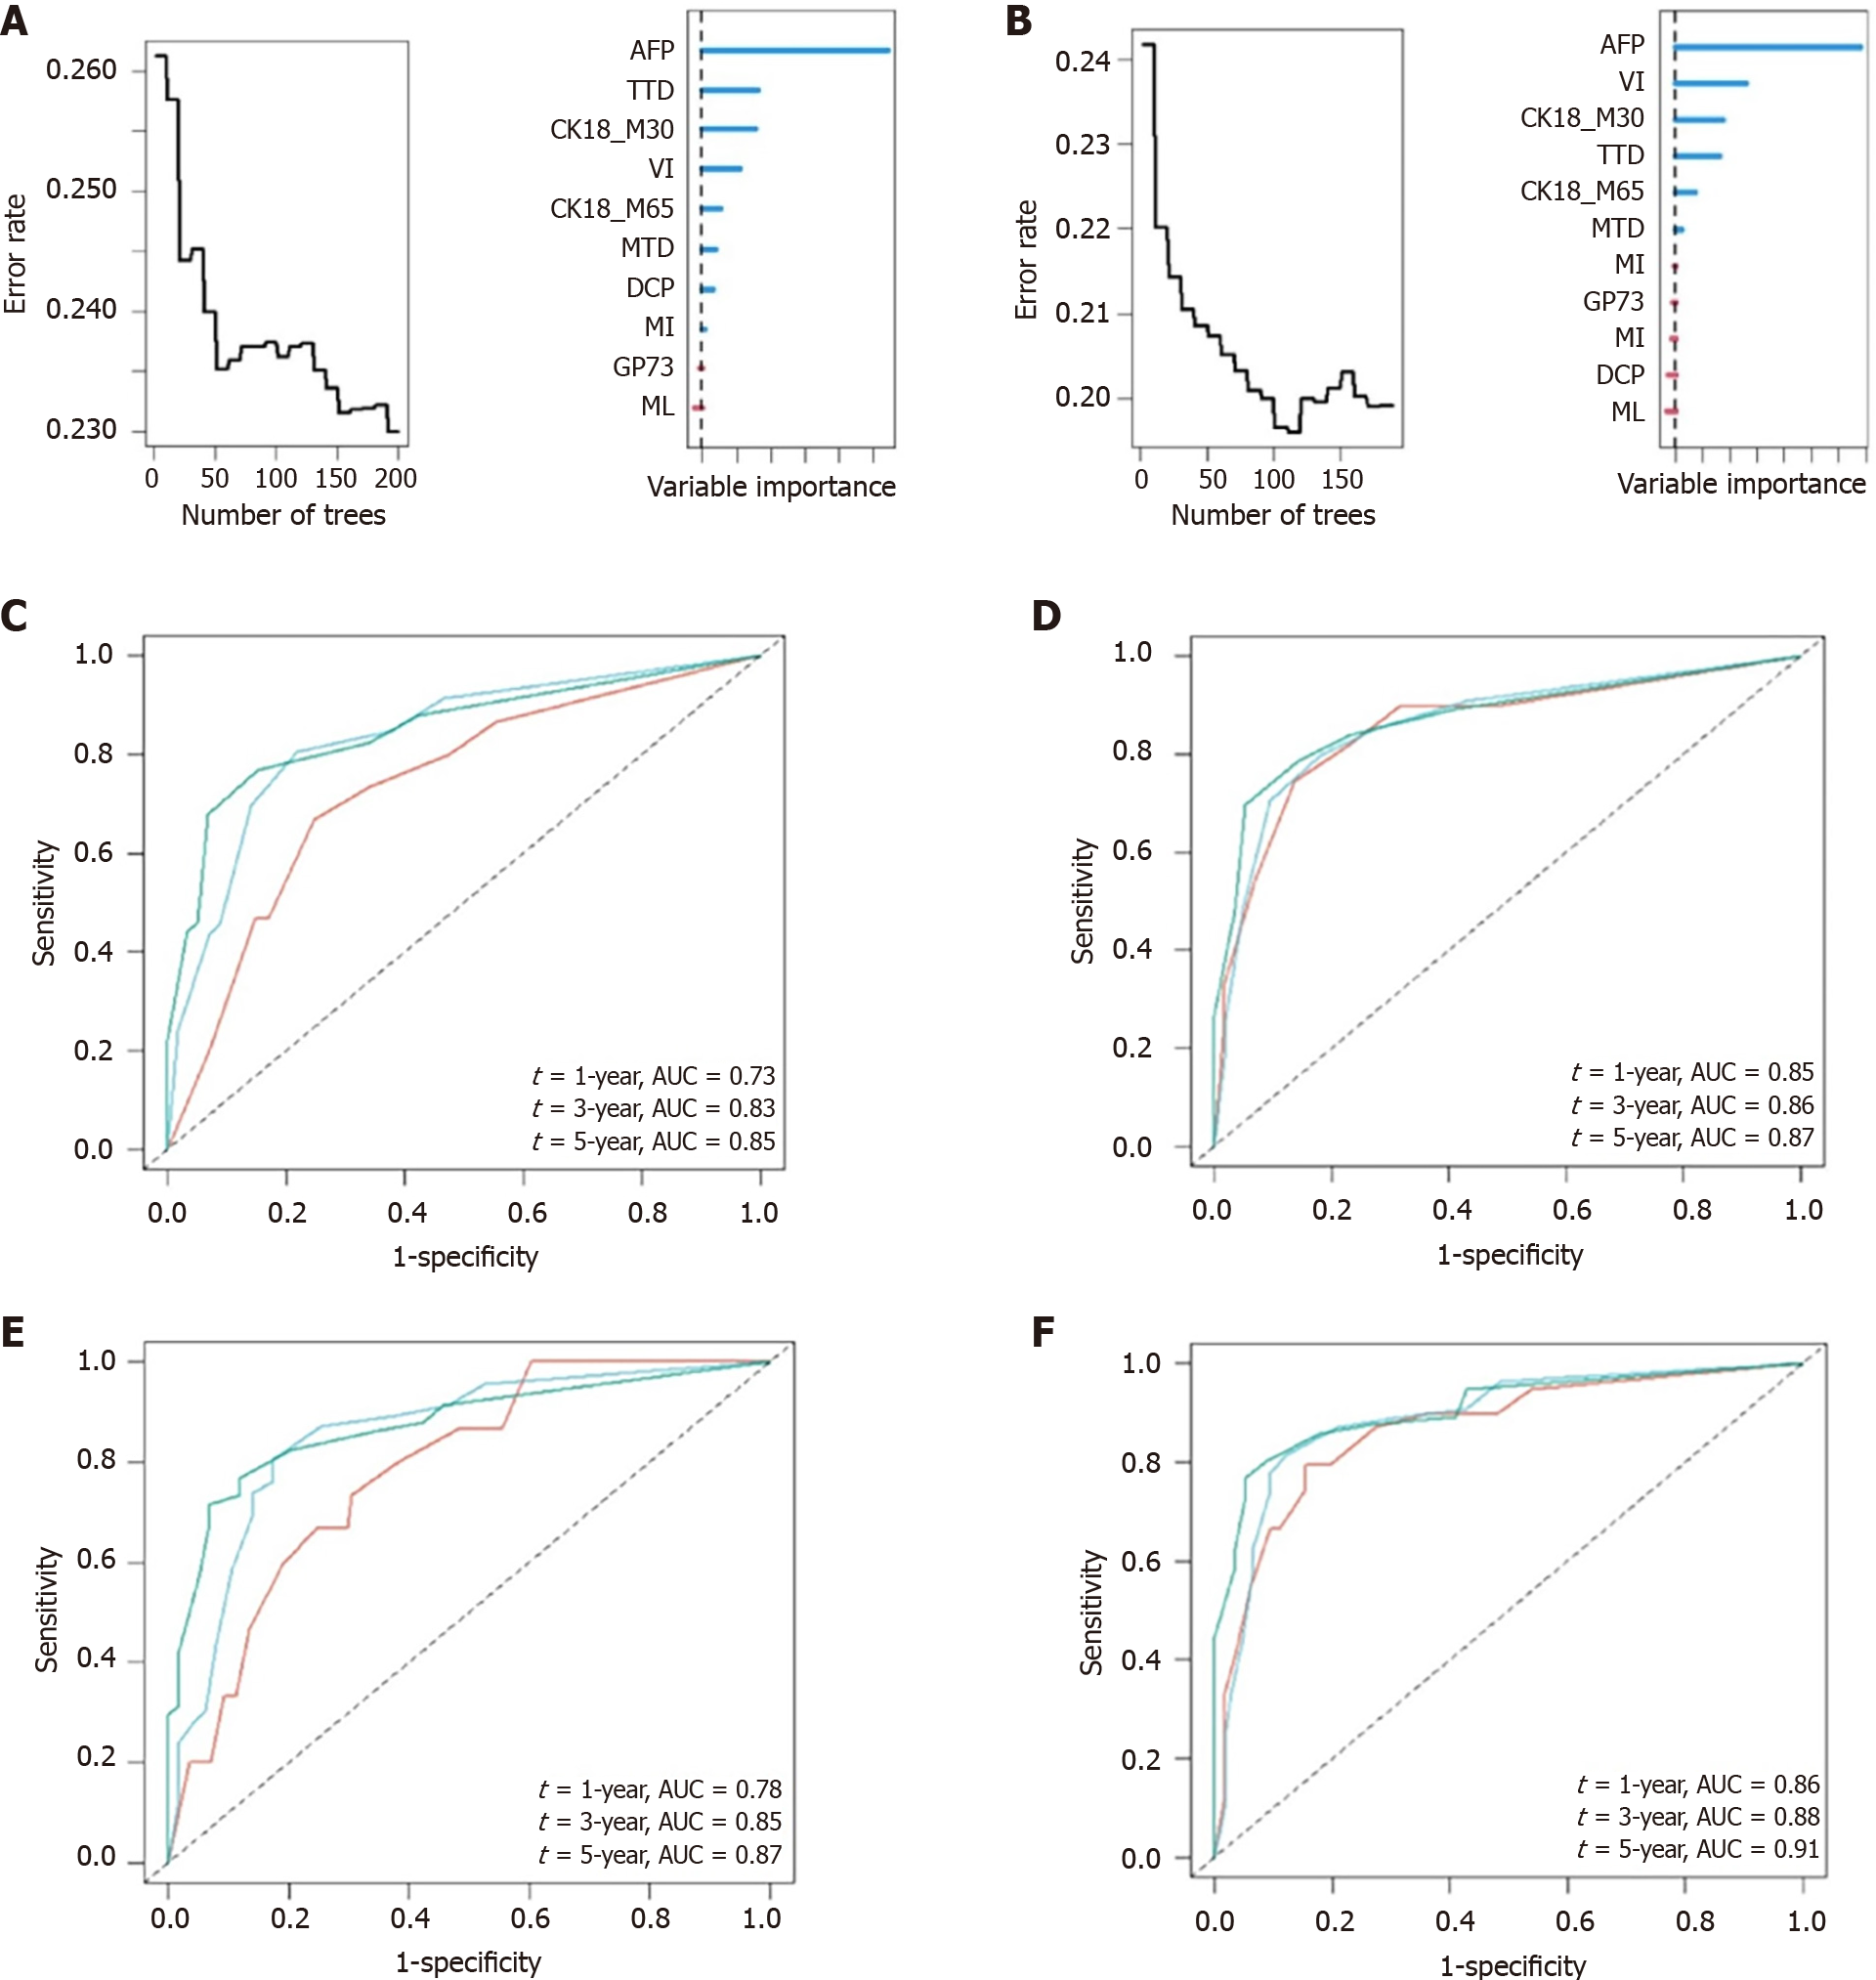
Figure 1 Selection of the variables of random forest model and the time dependence area under the curve of the models.
A: Number of best trees and variable importance plots obtained from the random forest method for overall survival (OS); B: Number of best trees and variable importance plots obtained from the random forest method for recurrence free survival (RFS); C: The area under the curve (AUC) of 1, 3, and 5 years of the cox model for OS; D: The AUC of 1, 3, and 5 years of the cox model for RFS; E: The AUC of 1, 3, and 5 years of the forest model for OS; F: The AUC of 1, 3, and 5 years of the forest model for RFS. AFP: Alpha-fetoprotein; TTD: Total tumor diameter; VI: Vascular invasion; CK18: Cytokeratin-18; MTD: Maximum tumor diameter; DCP: Des-gamma-carboxy prothrombin; MI: Membrane invasion; GP73: Golgi protein 73; ML: Microsatellite lesions; AUC: Area under the curve.
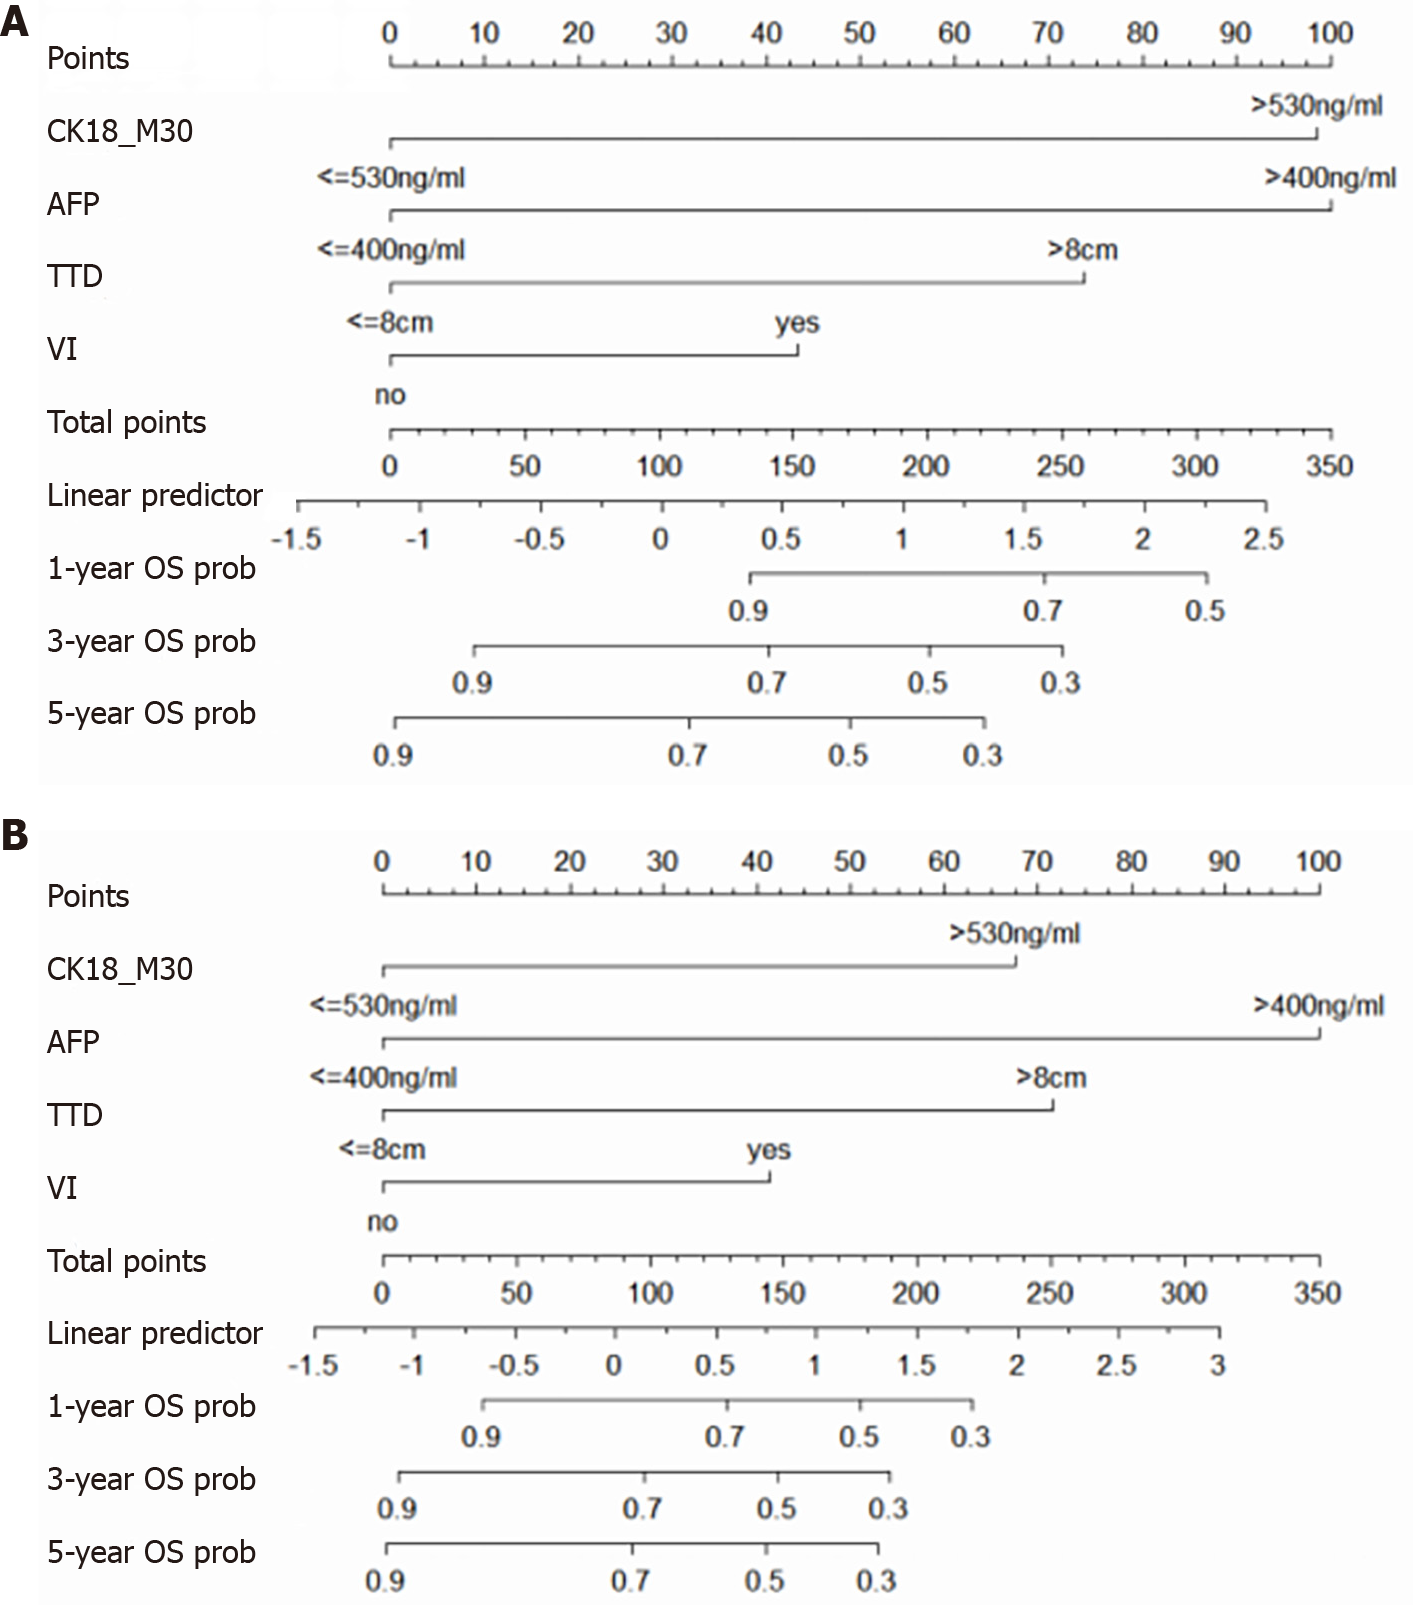
Figure 2 The construction of the nomogram.
A: The nomogram of predicting overall survival after liver transplantation (LT); B: The nomogram of predicting hepatocellular carcinoma recurrence free survival after LT. AFP: Alpha-fetoprotein; CK18: Cytokeratin-18; TTD: Total tumor diameter; VI: Vascular invasion; OS: Overall survival; RFS: Recurrence free survival.
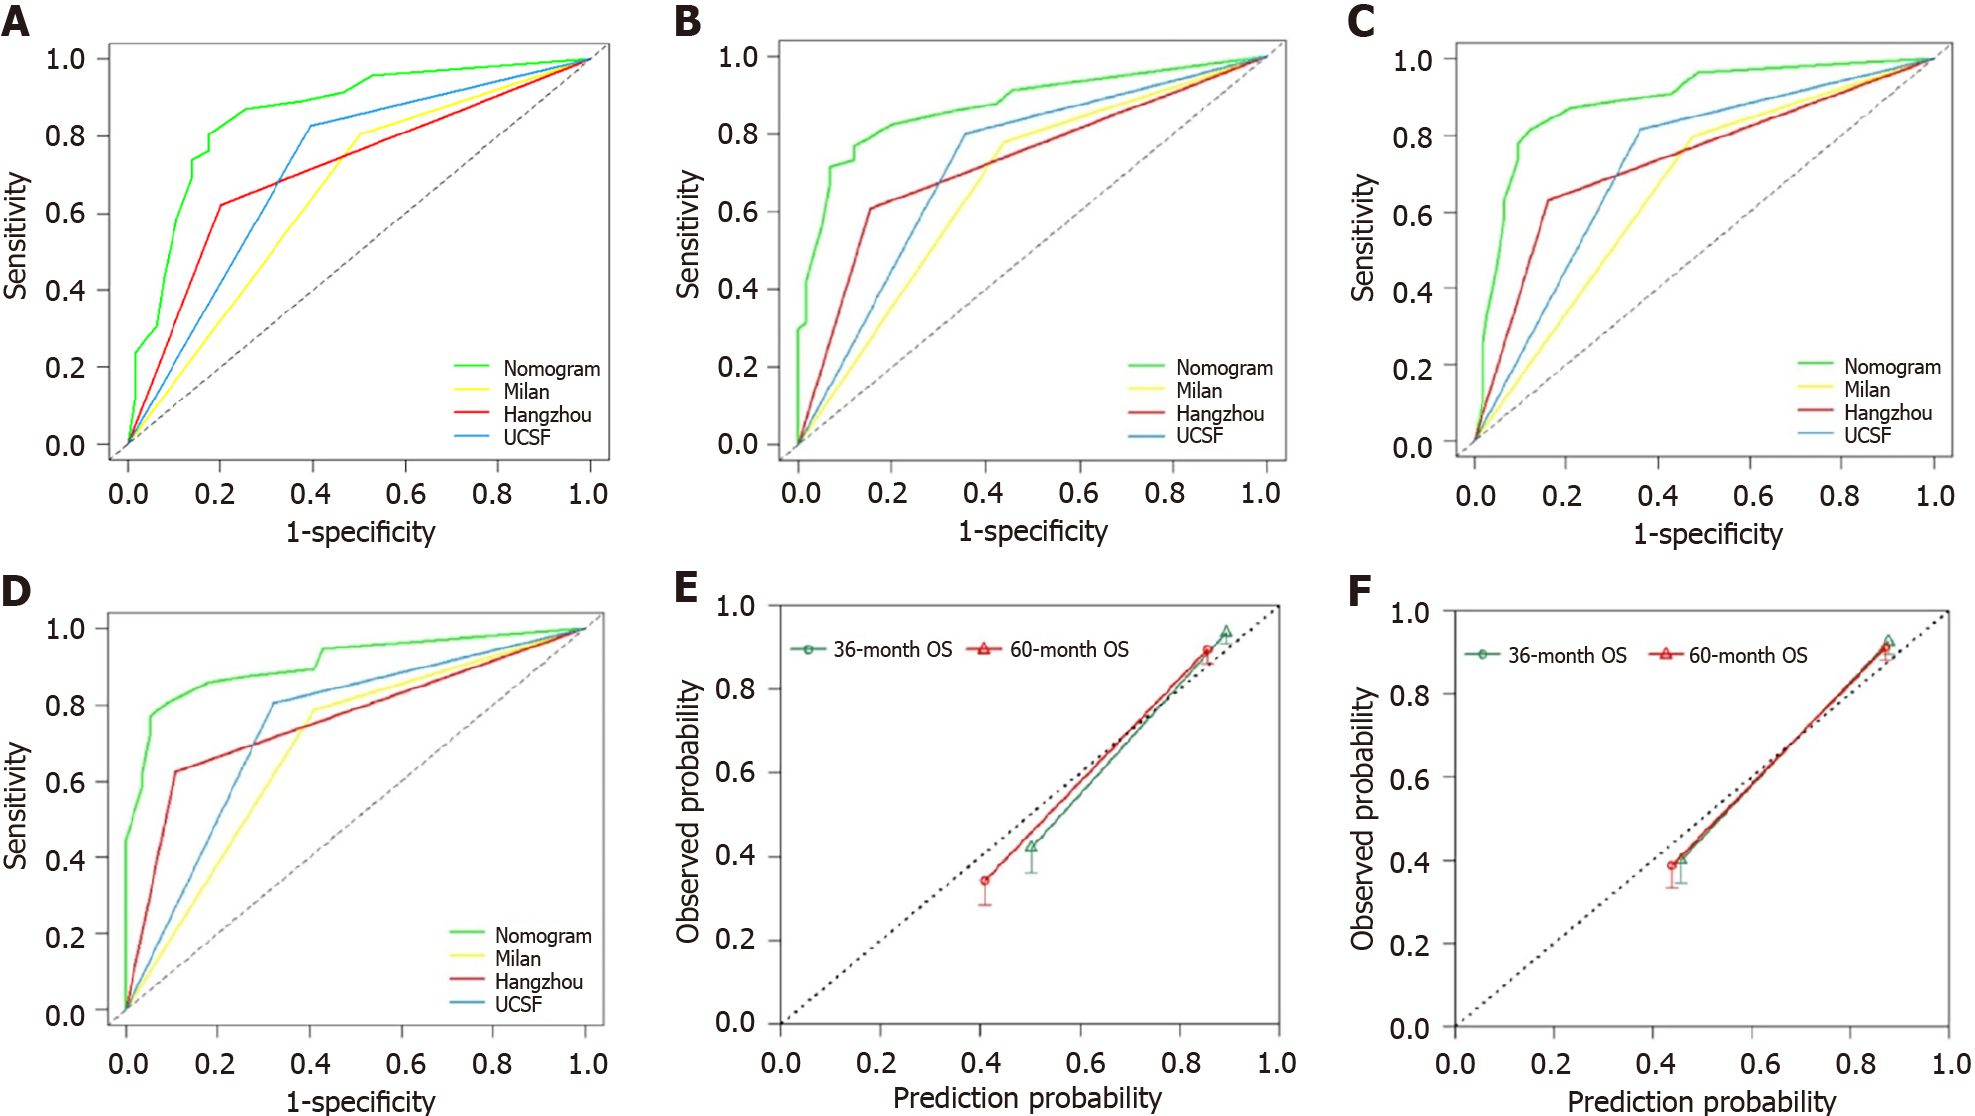
Figure 3 Efficacy comparison of nomogram and existing criteria.
A: The 3-year area under the curve (AUC) of nomogram and Milan, Hangzhou and UCSF for overall survival (OS); B: The 5-year AUC of nomogram and Milan, Hangzhou and UCSF for OS; C: The 3-year AUC of nomogram and Milan, Hangzhou, UCSF for recurrence free survival (RFS); D: The 5-year AUC of nomogram and Milan, Hangzhou, UCSF for RFS; E: The calibration curve of nomogram for OS; F: The calibration curve of nomogram for RFS. OS: Overall survival; RFS: Recurrence free survival.
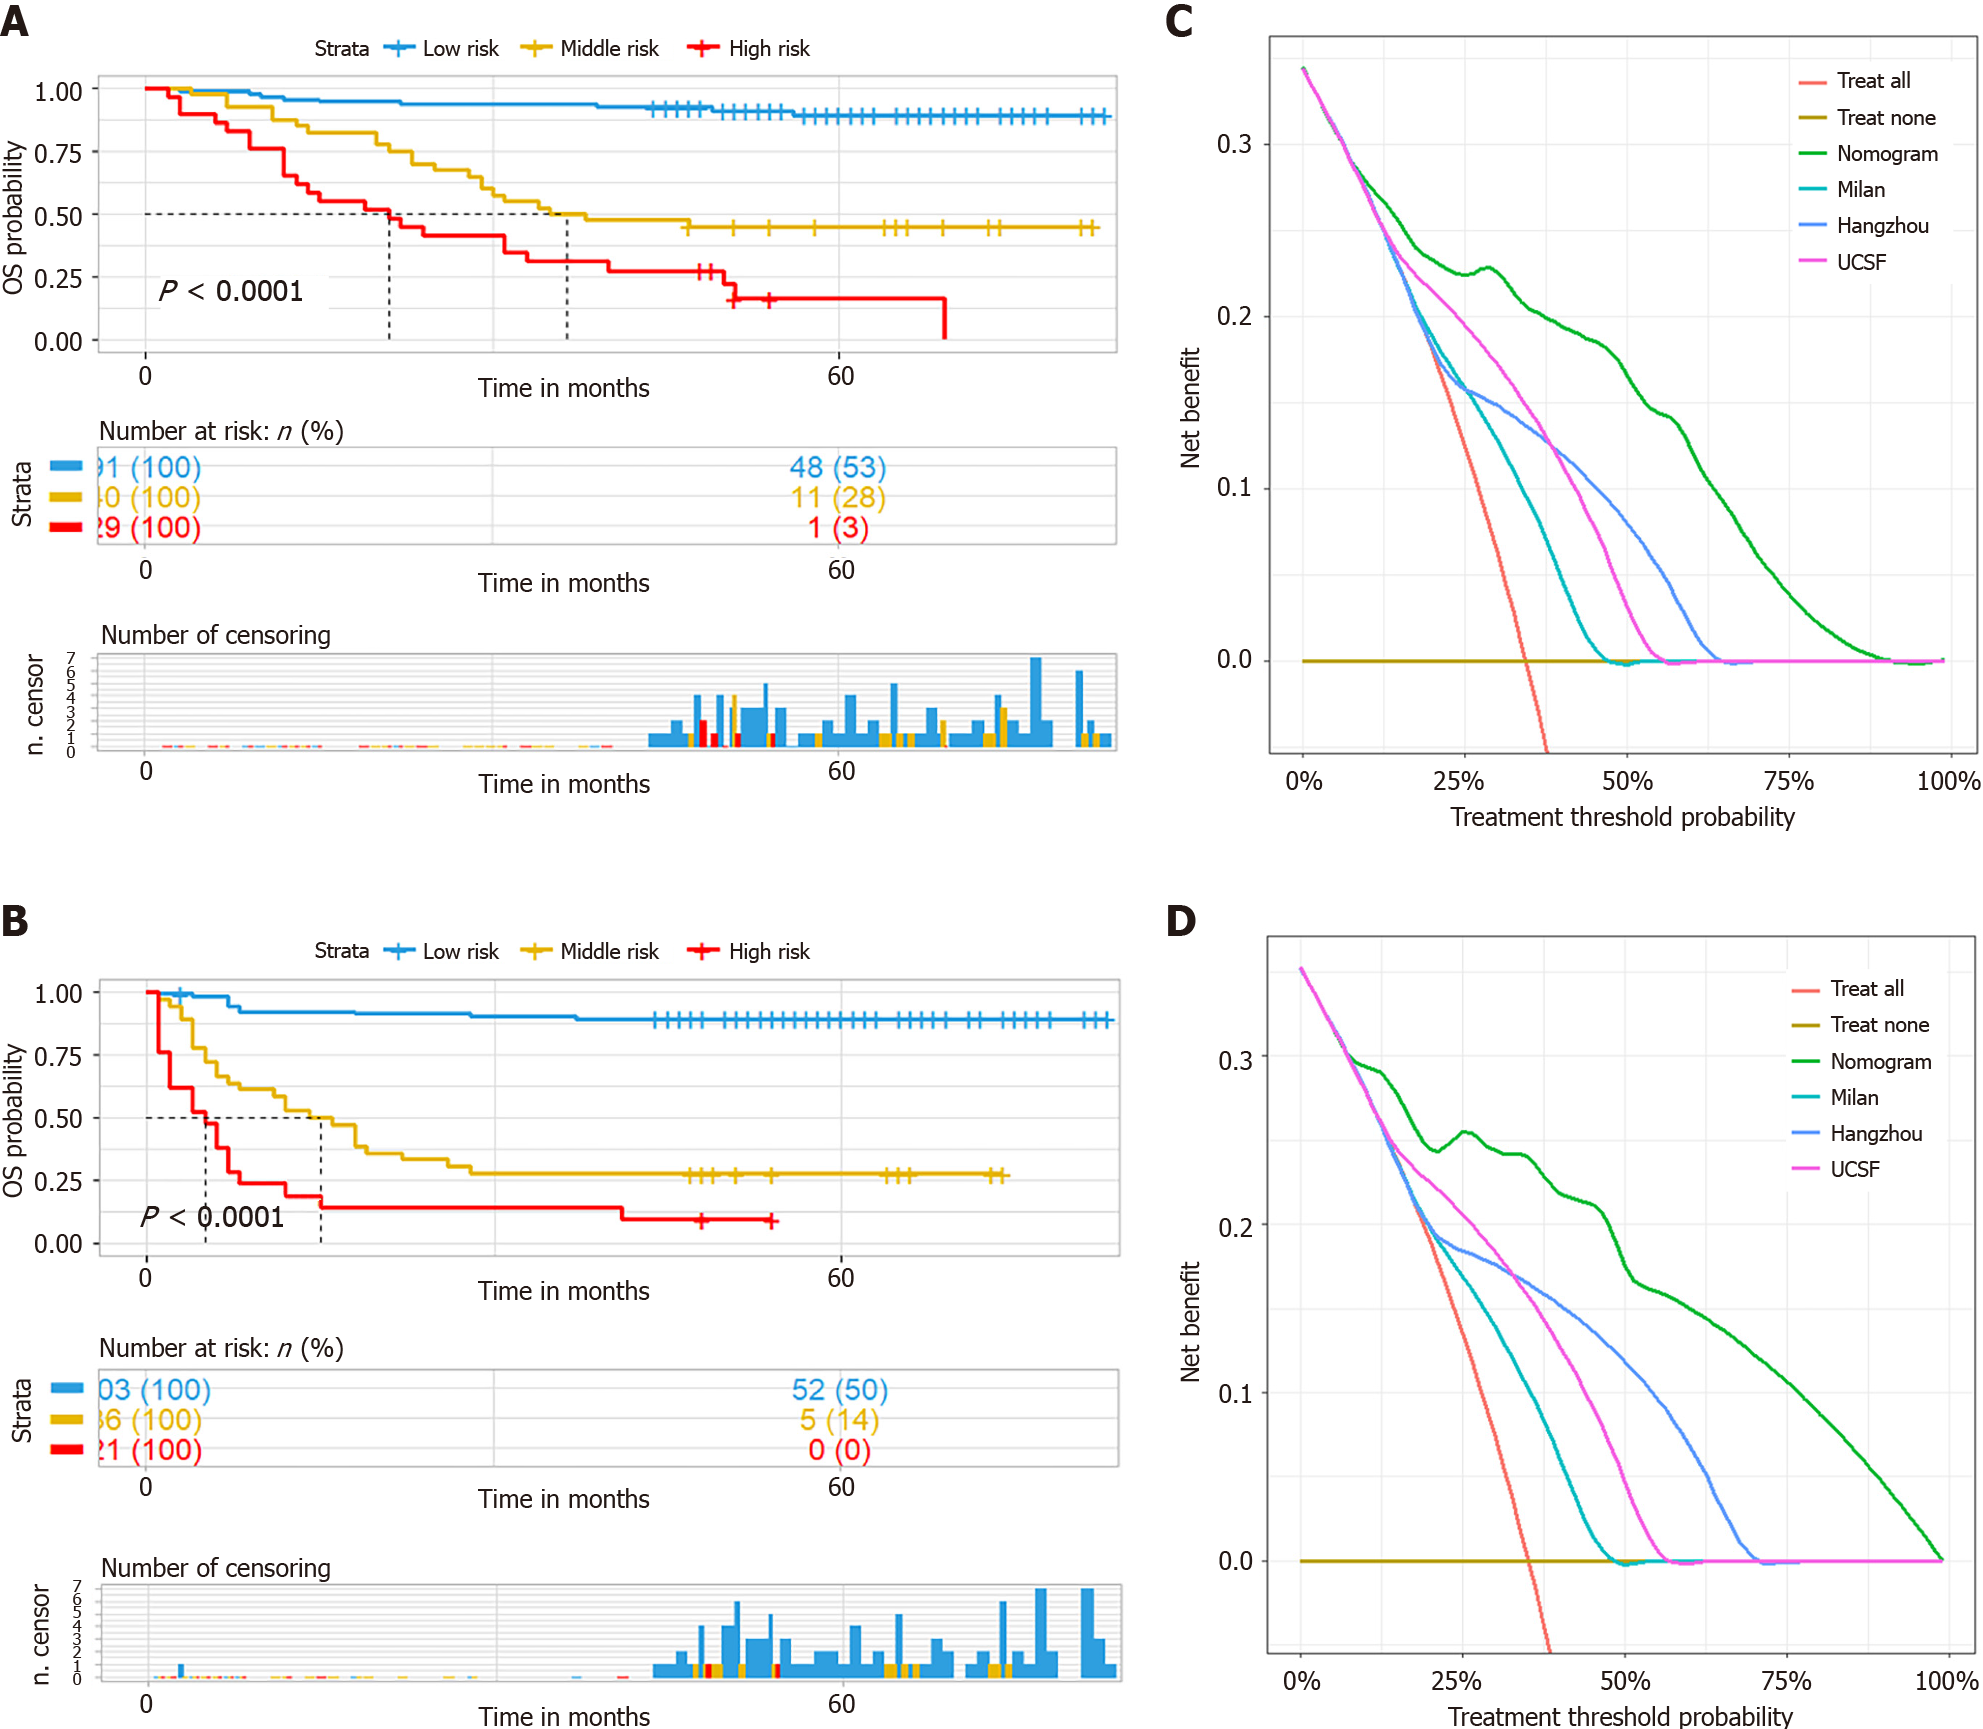
Figure 4 Survival analysis of nomogram and clinical efficacy analysis.
A: The survival curve for overall survival (OS); B: The survival curve for recurrence free survival (RFS); C: The decision curve analysis (DCA) curve for OS; D: The DCA curve for RFS.
- Citation: He L, Ji WS, Jin HL, Lu WJ, Zhang YY, Wang HG, Liu YY, Qiu S, Xu M, Lei ZP, Zheng Q, Yang XL, Zhang Q. Development of a nomogram for predicting liver transplantation prognosis in hepatocellular carcinoma. World J Gastroenterol 2024; 30(21): 2763-2776
- URL: https://www.wjgnet.com/1007-9327/full/v30/i21/2763.htm
- DOI: https://dx.doi.org/10.3748/wjg.v30.i21.2763


