Copyright
©The Author(s) 2024.
World J Gastroenterol. May 28, 2024; 30(20): 2709-2725
Published online May 28, 2024. doi: 10.3748/wjg.v30.i20.2709
Published online May 28, 2024. doi: 10.3748/wjg.v30.i20.2709
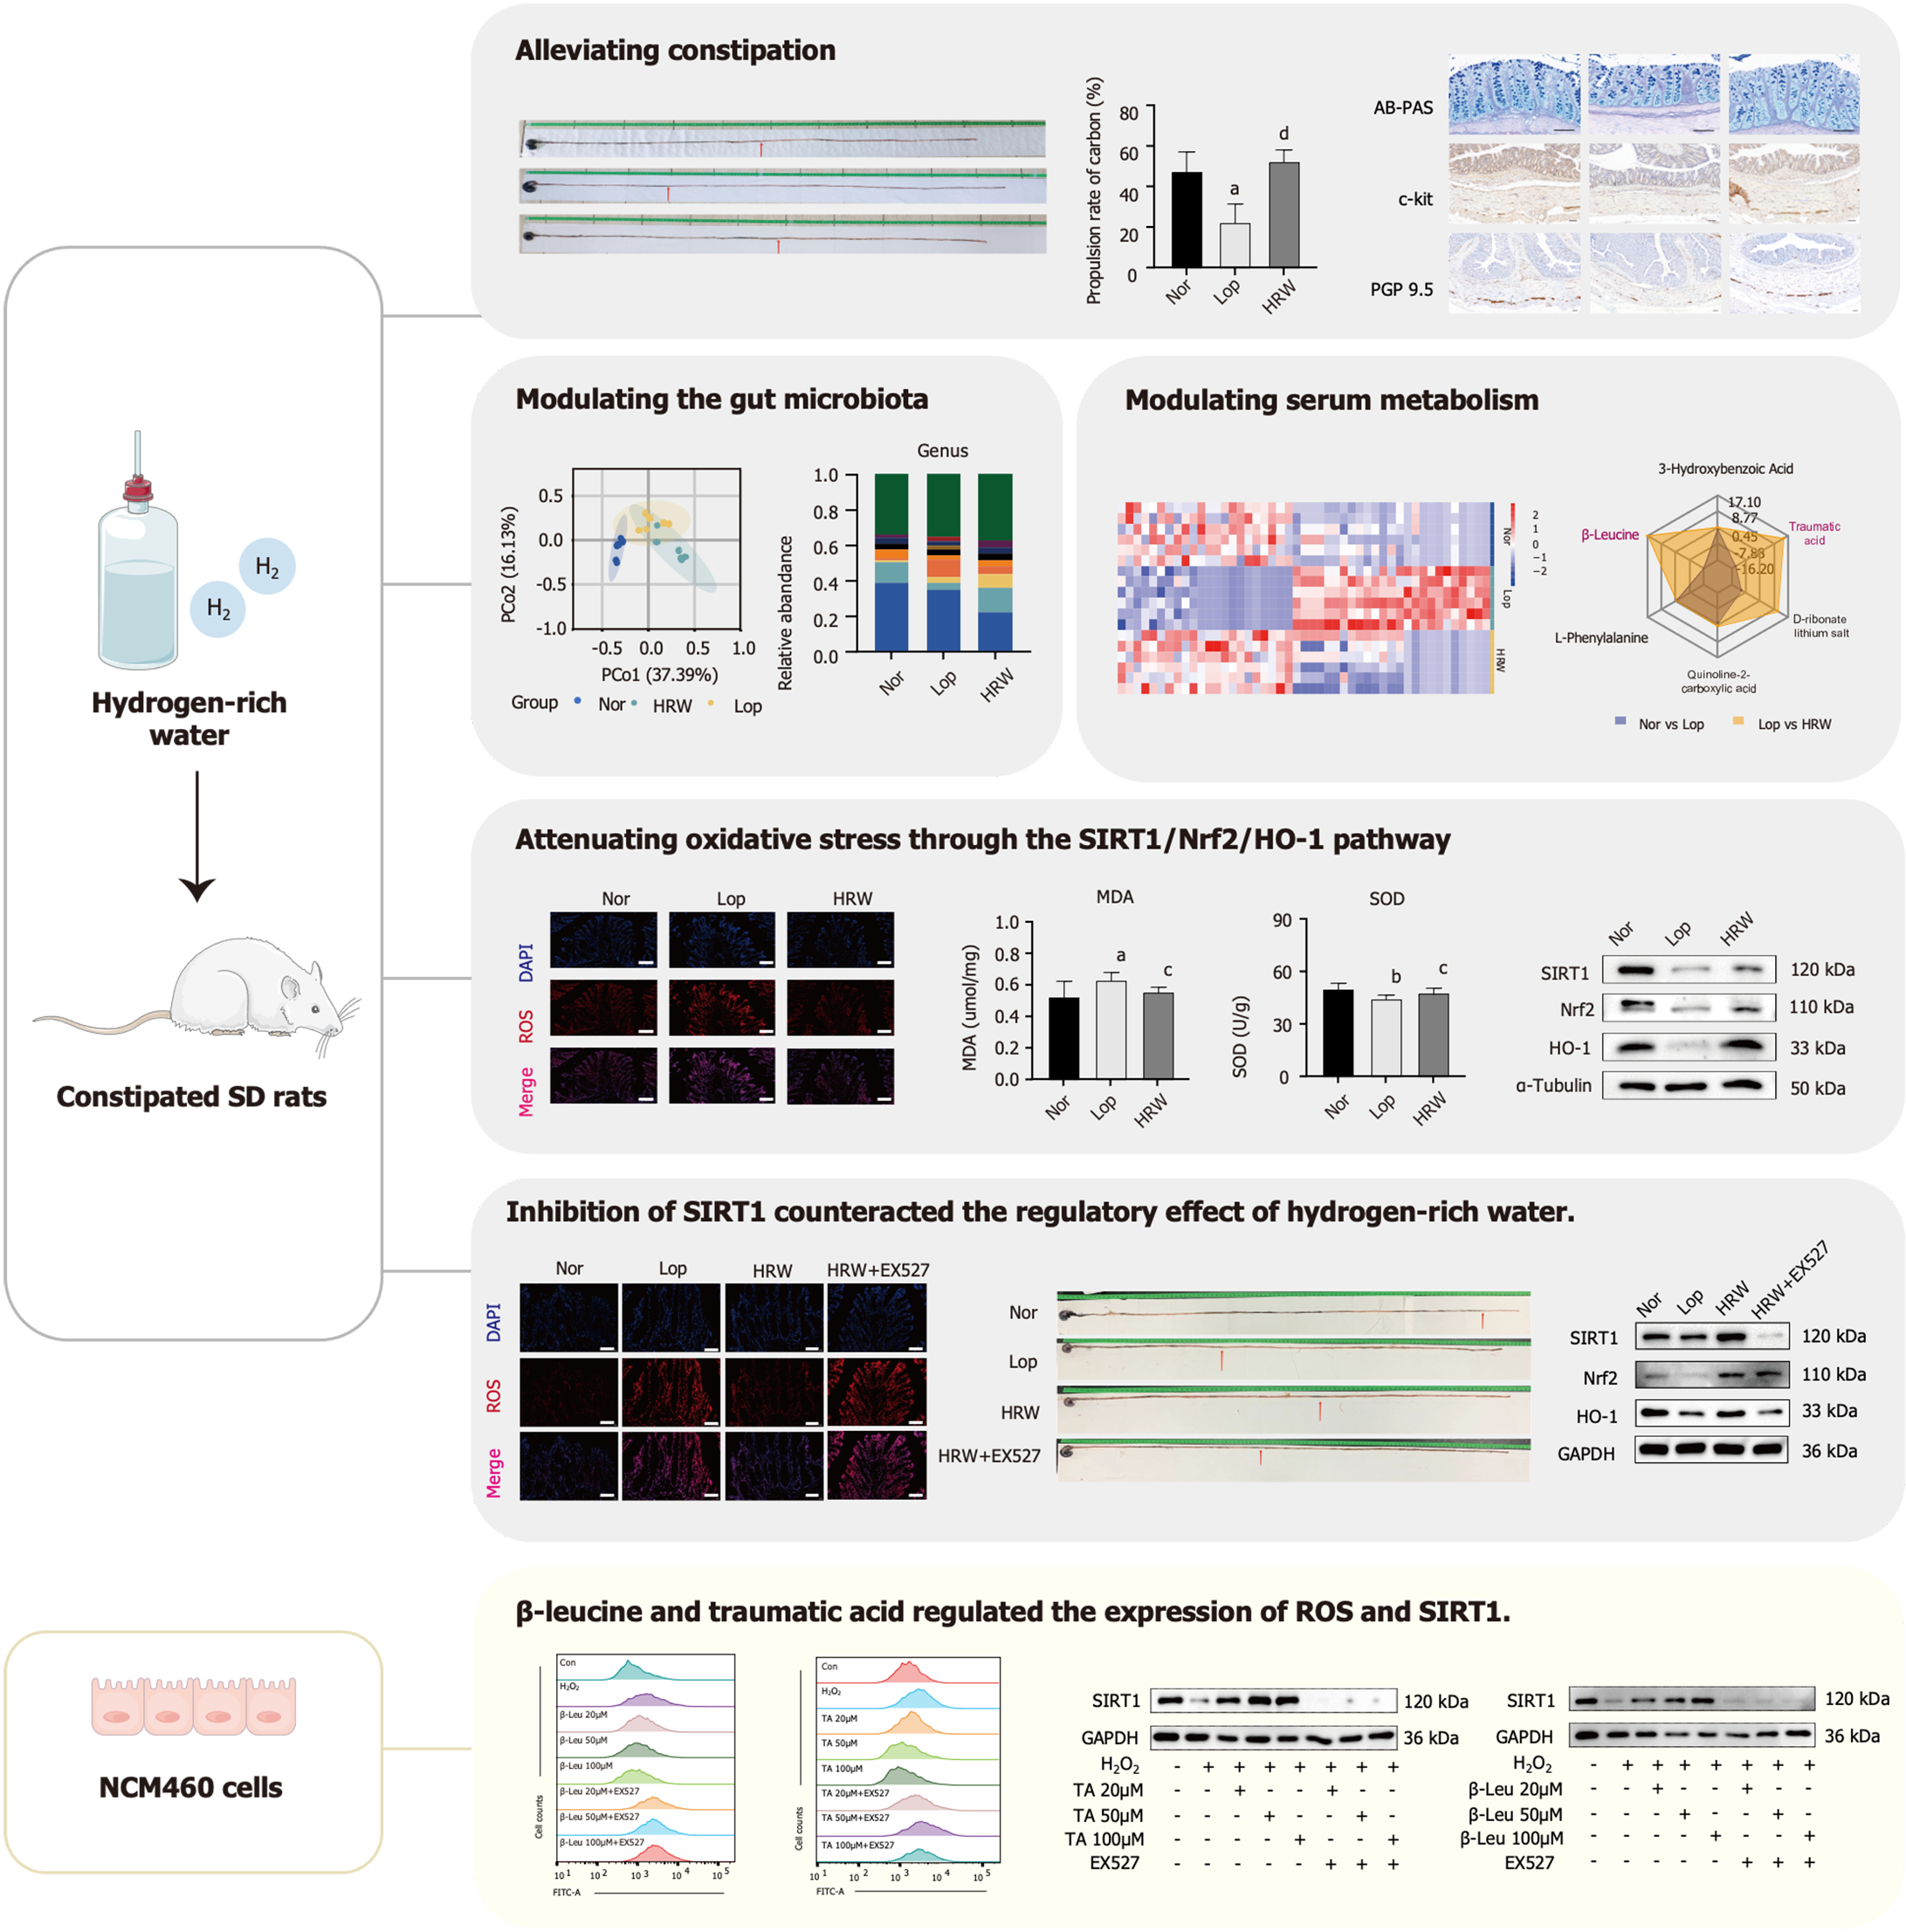
Figure 1 Overview of the workflow.
Nor: Normal group; Lop: Loperamide-induced constipation group; HRW: Hydrogen-rich water intervention group; SIRT1: Sirtuin1; Nrf2: Nuclear factor-erythroid-2-related factor 2; HO-1: Heme oxygenase-1; ROS: Reactive oxygen species; MDA: Malondialdehyde; SOD: Superoxide dismutase; AB-PAS: Alcian blue-periodic acid-Schiff; c-kit: Cell growth factor receptor kit; β-Leu: β-leucine; TA: Traumatic acid; SD rats: Sprague-Dawley rats.
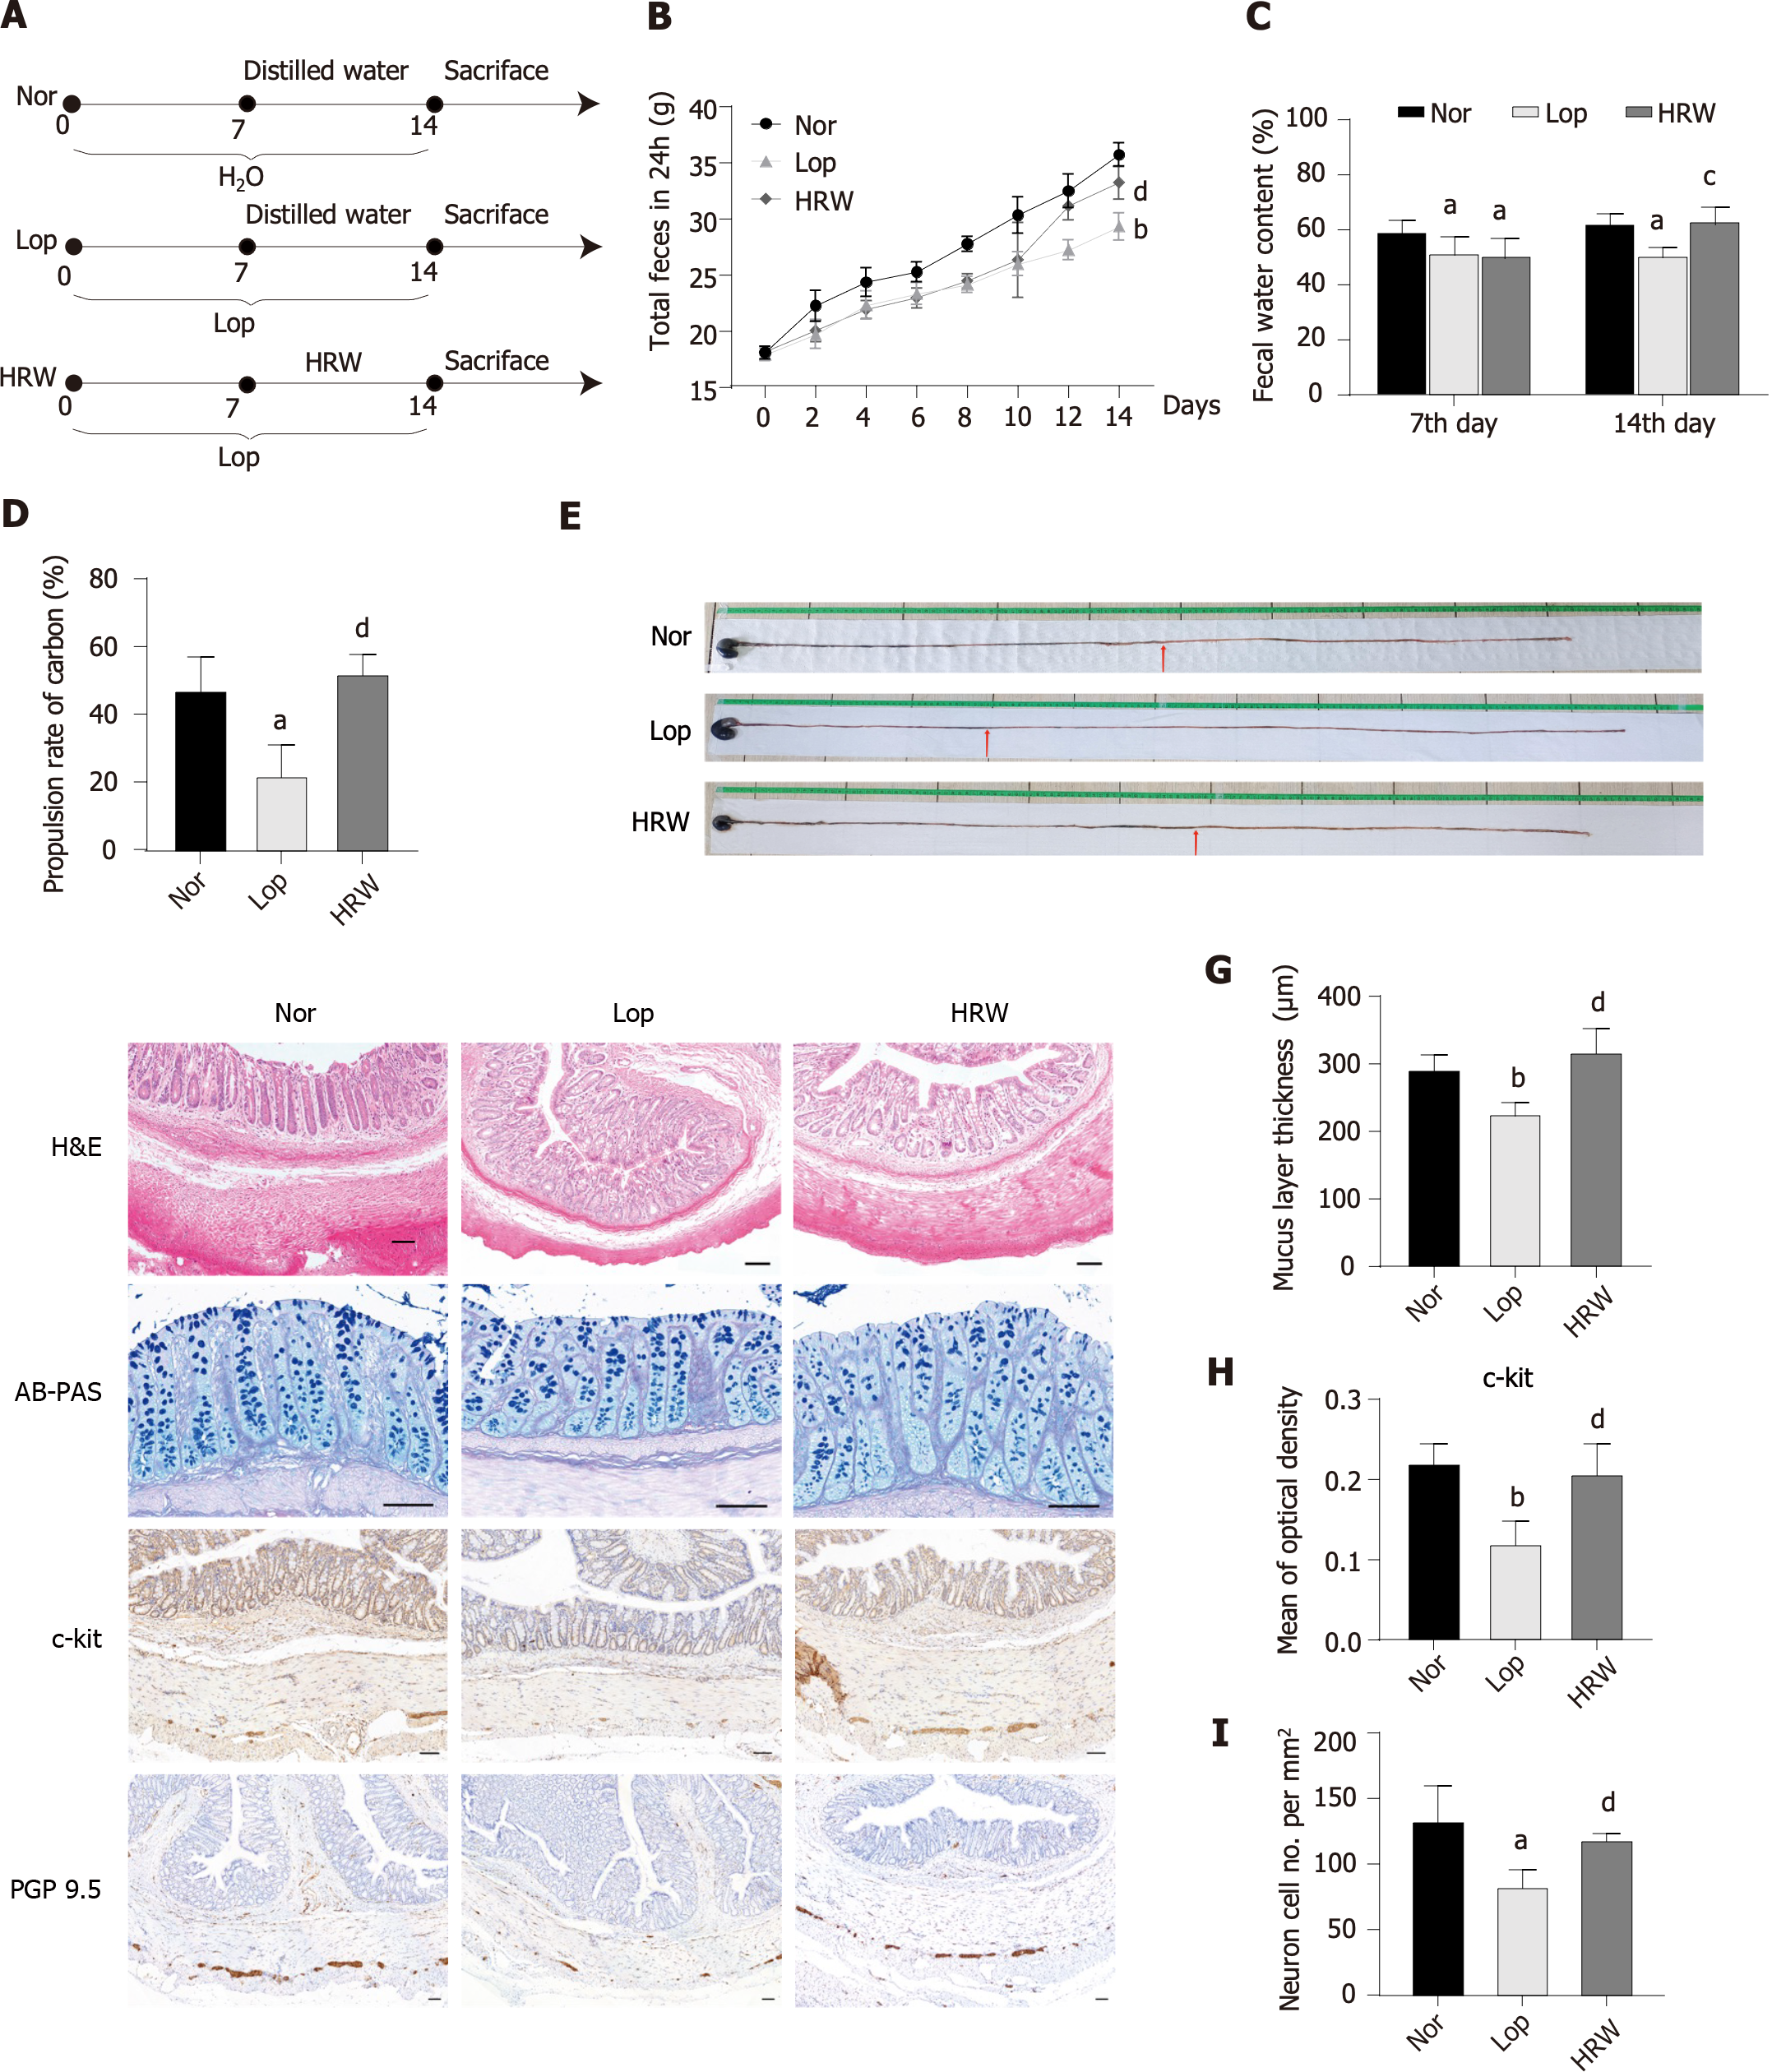
Figure 2 Hydrogen-rich water alleviates loperamide-induced constipation in rats.
A: Flow chart of the establishment of the rat model and drug administration; B: Total feces excreted within 24 h; C: Fecal water content on day 7 and 14; D and E: Propulsion rate of carbon through the small intestine of rats; F: Hematoxylin and eosin staining, Alcian blue-periodic acid-Schiff staining, immunohistochemical staining of cell growth factor receptor kit (c-kit) and PGP 9.5; G: Thickness of the mucus layer; H: Mean optical density of c-kit; I: Number of enteric neurons. aP < 0.05 vs normal group (Nor), bP < 0.01 vs Nor, cP < 0.05 vs loperamide-induced constipation group (Lop), dP < 0.01 vs Lop. Scale bar: 100 μm. Nor: Normal group; Lop: Loperamide-induced constipation group; HRW: Hydrogen-rich water intervention group; H&E: Hematoxylin and eosin; AB-PAS: Alcian blue-periodic acid-Schiff; c-kit: Cell growth factor receptor kit.
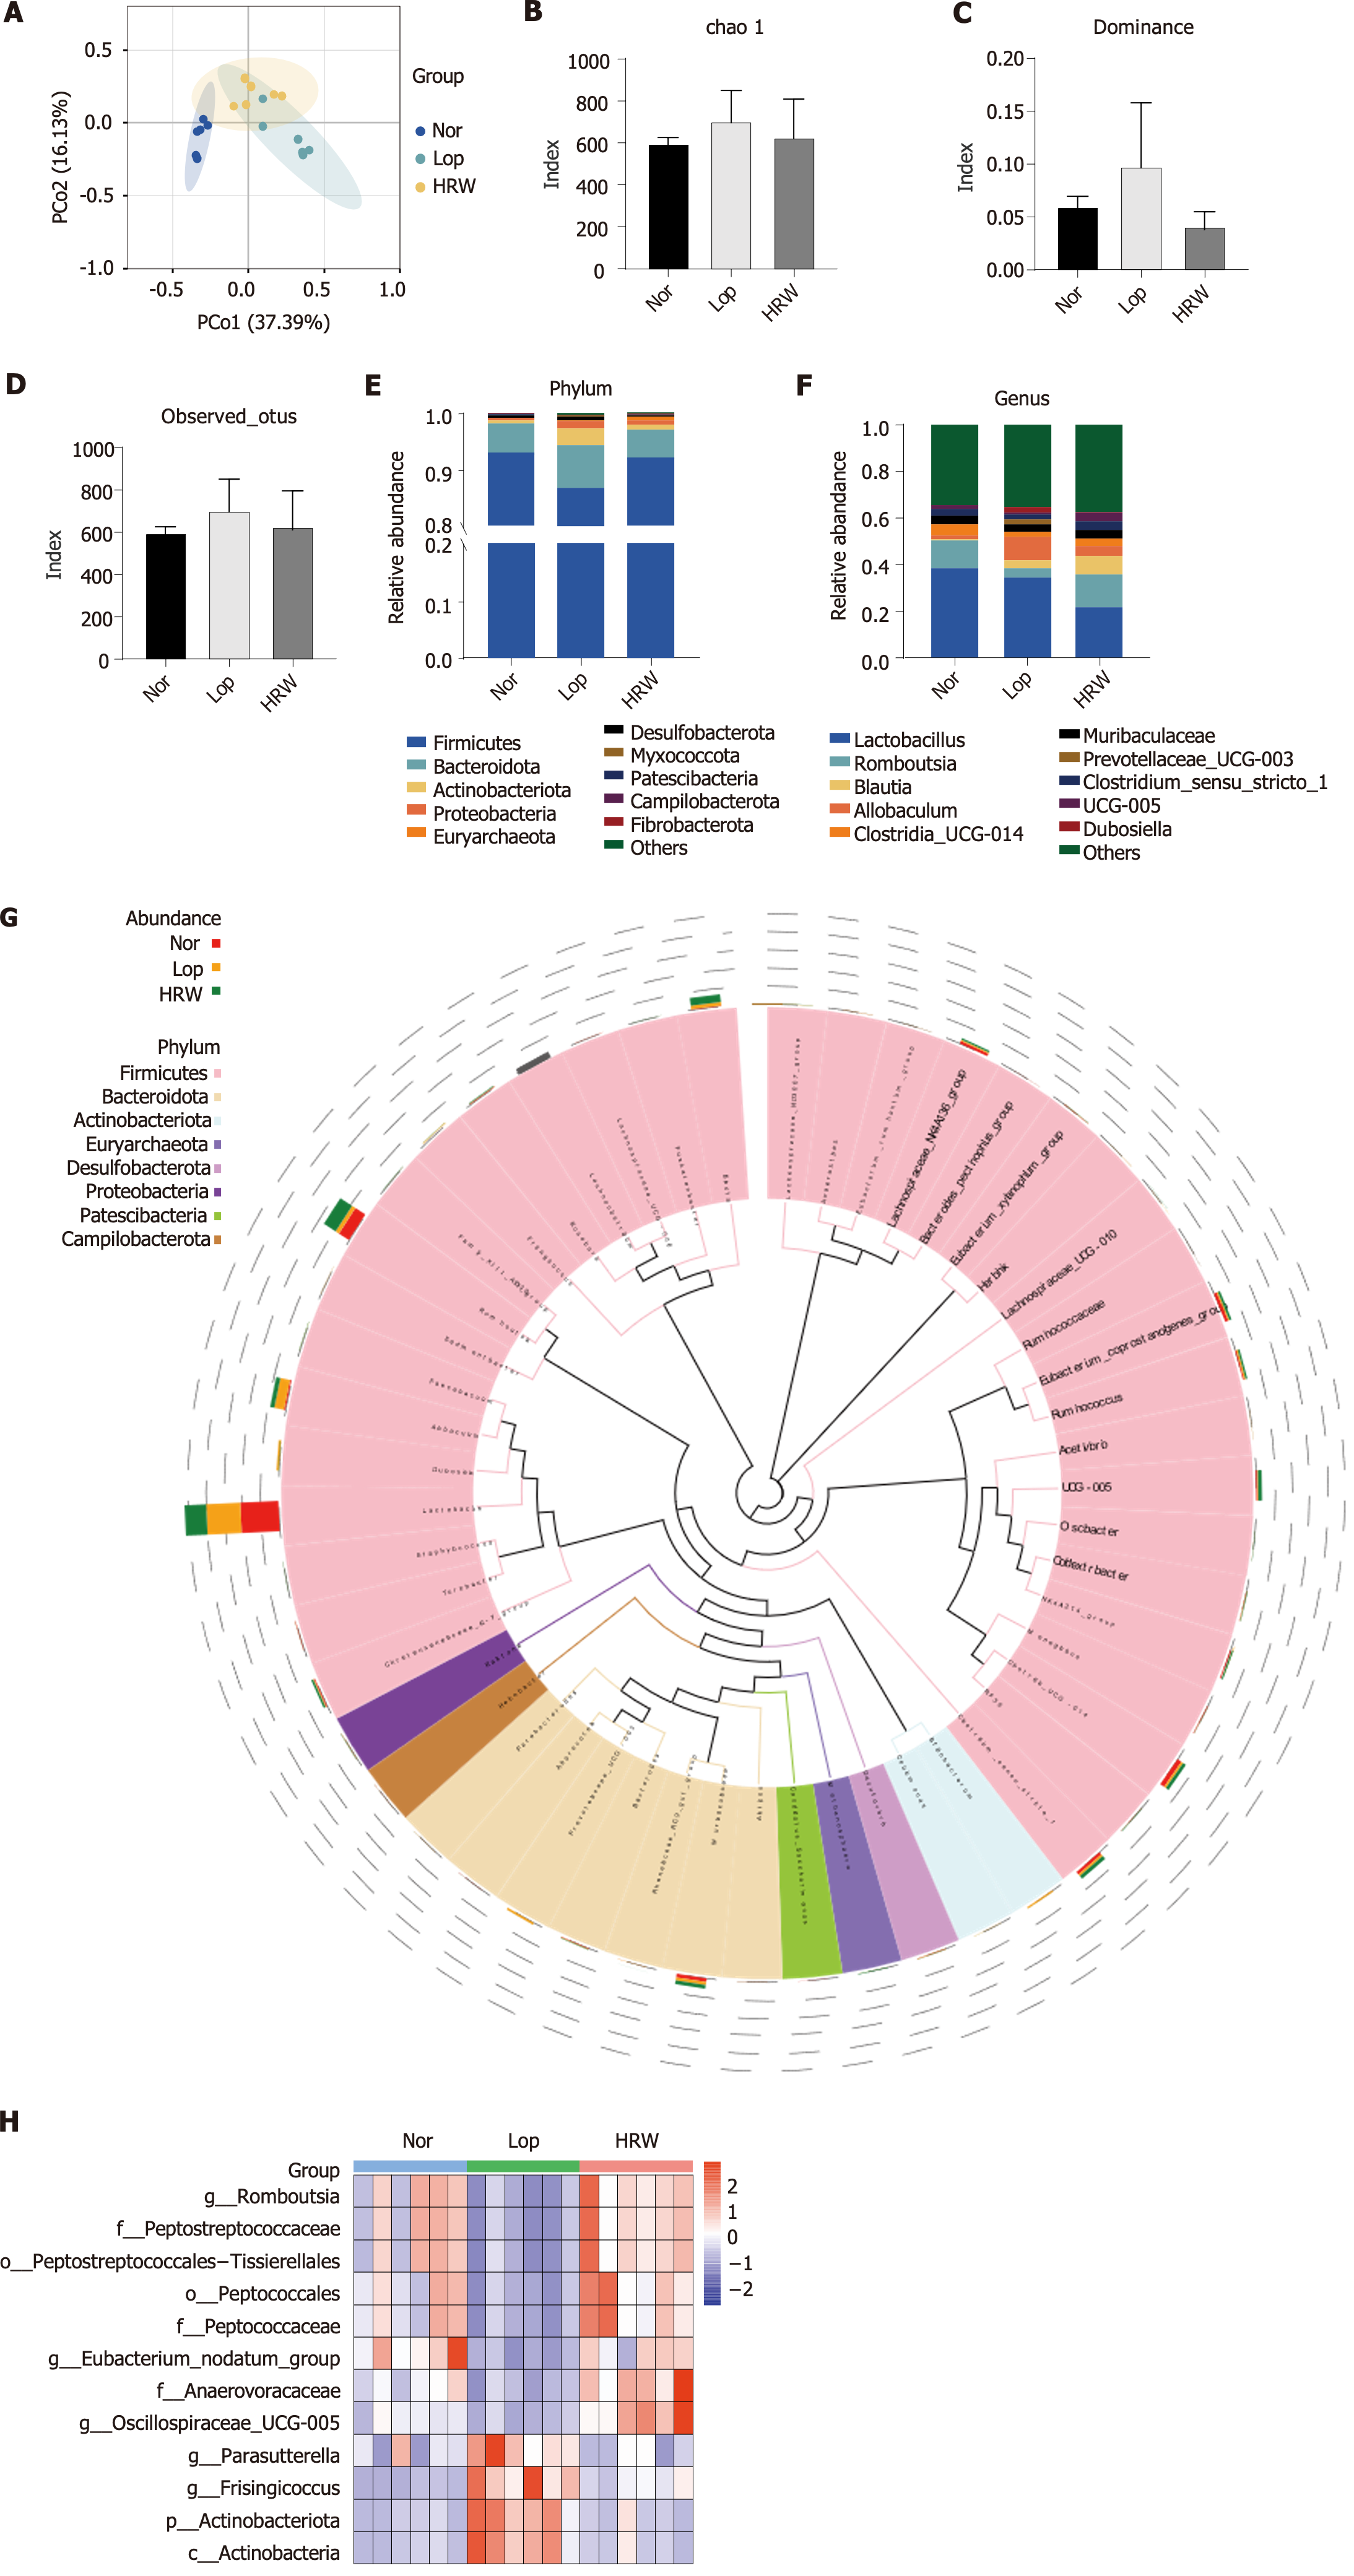
Figure 3 Hydrogen-rich water modulates the gut microbiota in constipated rats.
A: PCoA map of the microbiota; B-D: Alpha diversity index; E and F: Bar plots illustrating species richness at the phylum and genus levels; G: Phylogenetic tree depicting genus-level species; H: Heat map displaying differential flora. Nor: Normal group; Lop: Loperamide-induced constipation group; HRW: Hydrogen-rich water intervention group.
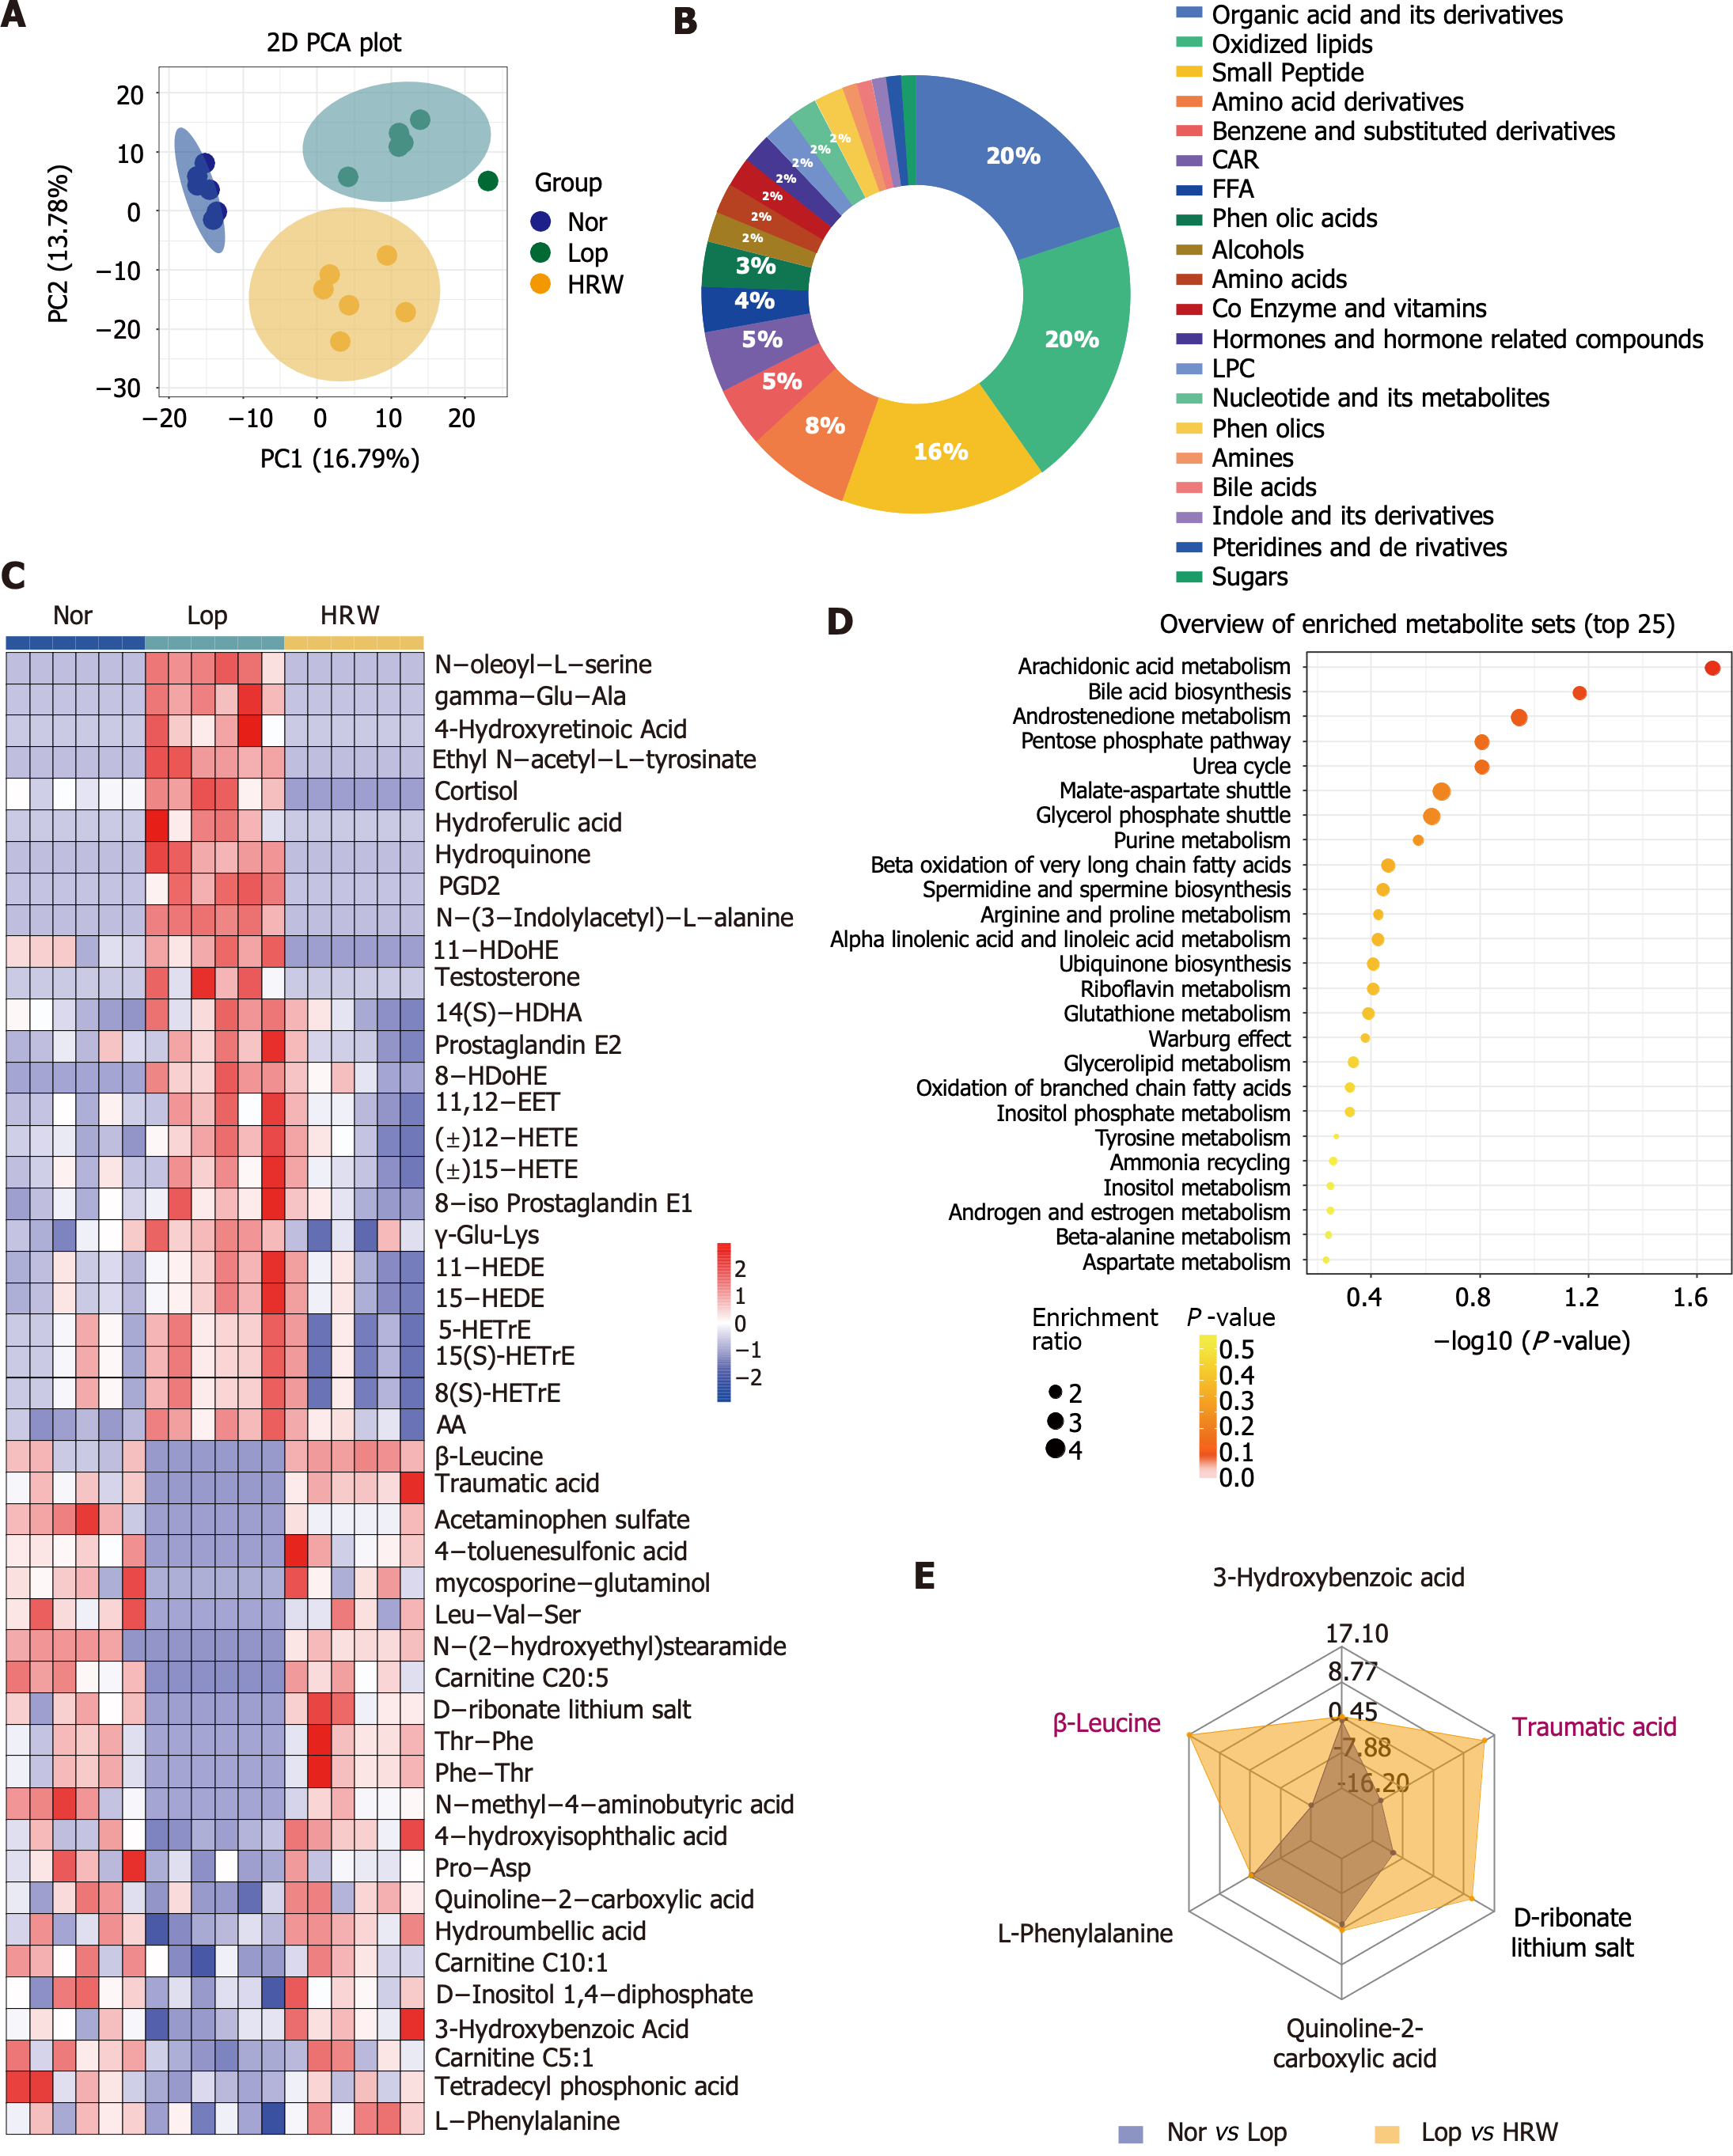
Figure 4 Hydrogen-rich water modulates serum metabolism in constipated rats.
A: PCA plot of metabolites; B: Sector diagram illustrating the secondary classification of differential metabolites; C: Heat map of the differential metabolites; D: Kyoto Encyclopedia of Genes and Genomes enrichment map of the differential metabolites; E: Radar plot depicting the differential metabolites. Nor: Normal group; Lop: Loperamide-induced constipation group; HRW: Hydrogen-rich water intervention group.
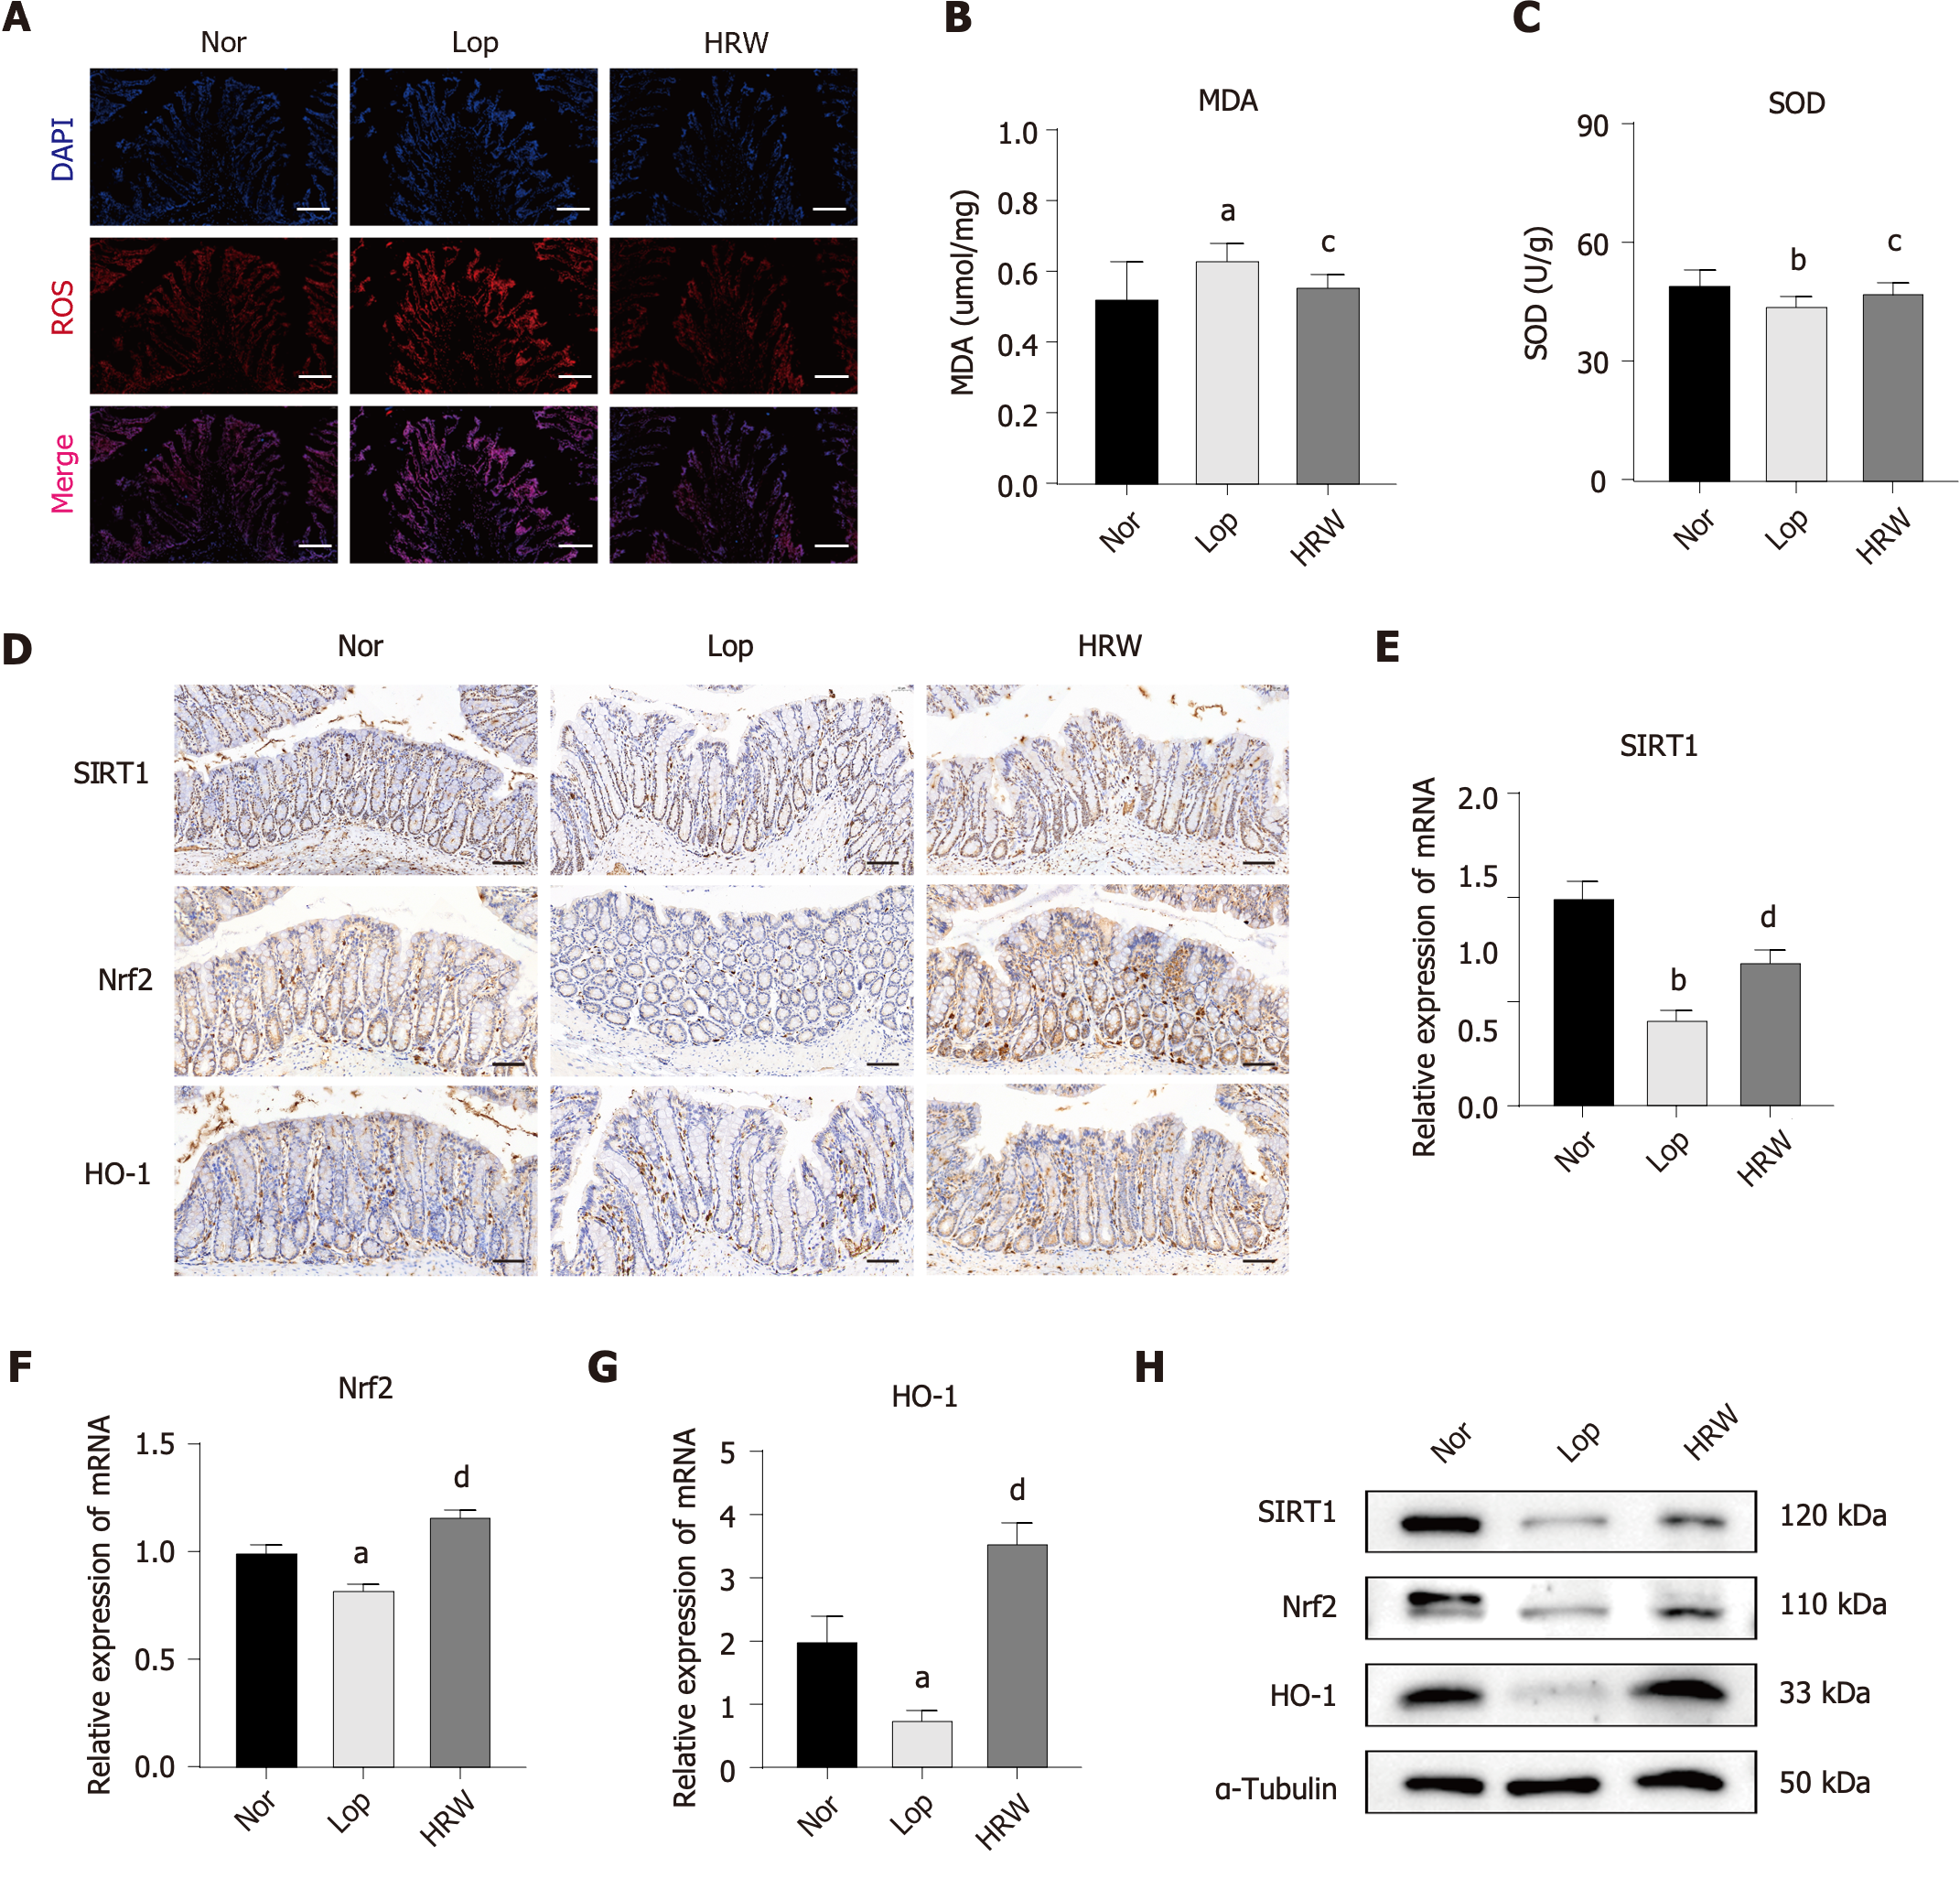
Figure 5 Hydrogen-rich water alleviates constipation by attenuating oxidative stress through the sirtuin1/nuclear factor-erythroid-2-related factor 2/heme oxygenase-1 signaling pathway.
A: Reactive oxygen species expression in the colon of rats; B: Serum malondialdehyde levels in rats; C: Serum superoxide dismutase levels in rats; D: Representative images of immunohistochemical staining of sirtuin1 (SIRT1), nuclear factor-erythroid-2-related factor 2 (Nrf2) and heme oxygenase-1 (HO-1) in the colon of rats; E-G: MRNA of SIRT1, Nrf2, and HO-1 in the colon of rats; H: Protein expression of SIRT1, Nrf2 and HO-1 in the colon of rats. aP < 0.05 vs normal group (Nor), bP < 0.01 vs Nor, cP < 0.05 vs loperamide-induced constipation group (Lop), dP < 0.01 vs Lop. Scale bar: 100 μm. Nor: Normal group; Lop: Loperamide-induced constipation group; HRW: Hydrogen-rich water intervention group; ROS: Reactive oxygen species; SOD: Superoxide dismutase; MDA: Malondialdehyde; SIRT1: Sirtuin1; Nrf2: Nuclear factor-erythroid-2-related factor 2; HO-1: Heme oxygenase-1.
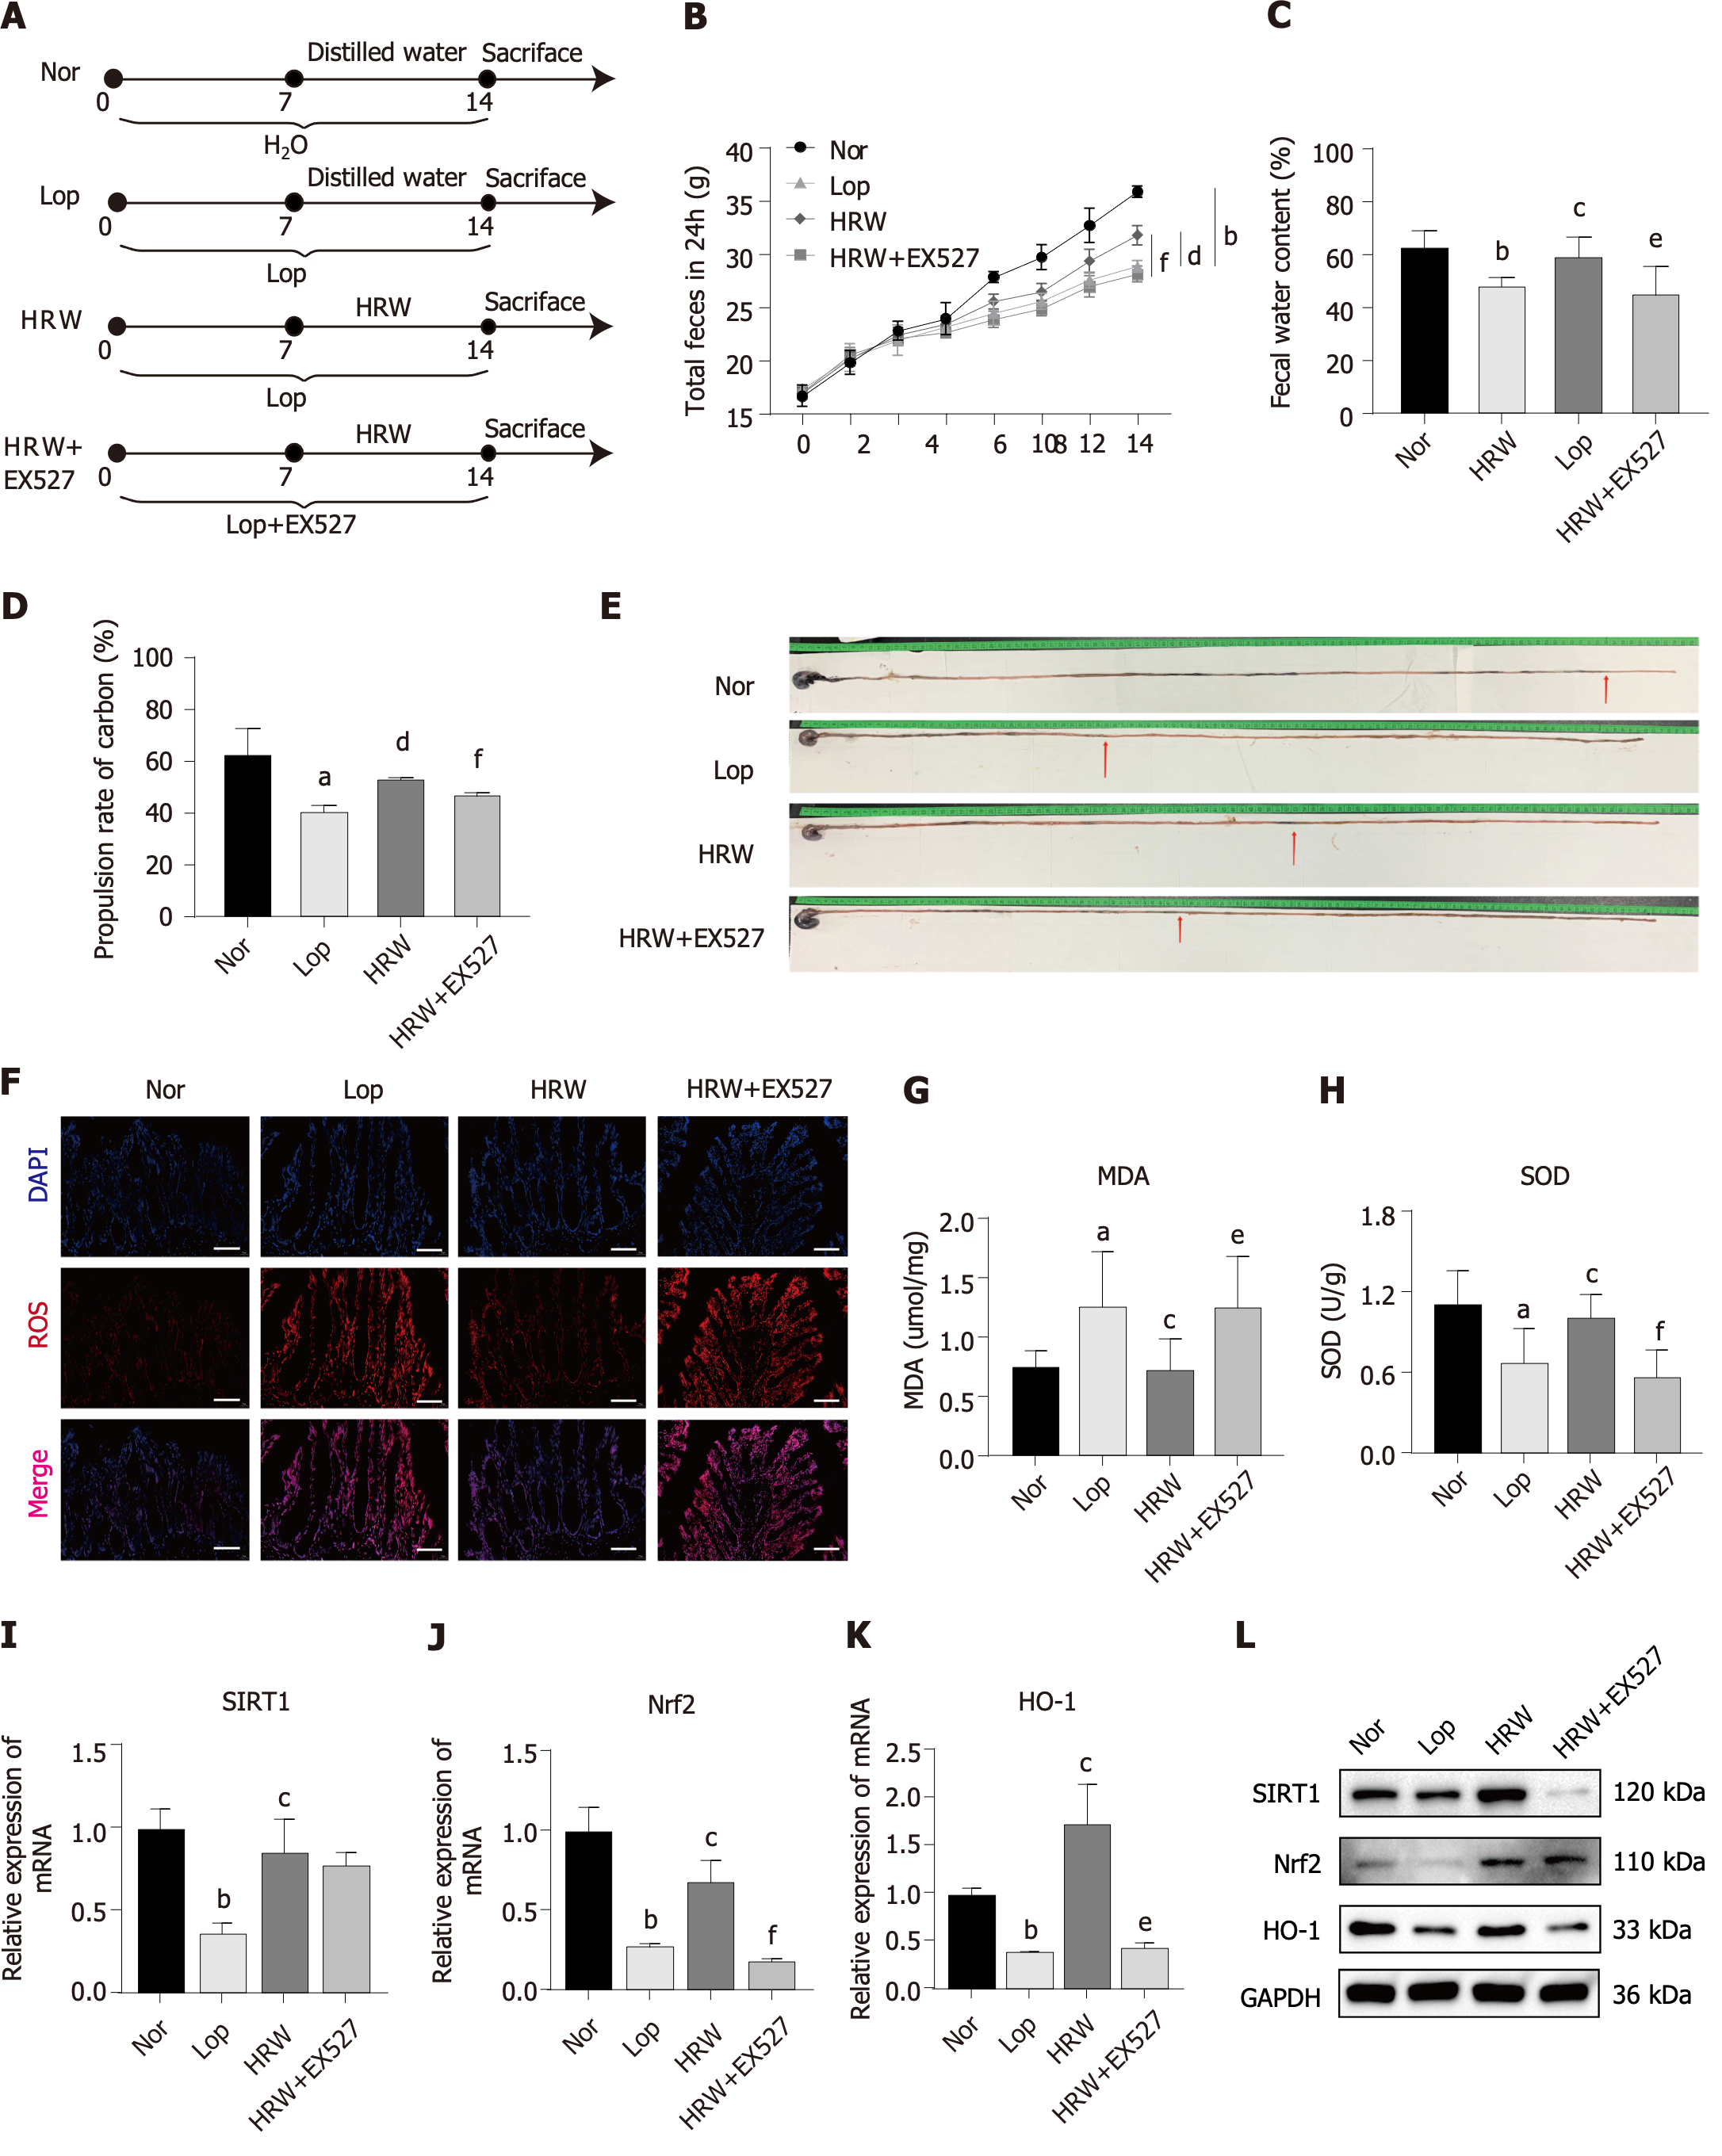
Figure 6 Inhibition of sirtuin1 expression counteracts the regulatory effect of hydrogen-rich water in loperamide-induced constipated rats.
A: Flow chart illustrating the modeling and drug administration process; B: Total amount of rat feces excreted in 24 h; C: Water content of rat feces; D and E: Propulsion rate of carbon through the small intestine of rats; F: Reactive oxygen species expression in the colon of rats; G and H: Malondialdehyde and superoxide dismutase expression in the colon of rats; I-K: MRNA expression levels of sirtuin1 (SIRT1), nuclear factor-erythroid-2-related factor 2 (Nrf2) and heme oxygenase-1 (HO-1) in the colon of rats; L: Protein expression levels of SIRT1, Nrf2 and HO-1 in the colon of rats. aP < 0.05 vs normal group (Nor), bP < 0.01 vs Nor, cP < 0.05 vs loperamide-induced constipation group (Lop), dP < 0.01 vs Lop, eP < 0.05 vs hydrogen-rich water (HRW), fP < 0.01 vs HRW. Scale scale: 100 μm. Nor: Normal group; Lop: Loperamide-induced constipation group; HRW: Hydrogen-rich water intervention group; SIRT1: Sirtuin1; Nrf2: Nuclear factor-erythroid-2-related factor 2; HO-1: Heme oxygenase-1; ROS: Reactive oxygen species; MDA: Malondialdehyde; SOD: Superoxide dismutase.
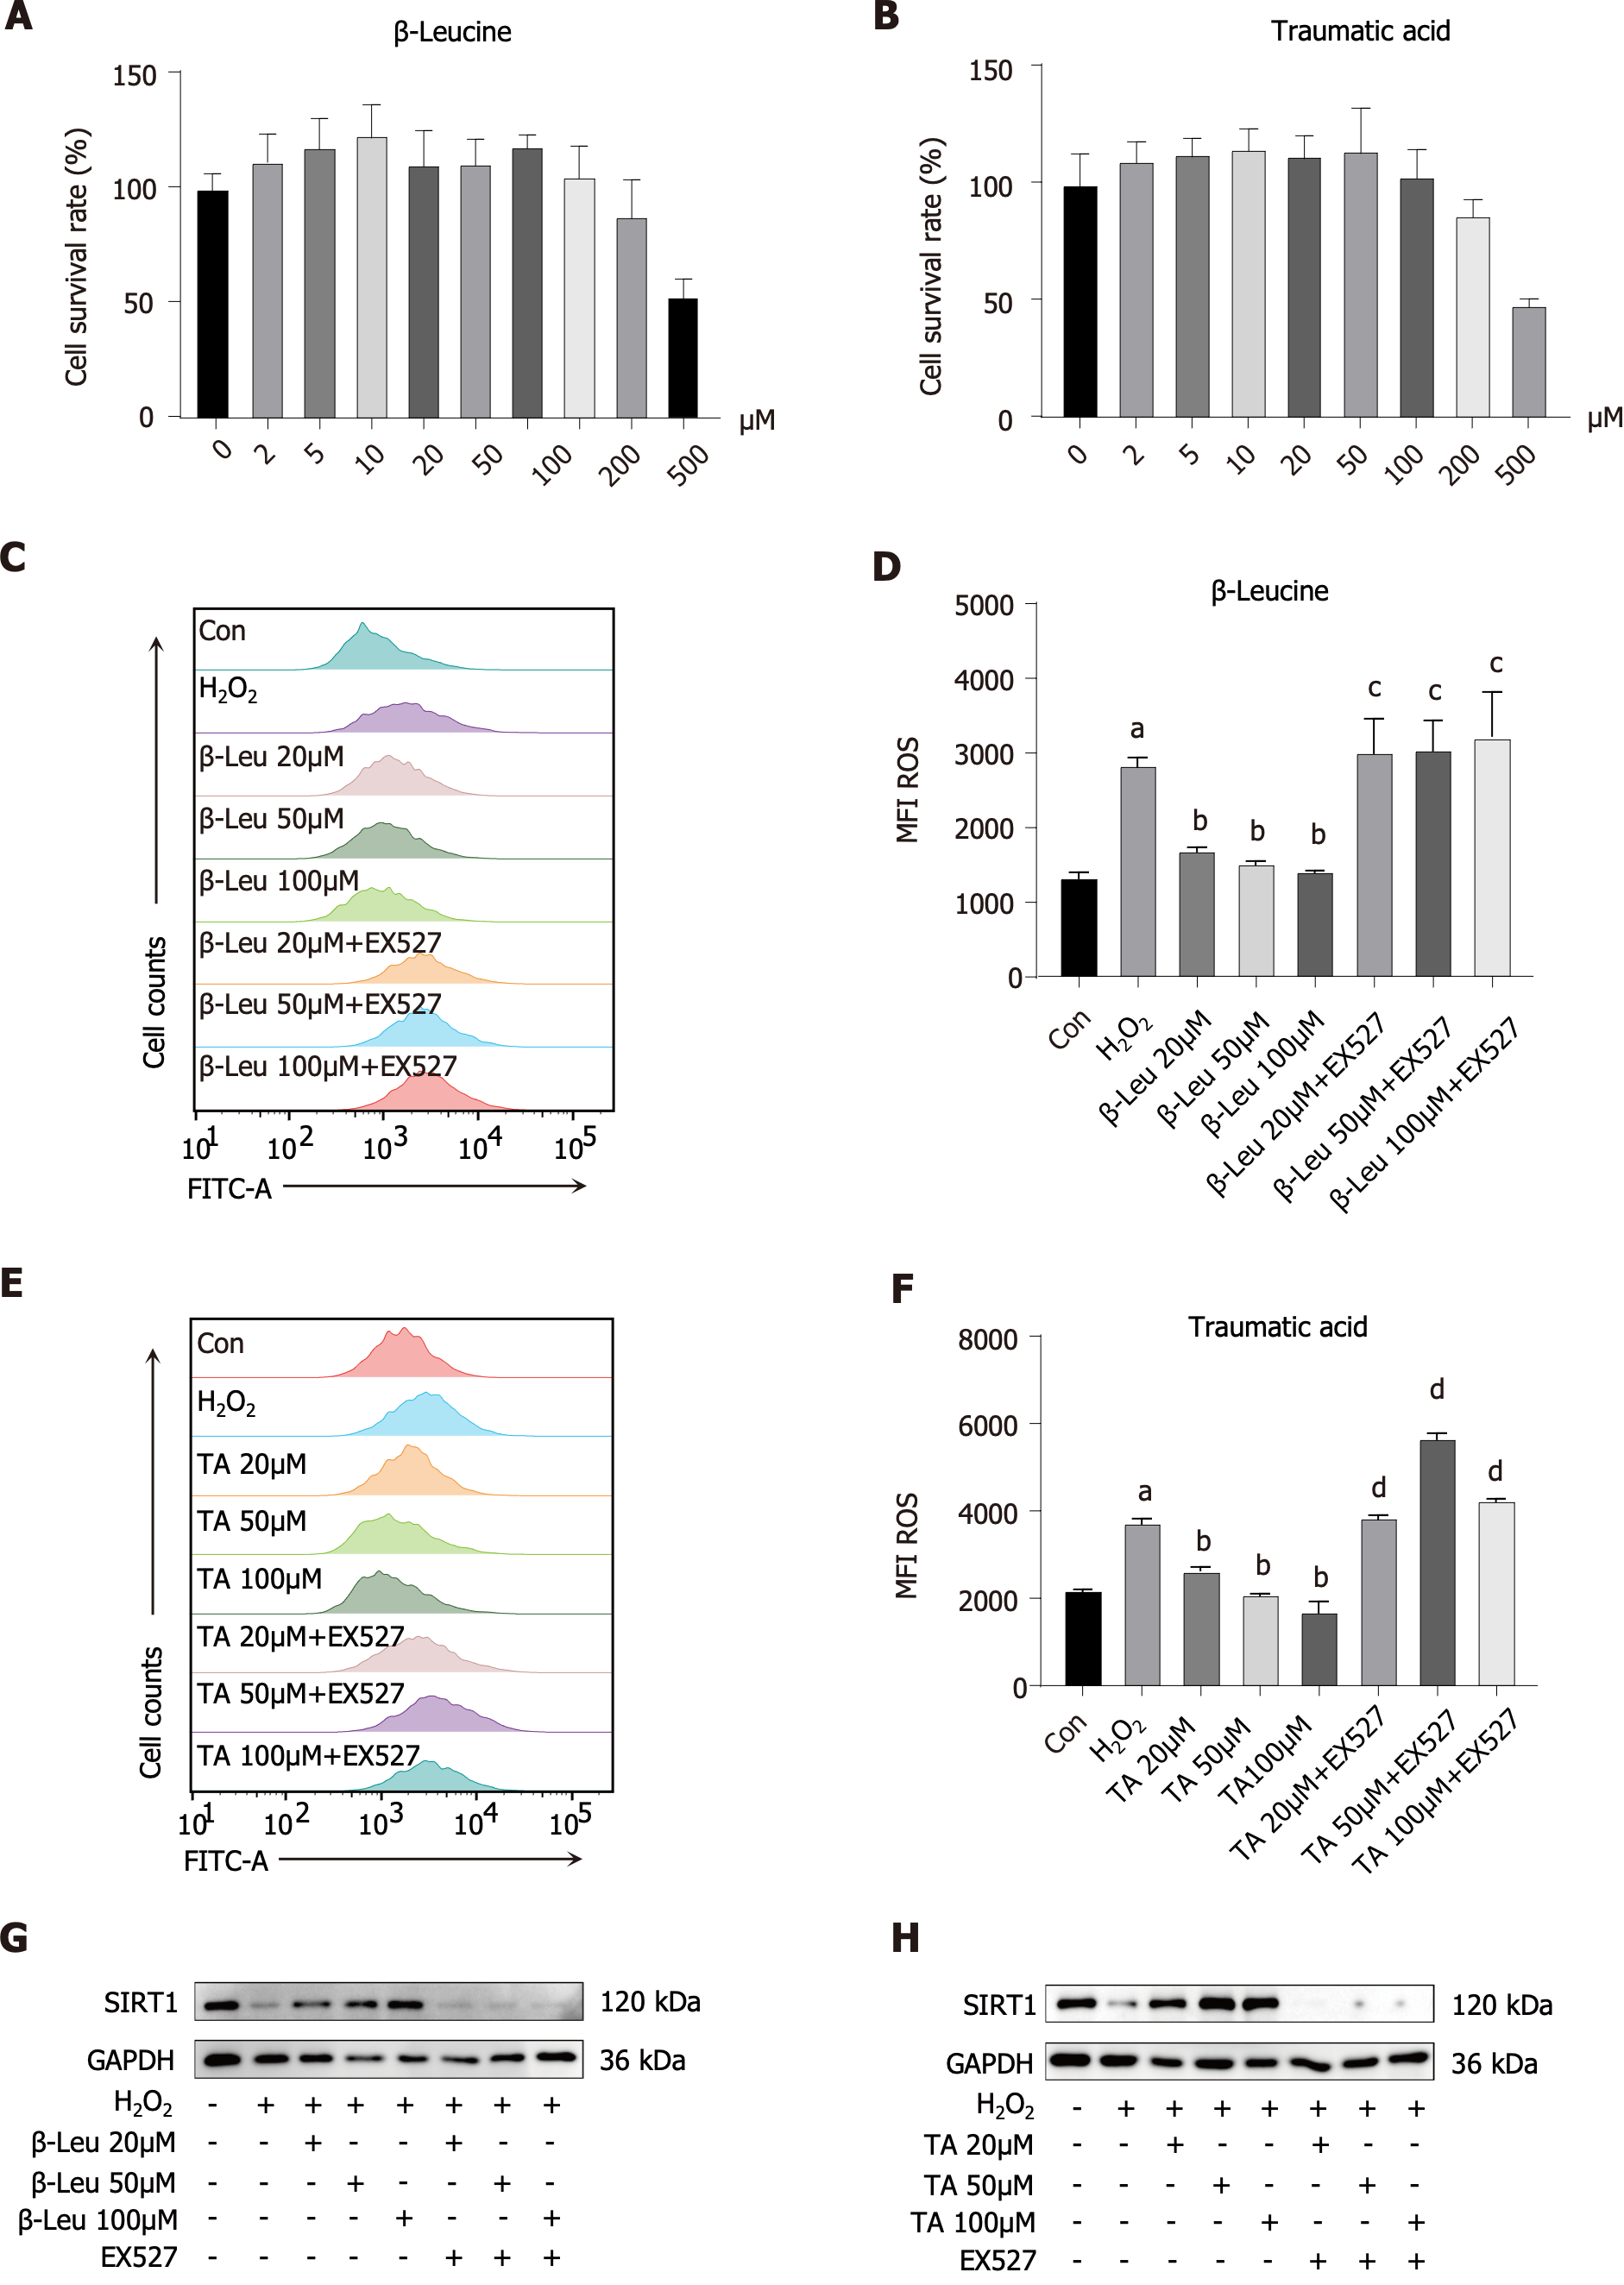
Figure 7 Expression of sirtuin1 in NCM460 cells is increased following treatment with β-leucine and traumatic acid, resulting in a reduction of H2O2-induced oxidative stress.
A and B: CCK-8 assay of β-leucine (β-Leu) and traumatic acid in NCM460 cells; C and D: Reactive oxygen species (ROS) expression in response to β-Leu intervention; E and F: ROS expression in response to traumatic acid intervention; G: Sirtuin1 (SIRT1) expression following the administration of β-Leu and EX527; H: SIRT1 expression in response to the administration of traumatic acid and EX527. aP < 0.01 vs control group; bP < 0.01 vs H2O2; cP < 0.01 vs β-Leu; dP < 0.01 vs Traumatic acid. β-Leu: β-leucine; TA: Traumatic acid; ROS: Reactive oxygen species; Con: Control group.
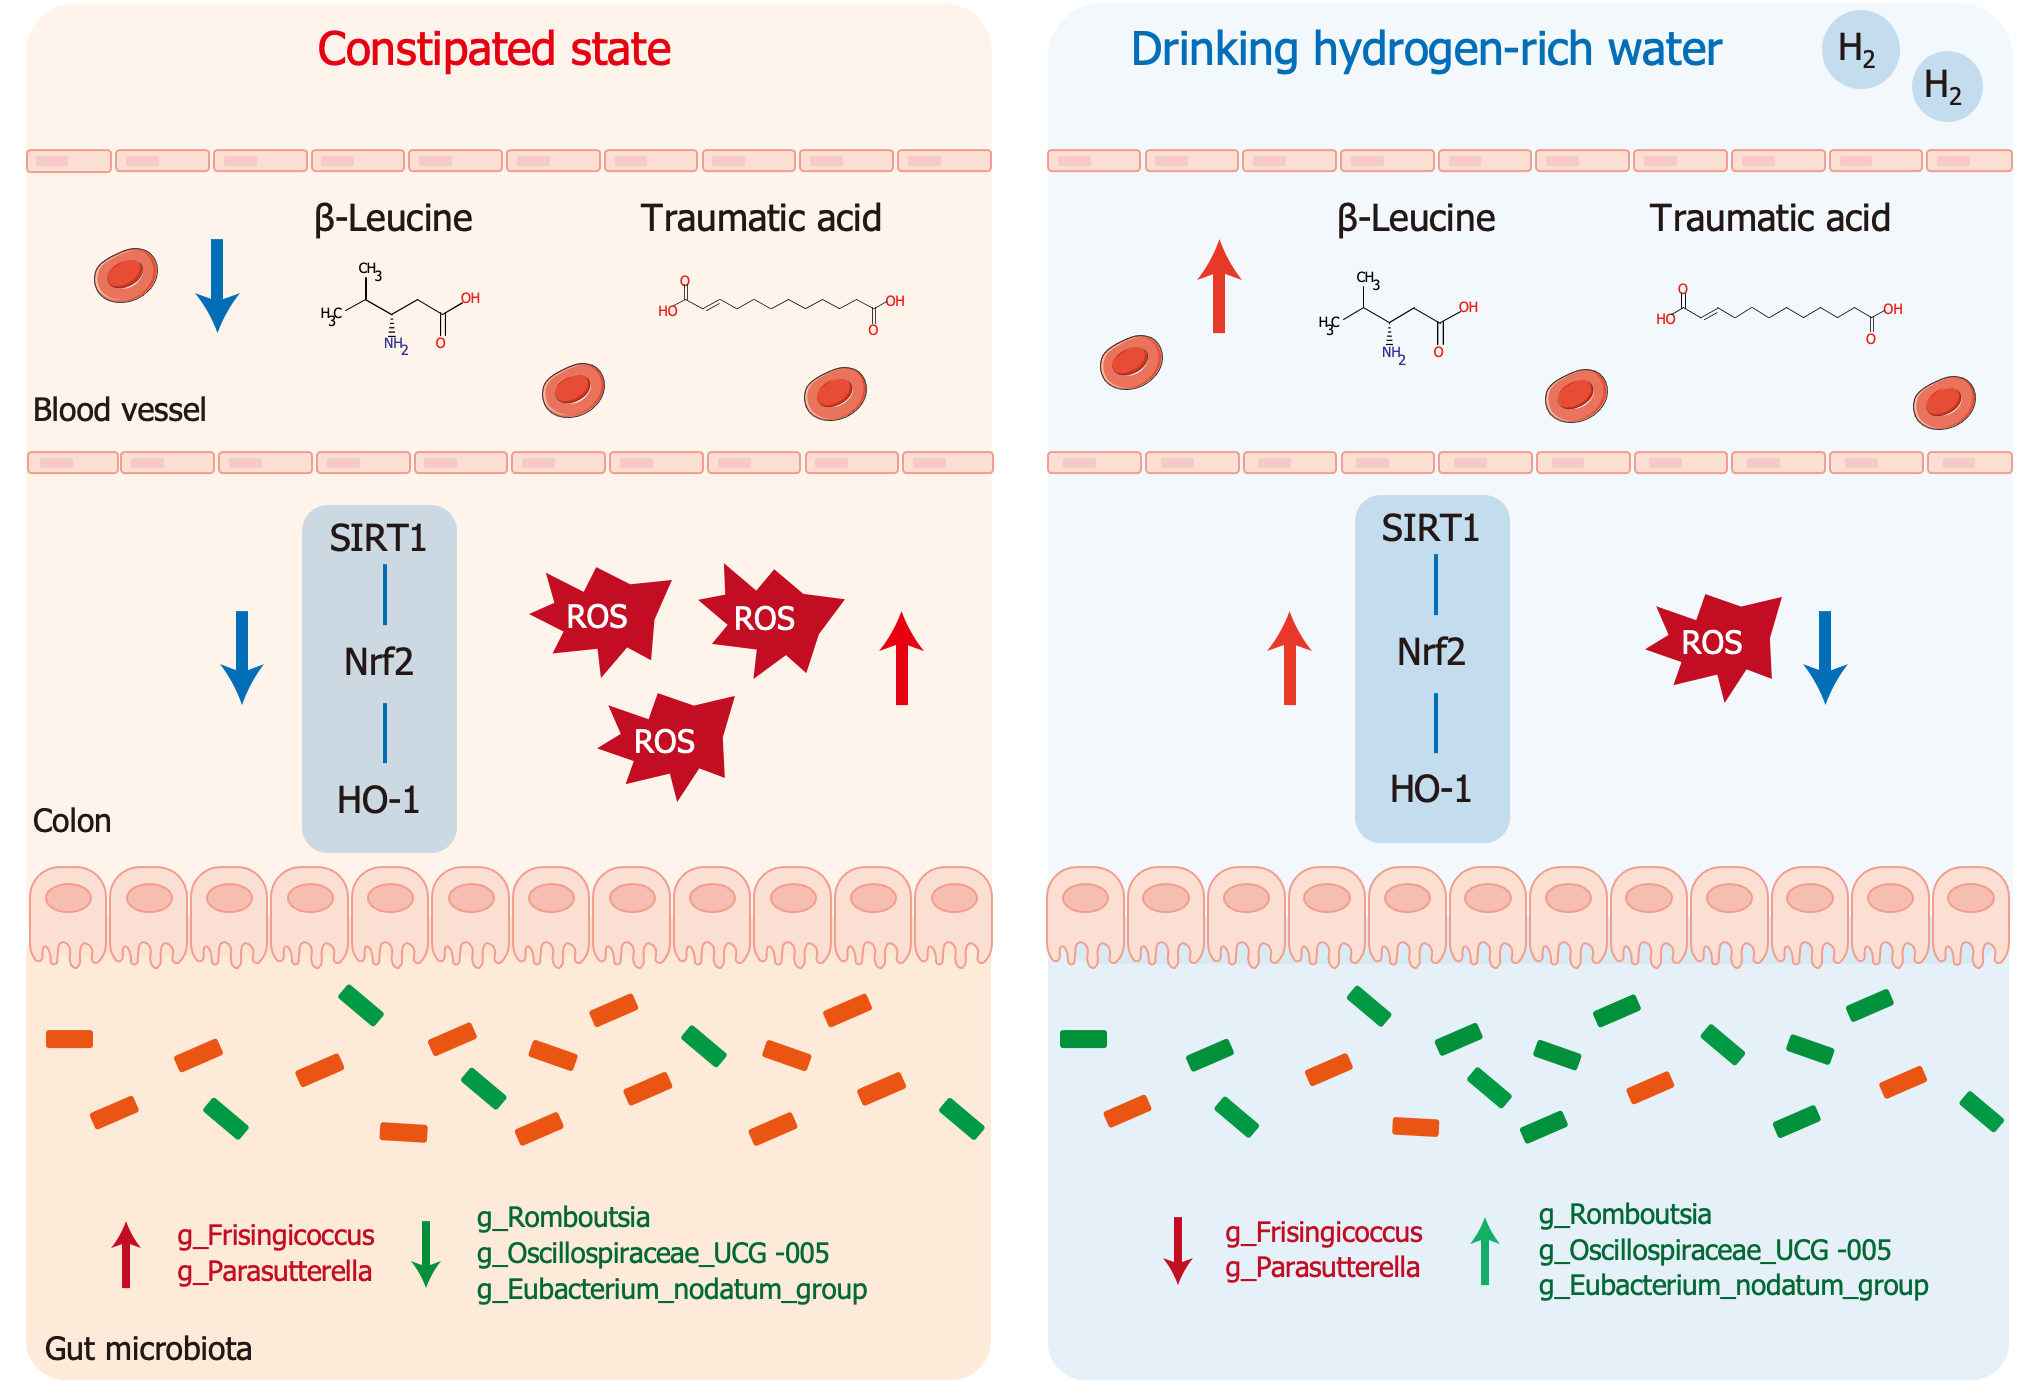
Figure 8 Schematic of the mechanism.
Hydrogen-rich water alleviates constipation by attenuating intestinal oxidative stress through the sirtuin1/nuclear factor-erythroid-2-related factor 2/heme oxygenase-1 signaling pathway and modulating gut microbiota and serum metabolites. SIRT1: Sirtuin1; Nrf2: Nuclear factor-erythroid-2-related factor 2; HO-1: Heme oxygenase-1.
- Citation: Chen KD, Wang KL, Chen C, Zhu YJ, Tang WW, Wang YJ, Chen ZP, He LH, Chen YG, Zhang W. Hydrogen-rich water alleviates constipation by attenuating oxidative stress through the sirtuin1/nuclear factor-erythroid-2-related factor 2/heme oxygenase-1 signaling pathway. World J Gastroenterol 2024; 30(20): 2709-2725
- URL: https://www.wjgnet.com/1007-9327/full/v30/i20/2709.htm
- DOI: https://dx.doi.org/10.3748/wjg.v30.i20.2709


