Copyright
©The Author(s) 2024.
World J Gastroenterol. May 28, 2024; 30(20): 2689-2708
Published online May 28, 2024. doi: 10.3748/wjg.v30.i20.2689
Published online May 28, 2024. doi: 10.3748/wjg.v30.i20.2689
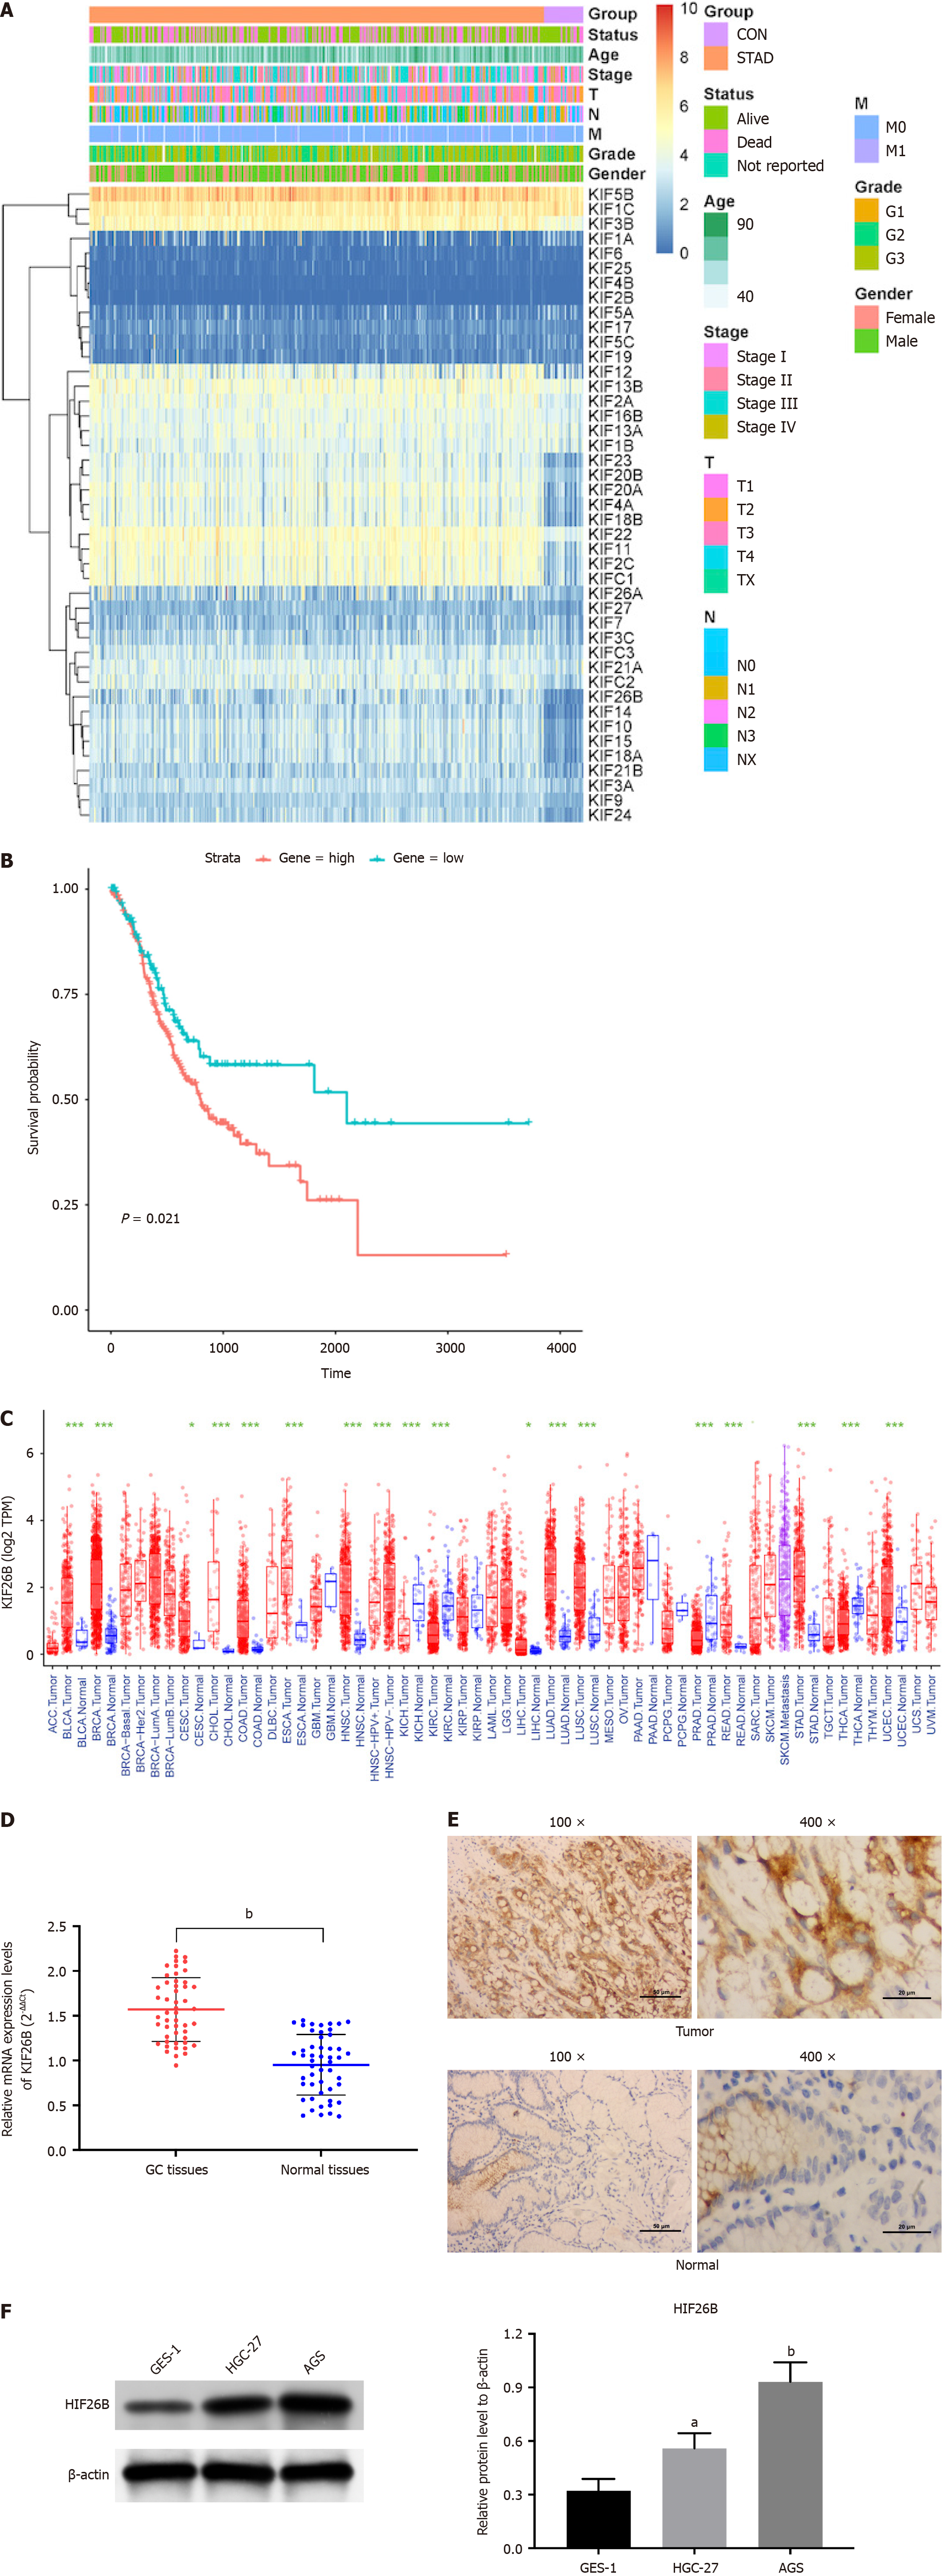
Figure 1 Overexpression of KIF26B in gastric cancer and its poor prognosis.
A: The heat map shows the TCGA expression profile of all Kinesin superfamily proteins (normal and tumor tissues), with a total of 18 DEGs; B: The gene KIF26B with the most significant differential expression in gastric cancer (GC) was screened, and survival analysis was conducted; C: A pan-cancer analysis was conducted on KIF26B in various cancers; D: Using quantitative real-time polymerase chain reaction to detect the expression of KIF26B in GC tissue and adjacent tissues (n = 50); E: Immunohistochemical analysis of the expression of KIF26B in GC tissue and adjacent tissues (n = 3); F: The protein expression levels of KIF26B in GC cell lines (HGC-27/AGS) and normal gastric mucosal epithelial cell line (GES-1) were detected by western blotting (n = 3). aP < 0.05, bP < 0.01. GC: Gastric cancer.
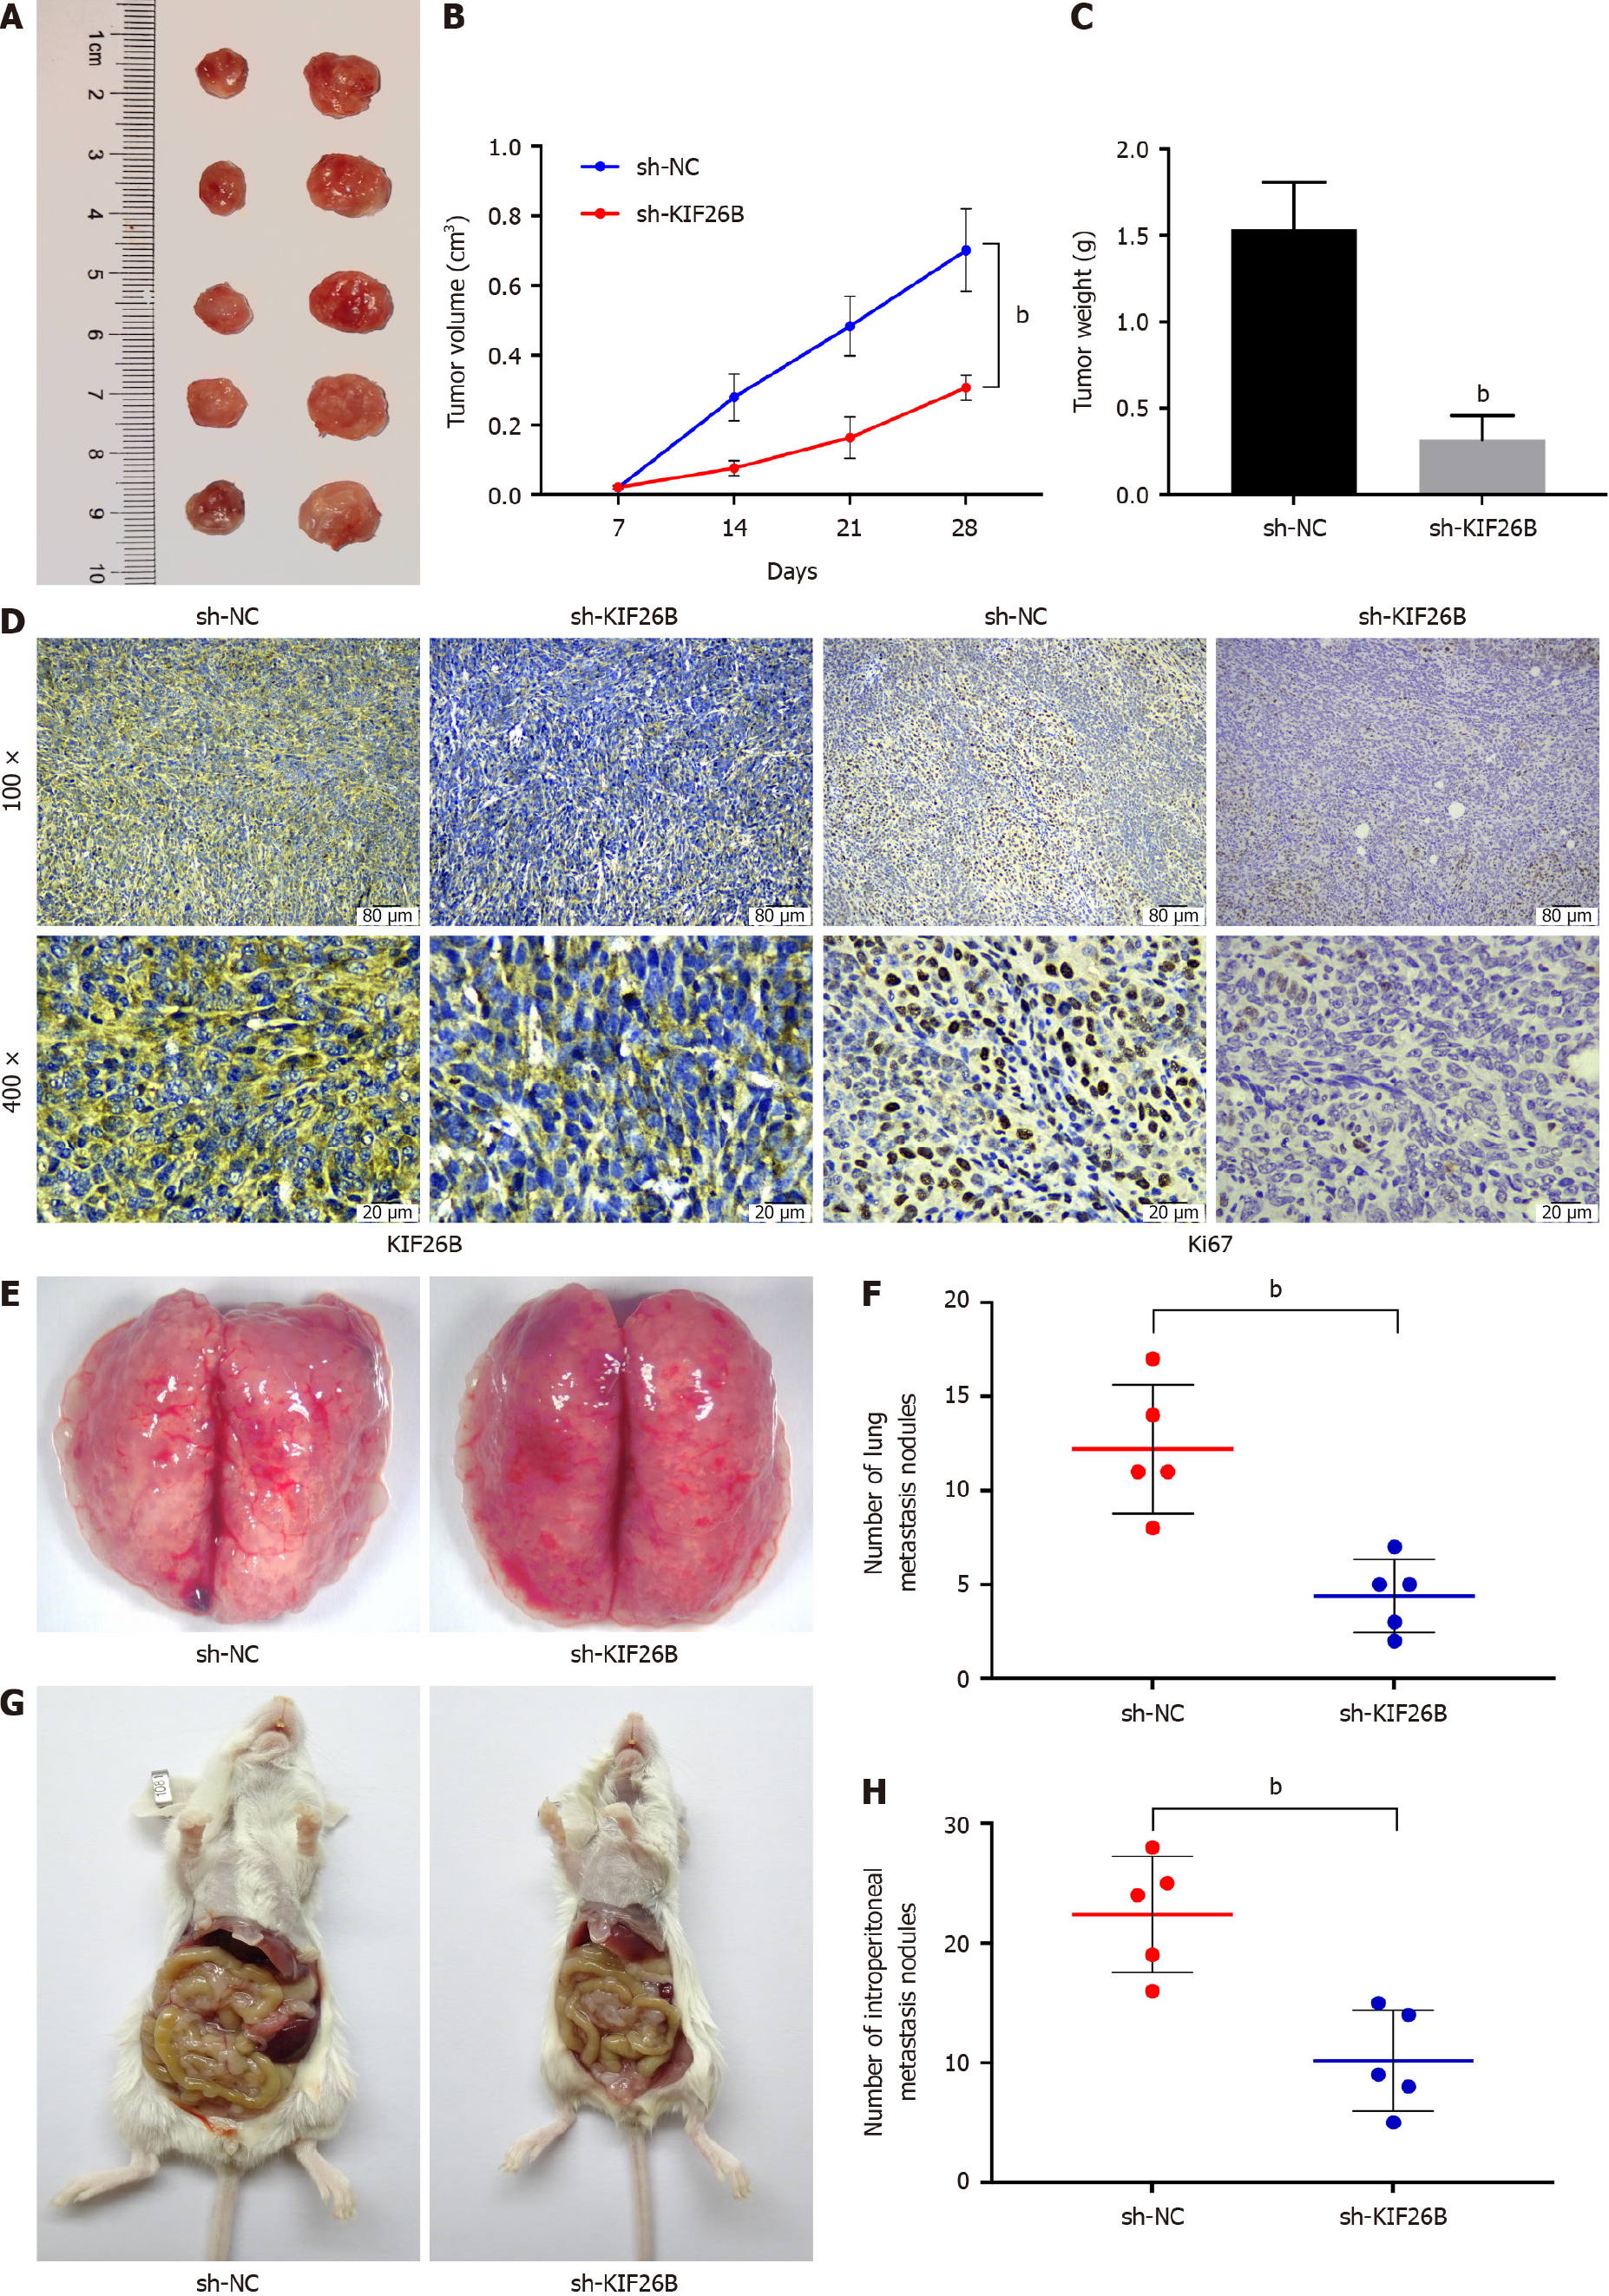
Figure 2 KIF26B’s effect on tumorigenesis, lung metastasis, and abdominal metastasis.
A: Tumor images of xenograft tumors in nude mice; B: Volume changes of xenograft tumors in nude mice within 28 d; C: Weight of xenograft tumors in nude mice; D: Immunohistochemical analysis of KIF26B and Ki67 expression in tumor tissue; E: Image of tumor metastasis to lung lymph nodes to detect inflammatory infiltration in lung lymph nodes; F: Quantitative analysis of pulmonary nodules; G: Images of tumor metastasis to the peritoneum; H: Quantitative analysis of peritoneal nodules. n = 5. bP < 0.01. sh-NC: sh-KIF26B negative controls.
Figure 3 High expression of KIF26B may affect the activation or infiltration of gastric cancer related fibroblasts.
A: Timer 2.0 analysis of the correlation between KIF26B expression and the degree of cancer-associated fibroblasts (CAFs) infiltration; B: Timer 2.0 analysis of the correlation between KIF26B expression and the degree of cancer endothelial cell infiltration; C: Timer 2.0 analysis of the correlation between KIF26B expression and PD-1 (PDCD1), PD-L1 (CD274) expression; D: Timer 2.0 analysis to verify the correlation between KIF26B and CAFs biomarkers (ACTA2, FAP, ITGB1, PDPN, and THY1); E: Immunohistochemical analysis of KIF26B and α-SMA in gastric cancer (GC) tissues (n = 3); F: The mRNA levels of CAFs Biomarker α-SMA and ACTA2 in metastatic and non-metastatic GC tissues were detected by quantitative real-time polymerase chain reaction (n = 25). bP < 0.01.
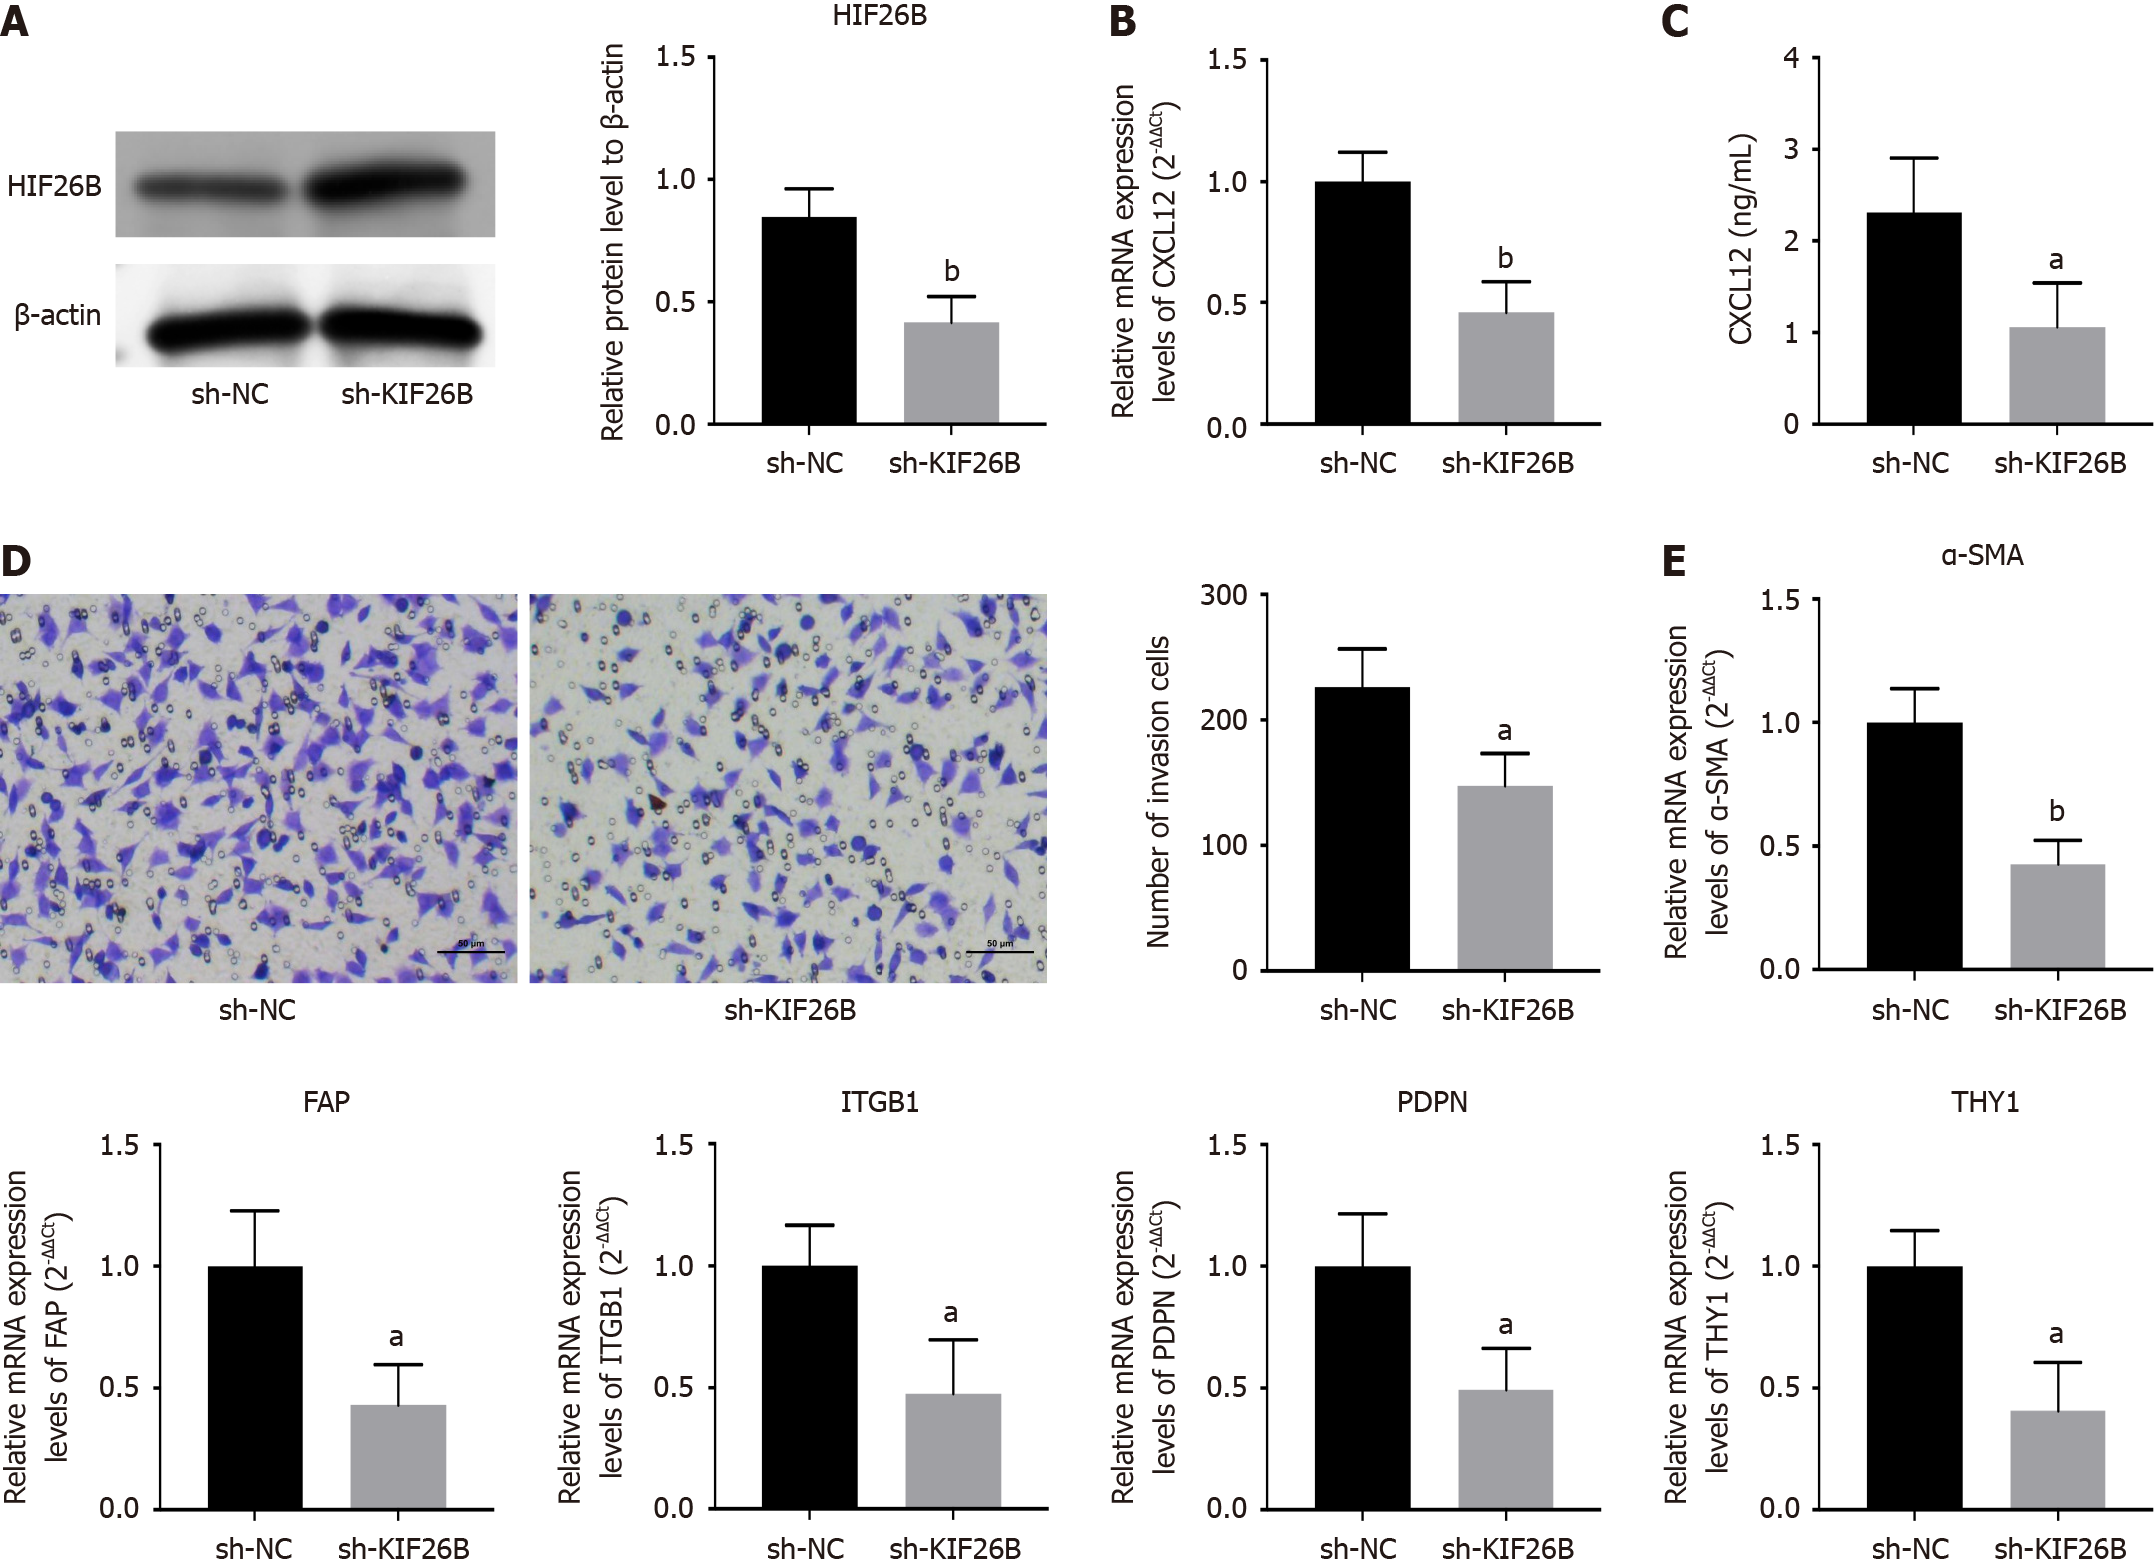
Figure 4 KIF26B affects the activation of fibroblasts to form the cancer-associated fibroblast phenotype.
A: Detection of transfection efficiency of sh-KIF26B negative controls/sh-KIF26B in HGC-27 cells by Western blotting; B: ELISA assay for detecting the expression of chemokines (CXCL12) in HFF cells; C: Detection of mRNA expression levels of CXCL12 in HFF cells by quantitative real-time polymerase chain reaction (qRT-PCR); D: Analyzing the invasive ability of HFF cells through Transwell assay; E: The expression levels of biomarkers (α-SMA, FAP, ITGB1, PDPN and THY1) for cancer-associated fibroblasts were detected by qRT-PCR. n = 3. aP < 0.05, bP < 0.01. sh-NC: sh-KIF26B negative controls.
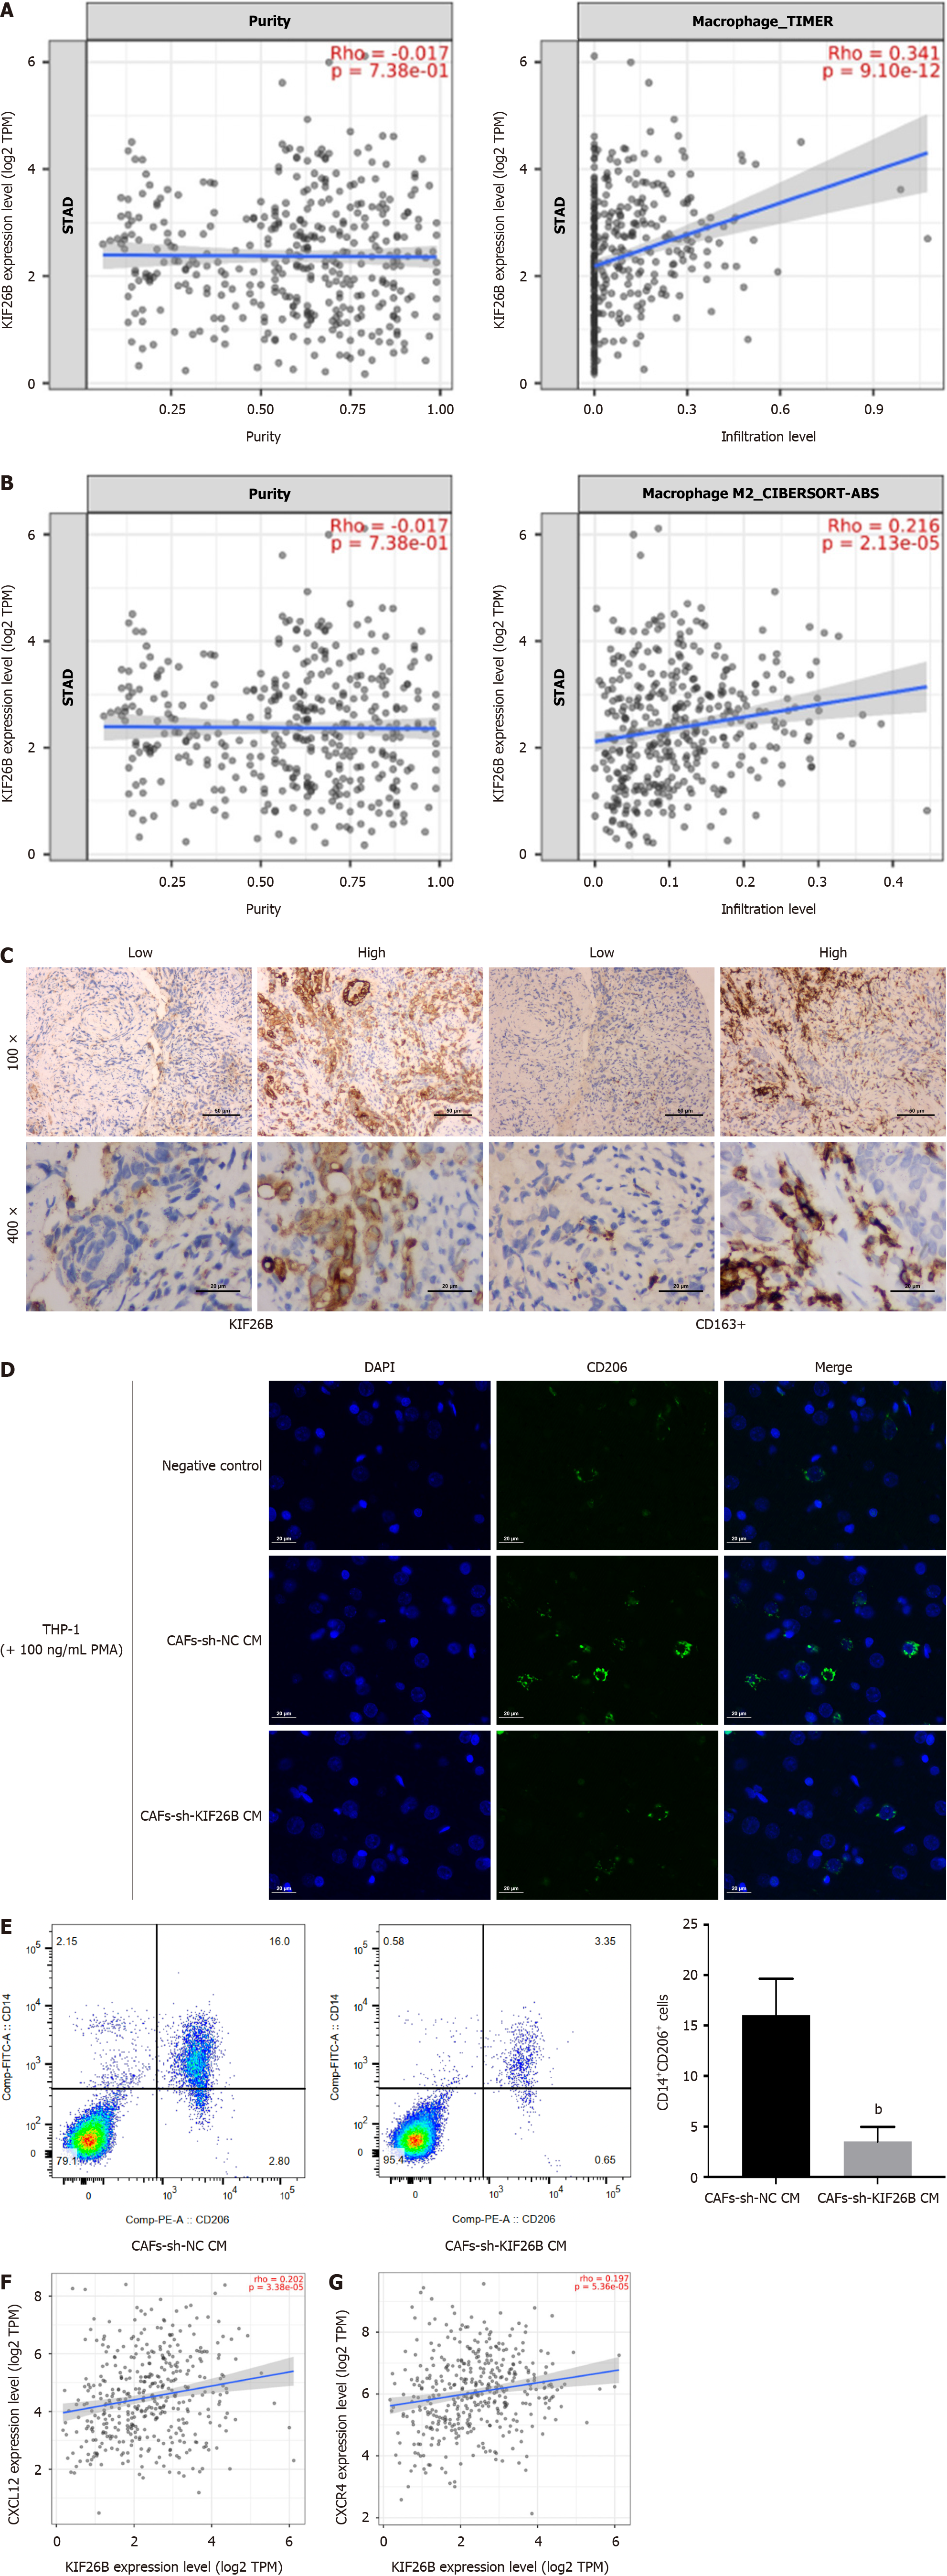
Figure 5 KIF26B enhances crosstalk between cancer-associated fibroblasts and macrophages, thereby mediating M2 polarization of macrophages.
A: Timer 2.0 analysis of the correlation between KIF26B expression and macrophage activation; B: Timer 2.0 analysis of the correlation between KIF26B expression and M2 type macrophages; C: The correlation between the expression of KIF26B and the level of CD163+ (M2 macrophage marker) infiltration was analyzed by immunohistochemistry. n = 3; D: Immunofluorescence detection of CD206 signaling in THP-1 cells. The supernatant of cancer-associated fibroblasts that transfected with sh-KIF26B was used to incubate THP-1 cells. n = 3; E: Flow cytometry was used to detect the number of M2-polarized macrophages. n = 3; F: Analyzing the correlation between KIF26B expression and chemokine CXCL12 expression through the Timer 2.0 database; G: Analyzing the correlation between KIF26B expression and CXCR4 expression trough the Timer 2.0 database. bP < 0.01. CAFs: Cancer-associated fibroblasts; sh-NC: sh-KIF26B negative controls.
Figure 6 KIF26B regulates M2 polarization of macrophages through fibroblast activation, thereby regulating invasiveness, angiogenesis, and epithelial-mesenchymal transition processes of gastric cancer cells.
A: The migration ability of HGC-27 and AGS cells was examined by wound healing assay; B: The invasiveness of HGC-27 and AGS cells were evaluated by Transwell assay; C: Endothelial cell tube formation assay was applied to detect the ability of HGC-27 and AGS cells to form tubes; D: Western blotting assay was used to detect the expression levels of epithelial-mesenchymal transition related proteins; E: The number of M2-polarized macrophage infiltration in HGC-27 and AGS cells was counted by flow cytometry. n = 3. aP < 0.05, bP < 0.01. CAFs: Cancer-associated fibroblasts; sh-NC: sh-KIF26B negative controls.
- Citation: Huang LM, Zhang MJ. Kinesin 26B modulates M2 polarization of macrophage by activating cancer-associated fibroblasts to aggravate gastric cancer occurrence and metastasis. World J Gastroenterol 2024; 30(20): 2689-2708
- URL: https://www.wjgnet.com/1007-9327/full/v30/i20/2689.htm
- DOI: https://dx.doi.org/10.3748/wjg.v30.i20.2689


