Copyright
©The Author(s) 2024.
World J Gastroenterol. May 14, 2024; 30(18): 2418-2439
Published online May 14, 2024. doi: 10.3748/wjg.v30.i18.2418
Published online May 14, 2024. doi: 10.3748/wjg.v30.i18.2418
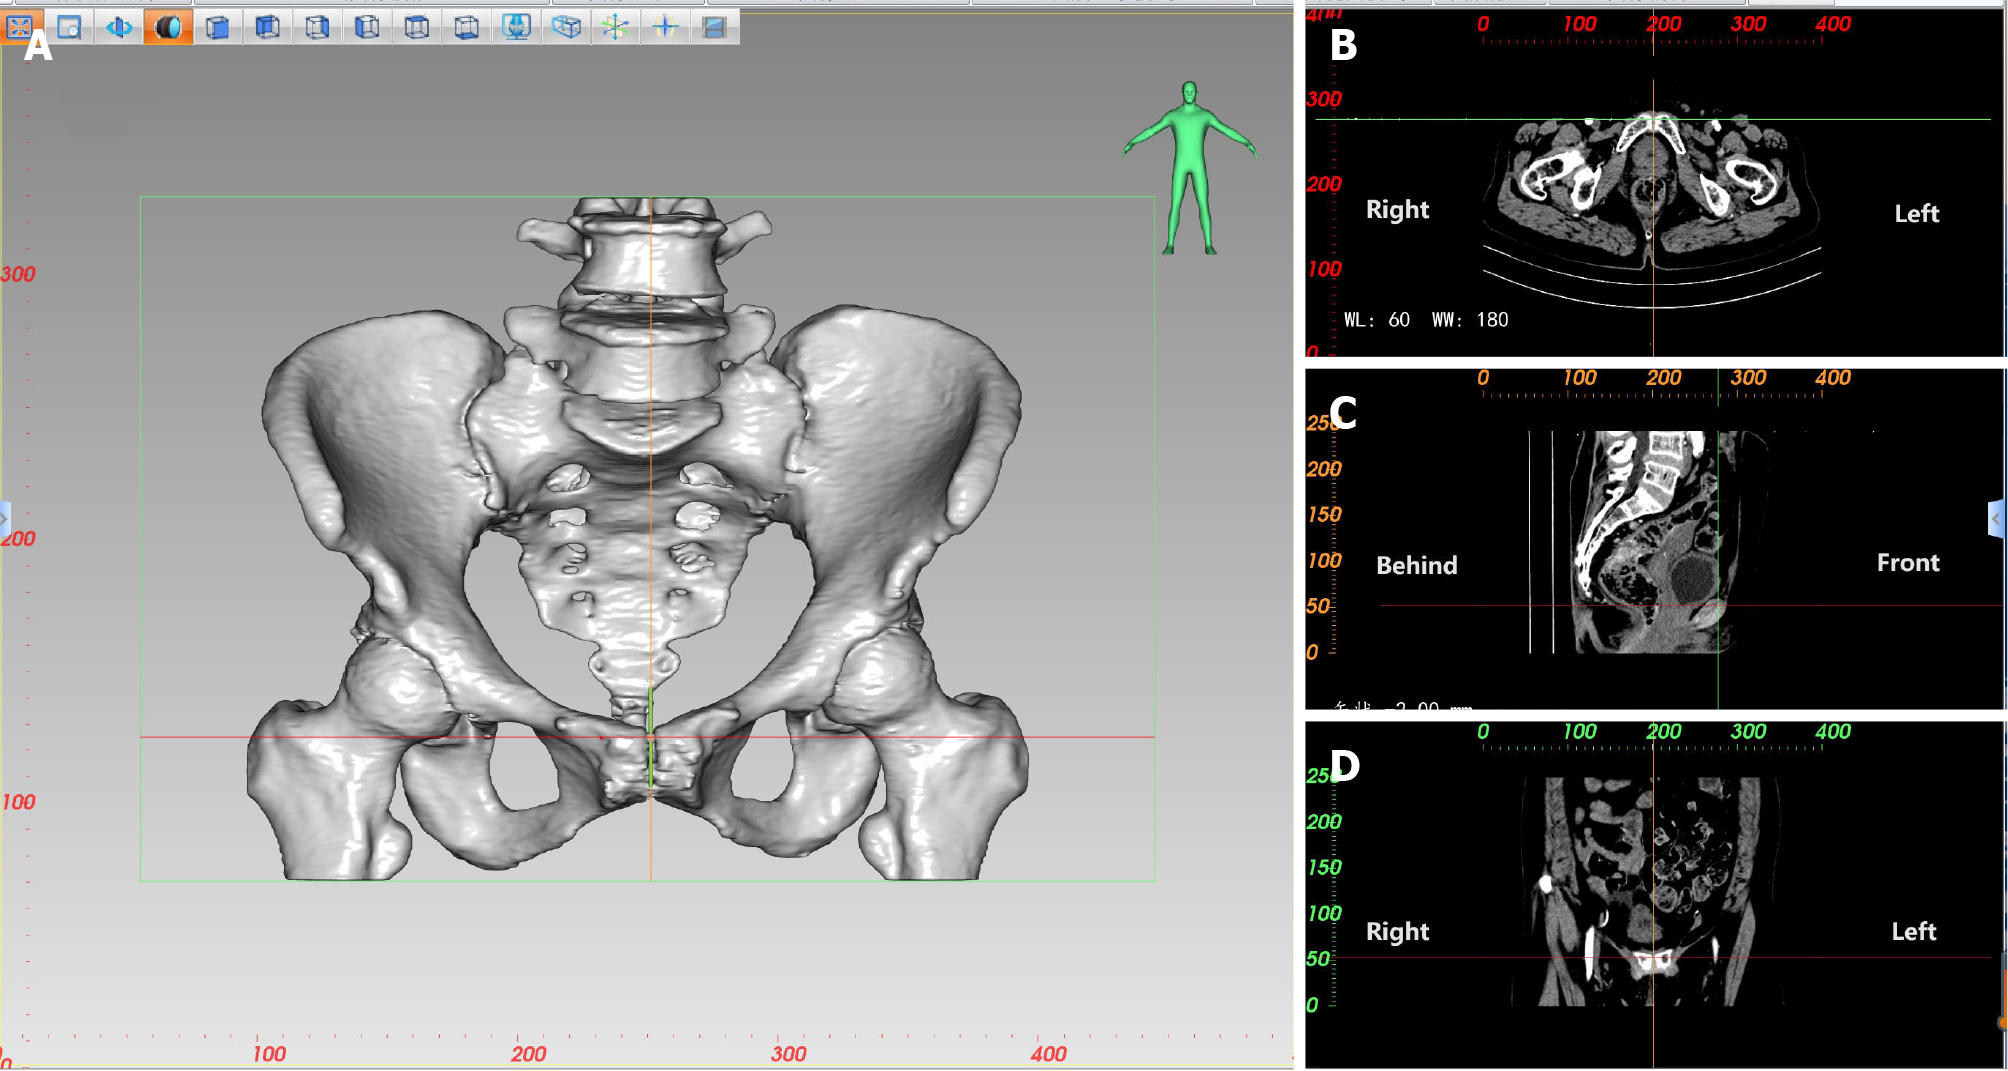
Figure 1 Localization diagrams of the highest point of the pubic symphysis during three-dimensional pelvic measurement.
A: Localization of the highest point of the pubic symphysis during three-dimensional measurement of the pelvis; B: Localization of the intersection of two axes in the transverse plane, i.e., the corresponding measurement point; C: Localization of the intersection of two axes in the median sagittal plane, i.e., the corresponding measurement point; D: Localization of the intersection of two axes in the coronal plane, i.e., the corresponding measurement point.
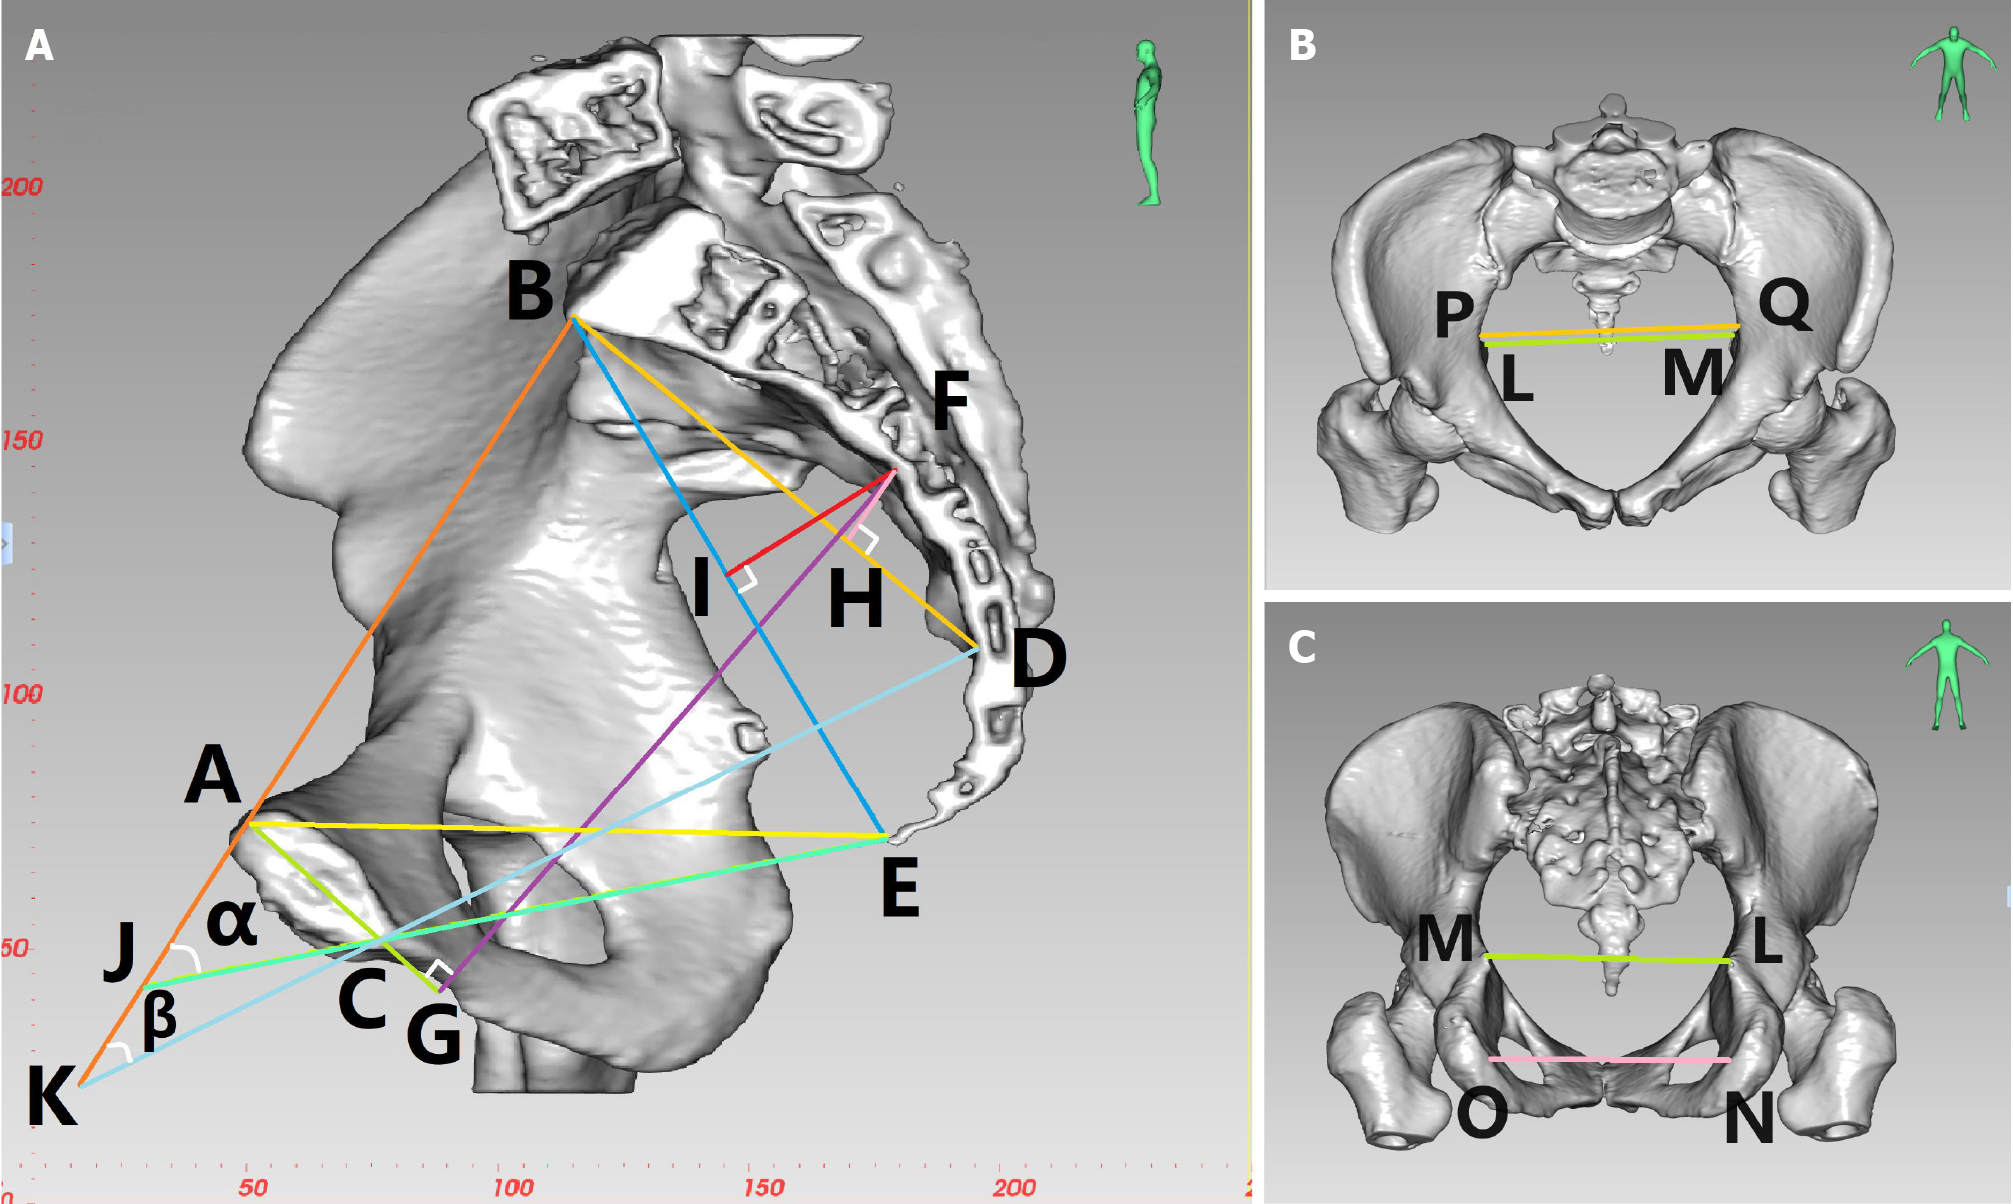
Figure 2 Diagram of three-dimensional reconstruction of the pelvis in a female patient.
A: Midsagittal lateral view: anterior-posterior diameter of pelvic inlet (AB), anterior-posterior diameter of mid-pelvis (CD), anterior-posterior diameter of pelvic outlet (CE), superior-inferior diameter of the pubic symphysis (AC), sacrococcygeal distance (BE), superior-inferior diameter of sacrum (BD), superior pubococcygeal diameter (AE), anterior-posterior sacropubic distance (FG), sacrococcygeal-pubic angle (α), and sacropubic angle (β); B: Anterior-posterior view: transverse diameter of pelvic inlet (PQ), interischial spine diameter (LM); C: Posterior-anterior view: interischial spine diameter (LM), interischial tuberosity diameter (NO).
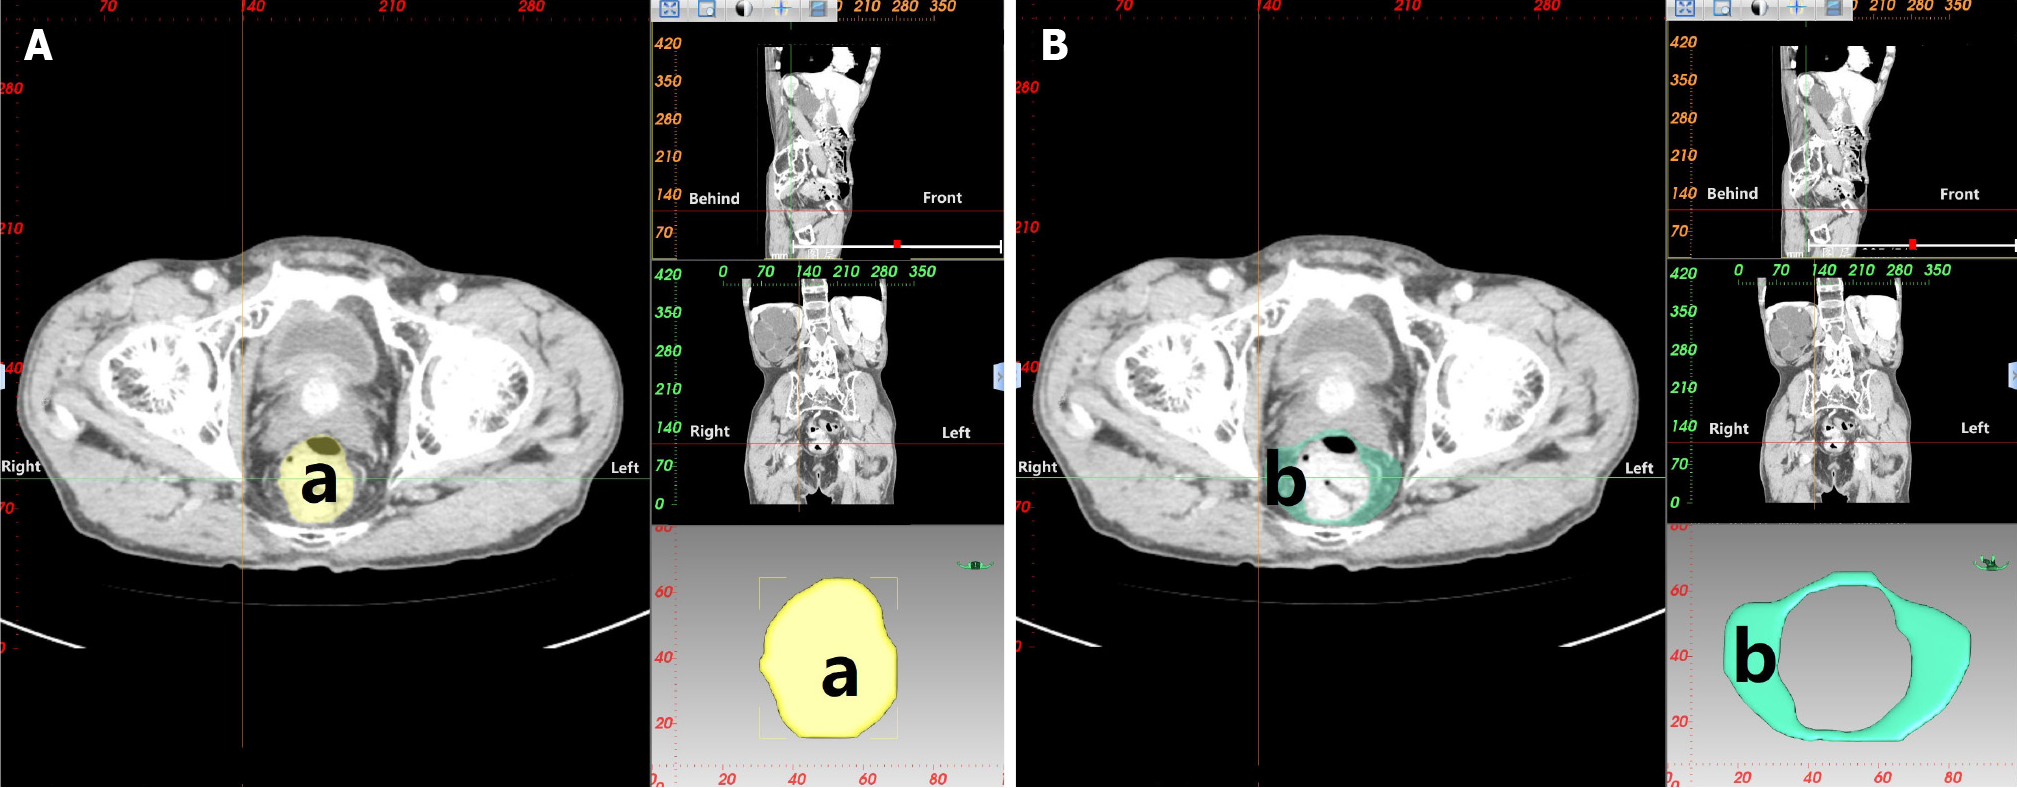
Figure 3 Measurements of rectal area and mesorectal fat area.
A: Measurement of rectal area (a): Area of the rectum at the level of the ischial spine; B: Measurement of mesorectal fat area (b): Area of the mesorectal fat at the level of the ischial spine.
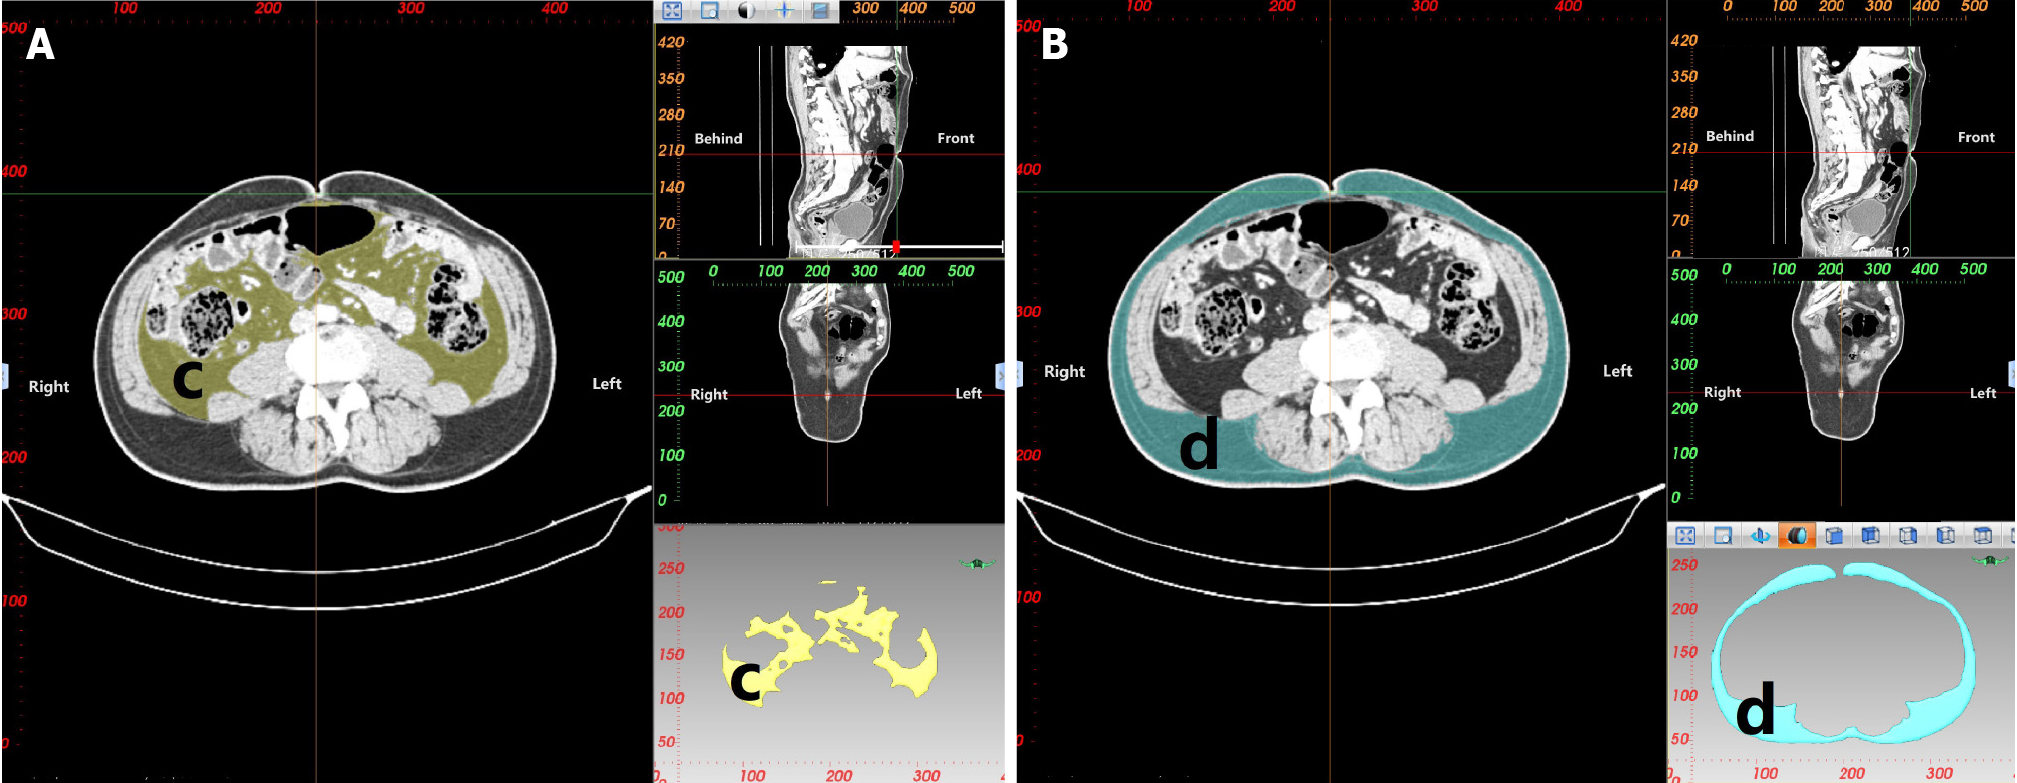
Figure 4 Measurements of visceral fat area and subcutaneous fat area.
A: Measurement of visceral fat area (c): Area of visceral fat at the level of the umbilicus; B: Measurement of subcutaneous fat area (d): Area of subcutaneous fat at the level of the umbilicus.
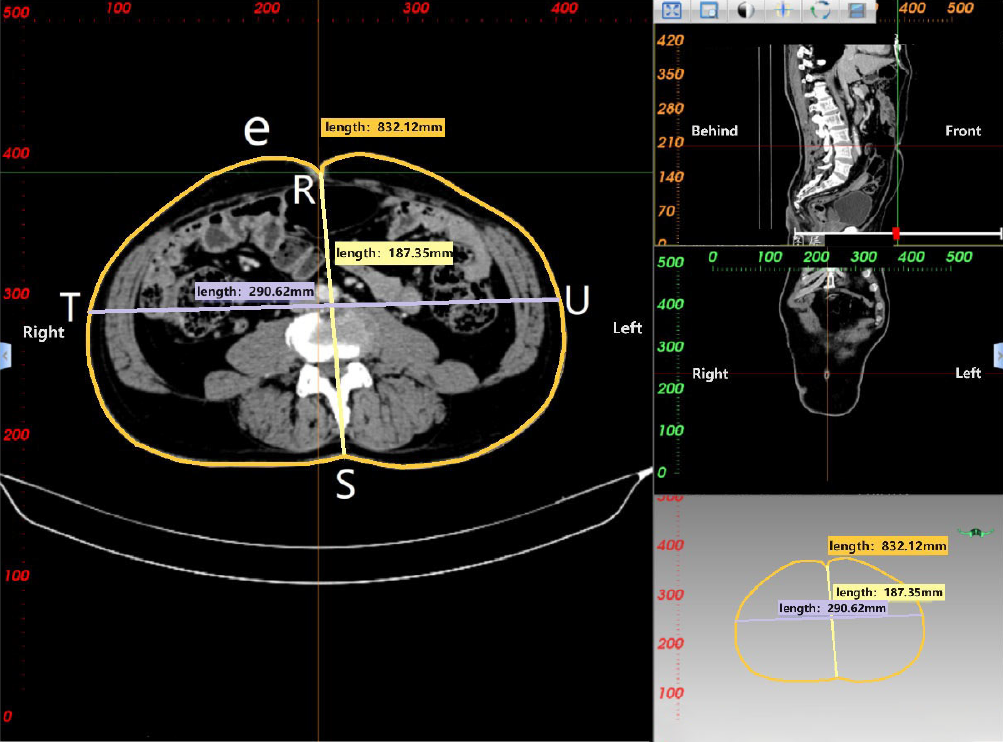
Figure 5 Measurements of waist circumference, anterior-posterior abdominal diameter and transverse abdominal diameter.
Waist circumference (e): Circumference of the waist at the level of the umbilicus; anterior-posterior abdominal diameter (RS): Measurement distance from the umbilicus to the spine-wall intersection in the abdominal plane; transverse abdominal diameter (TU): Measurement distance along the horizontal line of the anterior margin of the lumbar vertebrae at the level of the umbilicus.
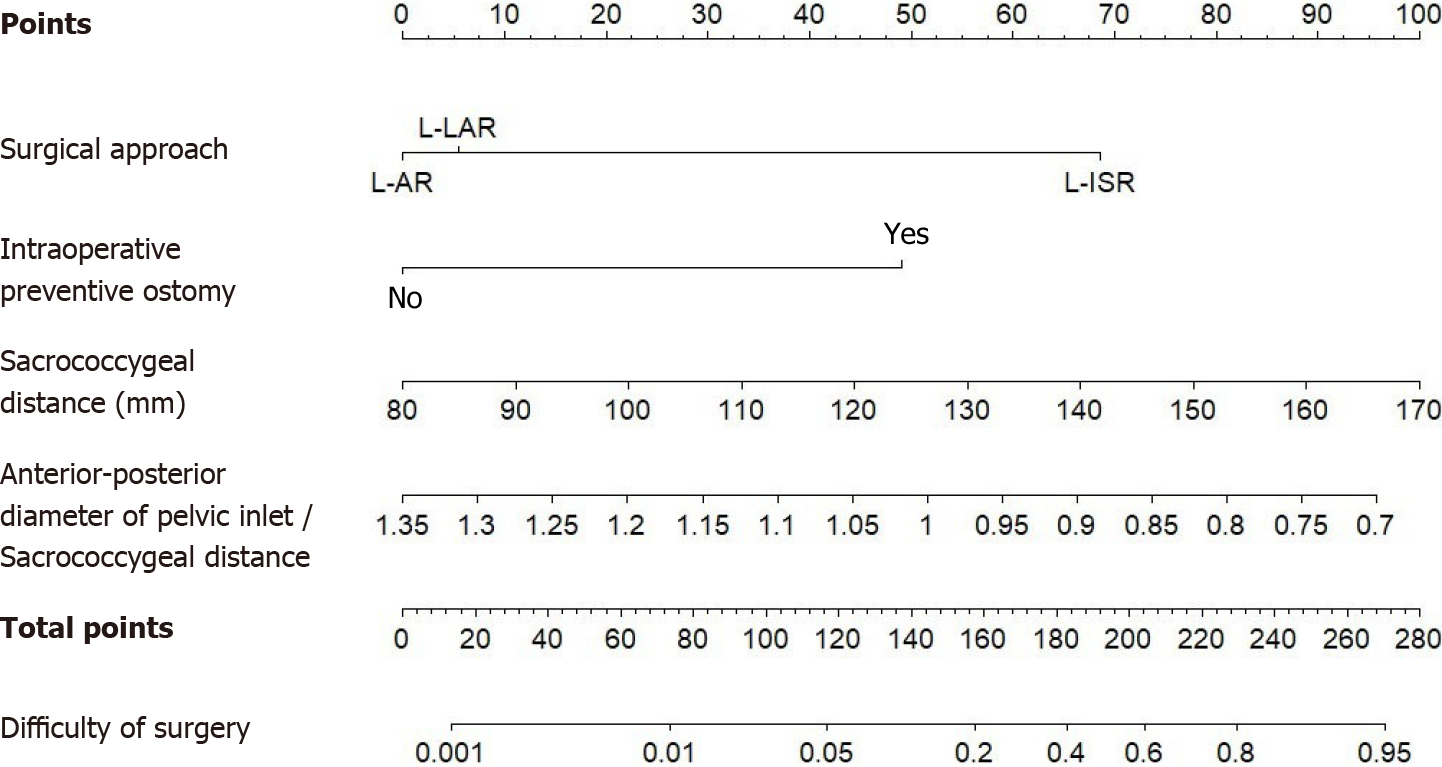
Figure 6 Based on the results of this study, the nomogram clinical prediction model was constructed to predict the difficulty of laparoscopic sphincter-preserving radical resection for rectal cancer based on the patient’s surgical approach, intraoperative preventive ostomy, sacrococcygeal distance, and anterior-posterior diameter of pelvic inlet/sacrococcygeal distance.
L-AR: Laparoscopic anterior resection; L-LAR: Laparoscopic low or ultralow anterior resection; L-ISR: Laparoscopic intersphincteric resection.
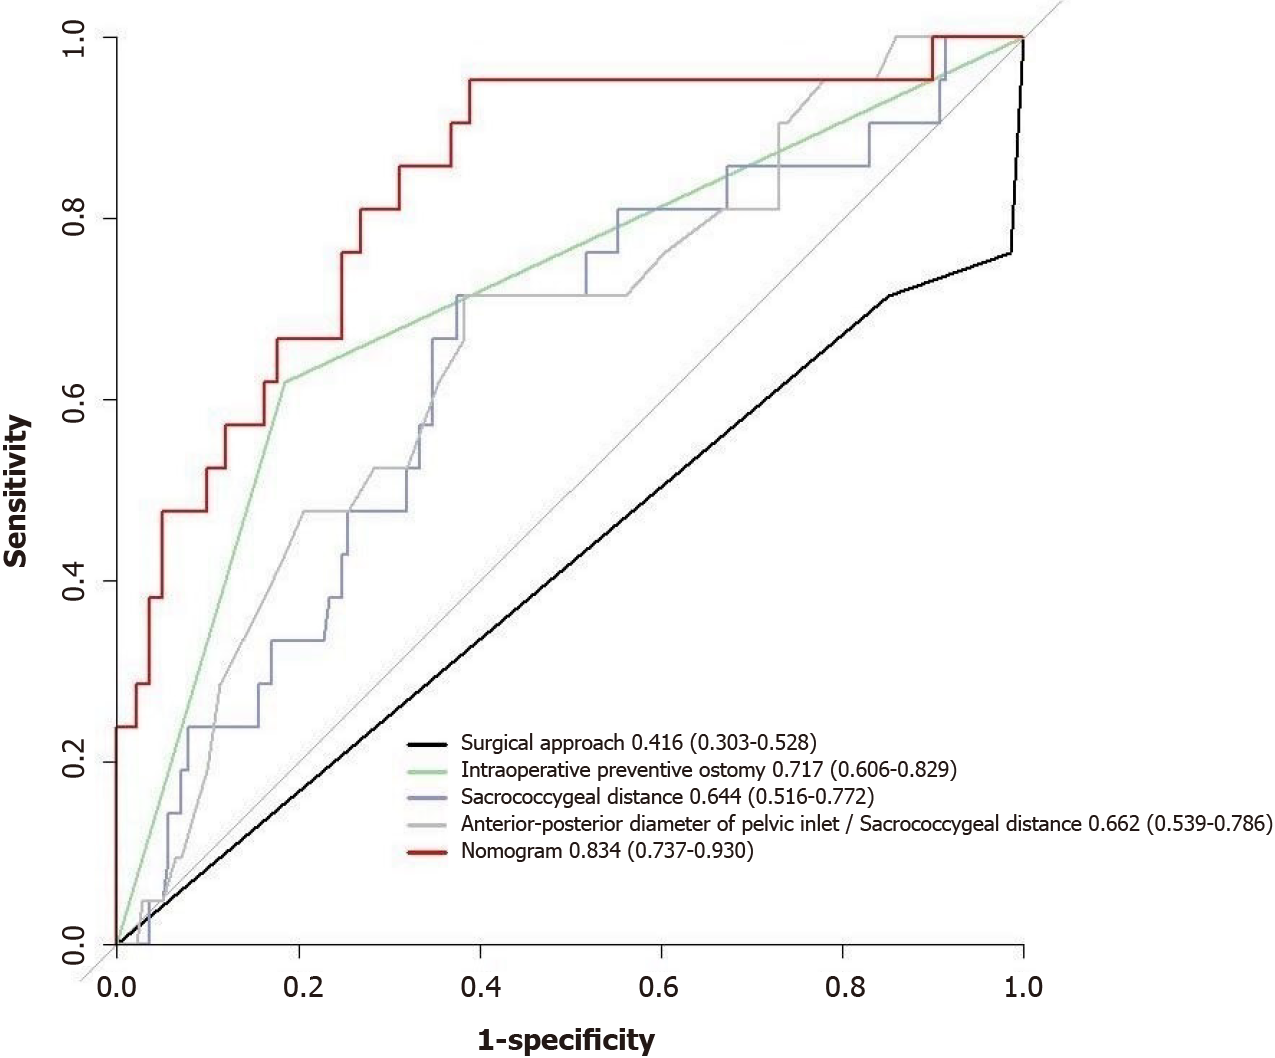
Figure 7 Receiver operating characteristic curve for each risk or protective factor and the nomogram prediction model predicting the difficulty of laparoscopic sphincter-preserving radical resection for rectal cancer.
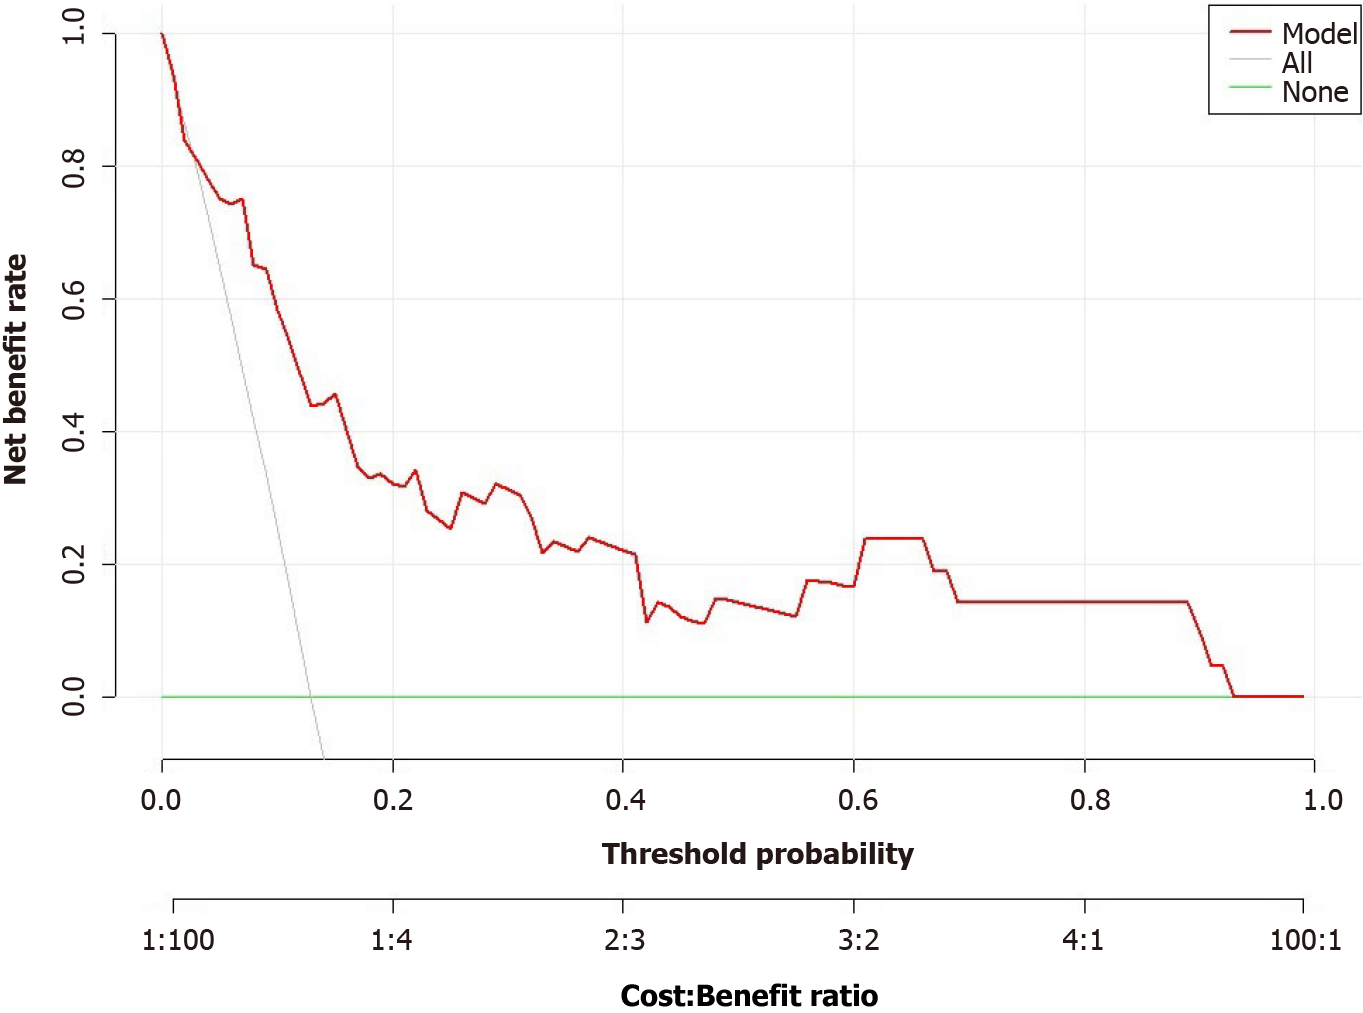
Figure 8 Evaluation of net benefit using decision curve analysis for the nomogram prediction model.
Y-axis measures net benefit, grey line indicates that all patients with rectal cancer experienced highly difficult laparoscopic sphincter-preserving radical resection for rectal cancer, and the green line indicates the hypothesis that no patients experienced highly difficult laparoscopic sphincter-preserving radical resection for rectal cancer.
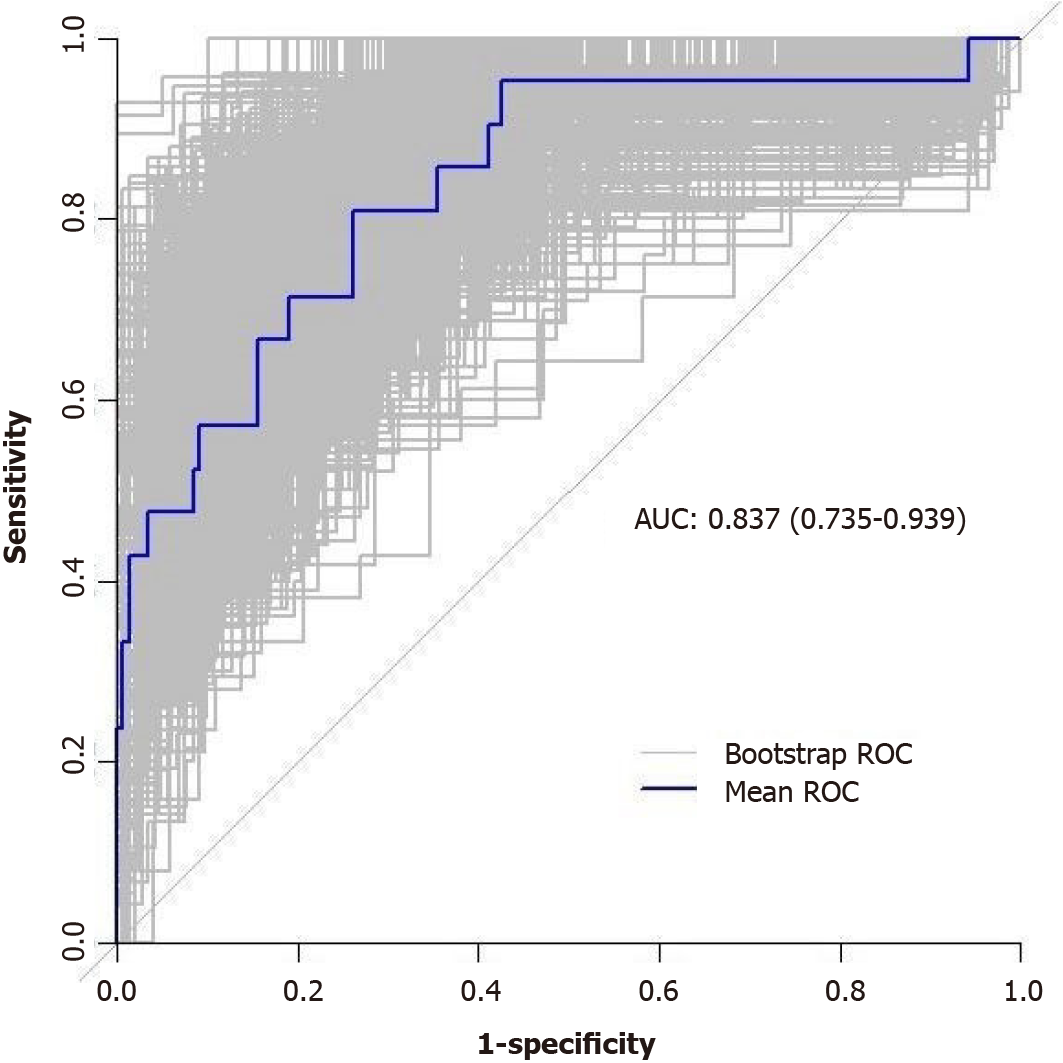
Figure 9 The model’s predictive ability was further validated through bootstrap internal sampling validation.
After 1000 repetitions of sampling, the internally validated C-index of the model was 0.837, suggesting good discriminative ability. AUC: Areas under the receiver operating characteristic curve.
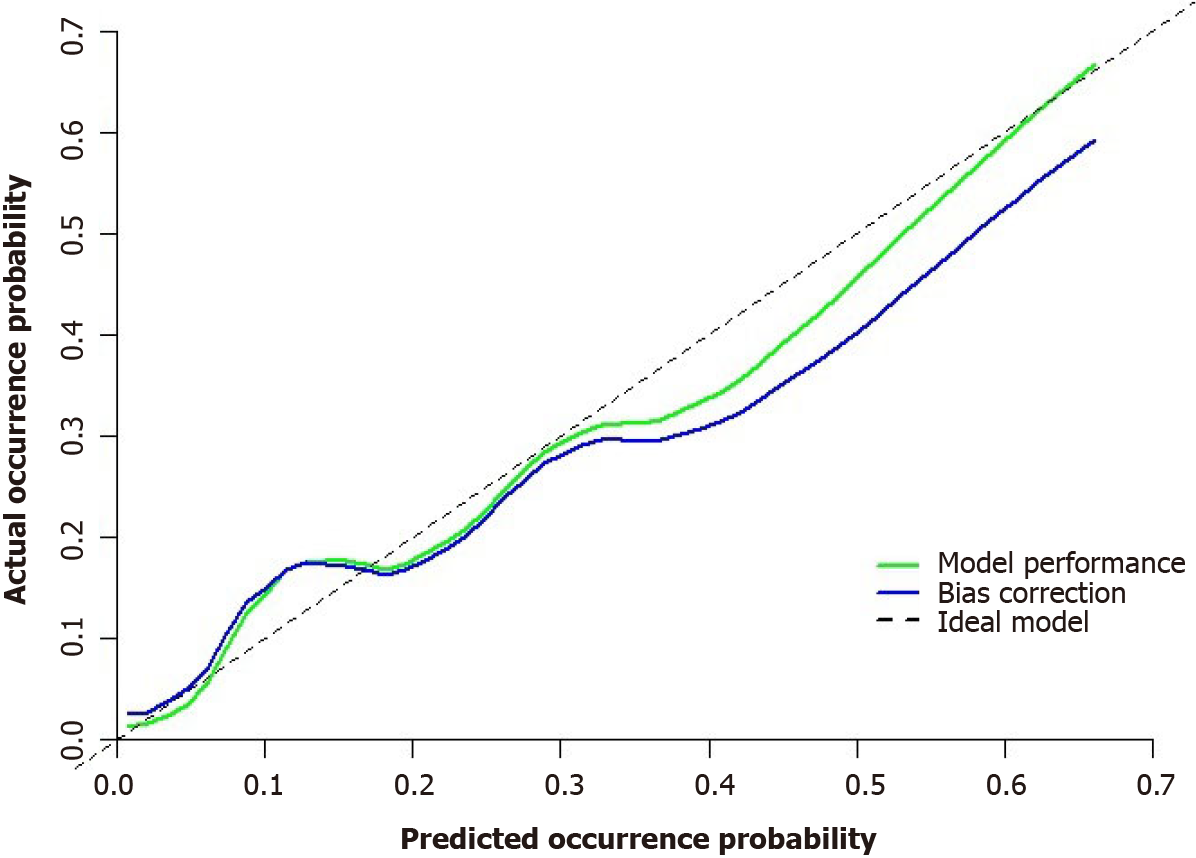
Figure 10 Correction curves for the nomogram prediction model predicting the difficulty of laparoscopic sphincter-preserving radical resection for rectal cancer.
Note: The y-axis is the probability of the actual difficulty of laparoscopic sphincter-preserving radical resection for rectal cancer, and the x-axis is the probability of the predicted difficulty of laparoscopic sphincter-preserving radical resection for rectal cancer. The diagonal dotted line represents the perfect prediction of an ideal model, and the green line represents the performance of the nomogram. The closer it is to the diagonal dotted line, the better the prediction performance.
- Citation: Zhou XC, Guan SW, Ke FY, Dhamija G, Wang Q, Chen BF. Construction of a nomogram model to predict technical difficulty in performing laparoscopic sphincter-preserving radical resection for rectal cancer. World J Gastroenterol 2024; 30(18): 2418-2439
- URL: https://www.wjgnet.com/1007-9327/full/v30/i18/2418.htm
- DOI: https://dx.doi.org/10.3748/wjg.v30.i18.2418


