Copyright
©The Author(s) 2024.
World J Gastroenterol. Apr 28, 2024; 30(16): 2258-2271
Published online Apr 28, 2024. doi: 10.3748/wjg.v30.i16.2258
Published online Apr 28, 2024. doi: 10.3748/wjg.v30.i16.2258
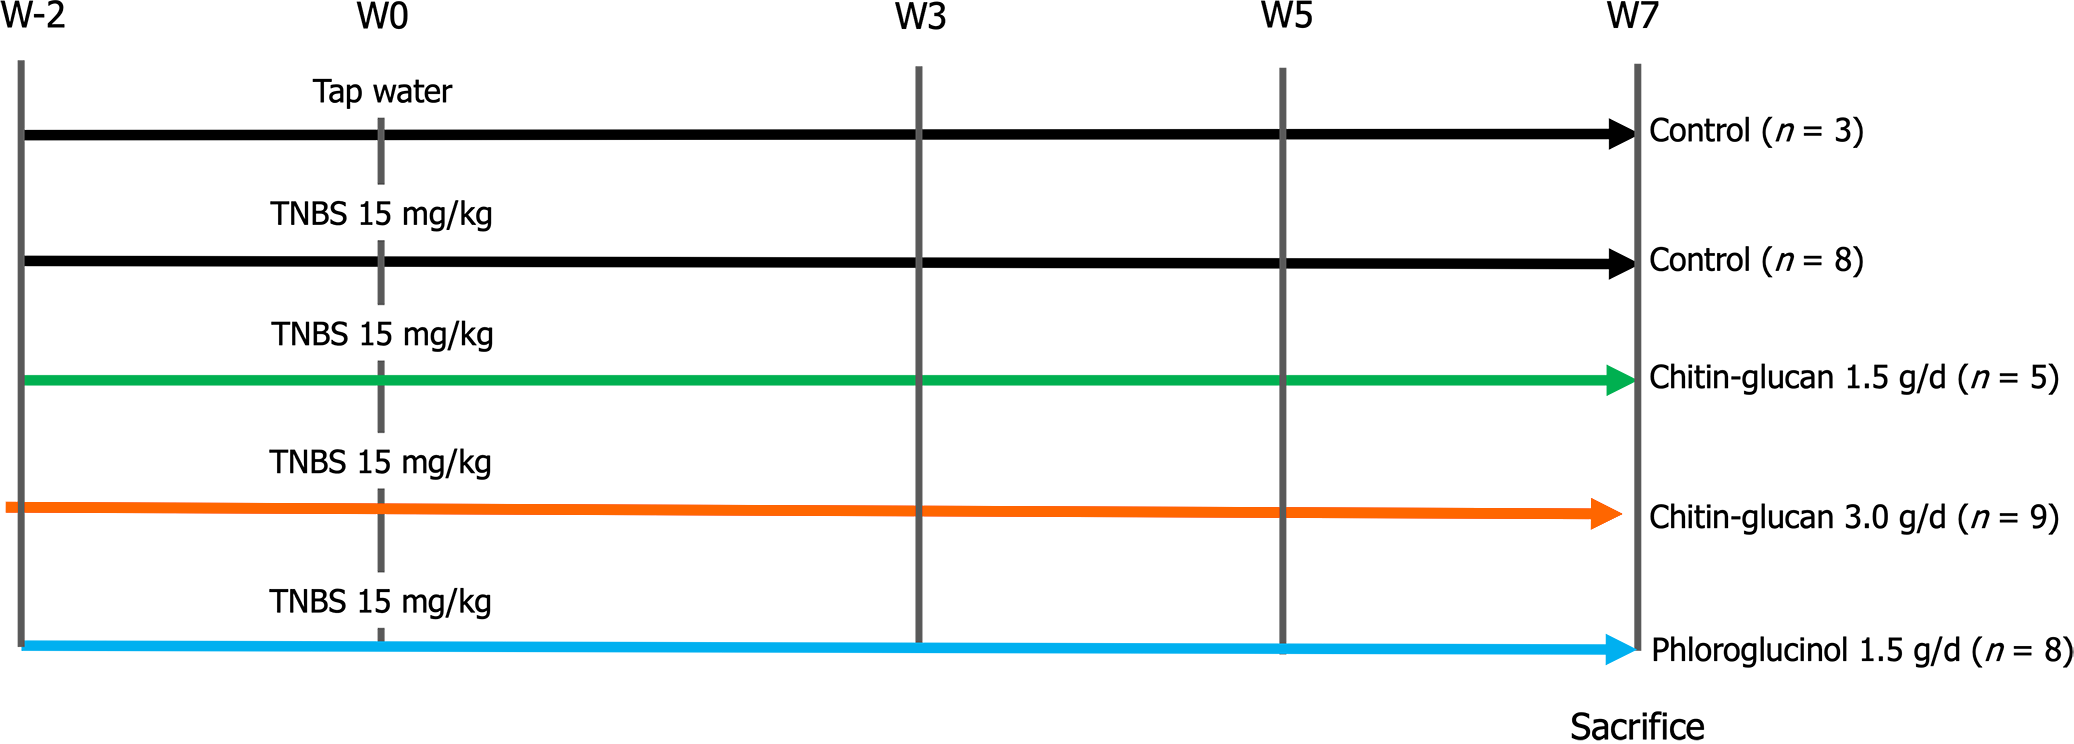
Figure 1 Long-lasting visceral hypersensitivity in rats.
Chitin-glucan analgesic effect evaluated by pain thresholds at week (W)-2-0-3-5-7.
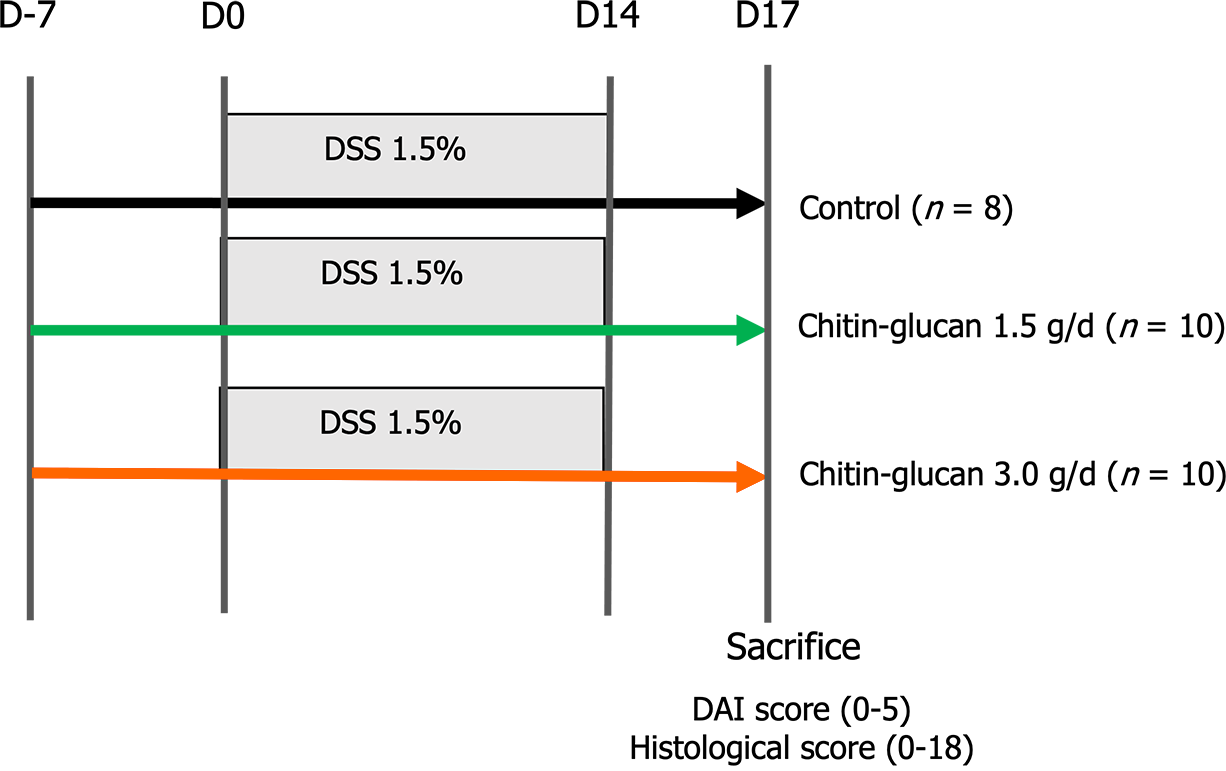
Figure 2 Dextran sodium sulfate-induced colitis in C57BL/6 mice.
DSS: Dextran sodium sulfate; DAI: Disease activity index.
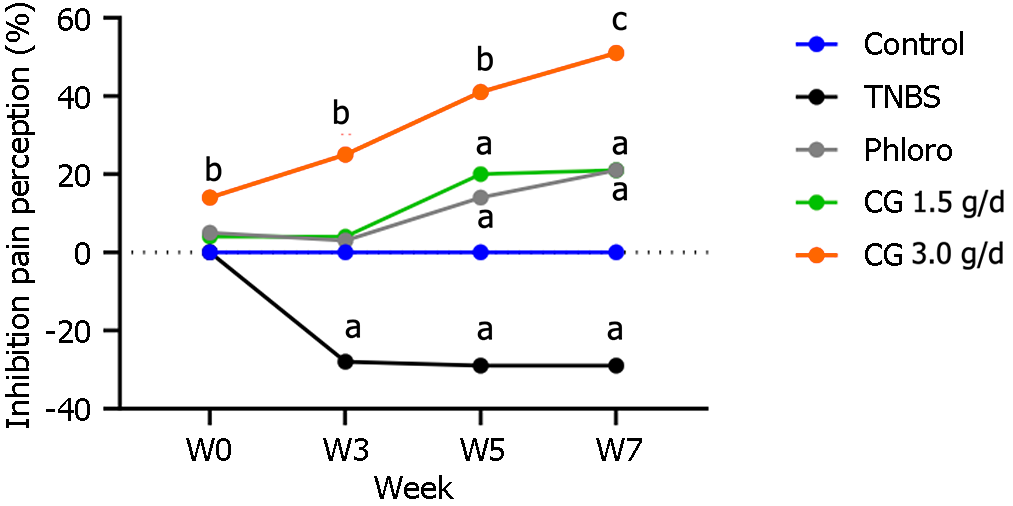
Figure 3 Time- and dose-related analgesic effects of chitin-glucan in rats with long-lasting TNBS-induced hypersensitivity.
Inhibition of pain perception in % at week (W) 0-3-5-7 compared to W-2 in untreated animals receiving tap water (Control in blue), untreated animals sensitized by TNBS (TNBS in black), TNBS sensitized rats treated with phloroglucinol (Phloro in grey), TNBS sensitized rats treated with chitin-glucan at 1.5 g/d [chitin glucan (CG) 1.5 g/d in green], TNBS sensitized rats treated with chitin-glucan at 3.0 g/d (CG 3.0 g/d in orange). aP < 0.05, bP < 0.01, cP < 0.001. CG: Chitin glucan.
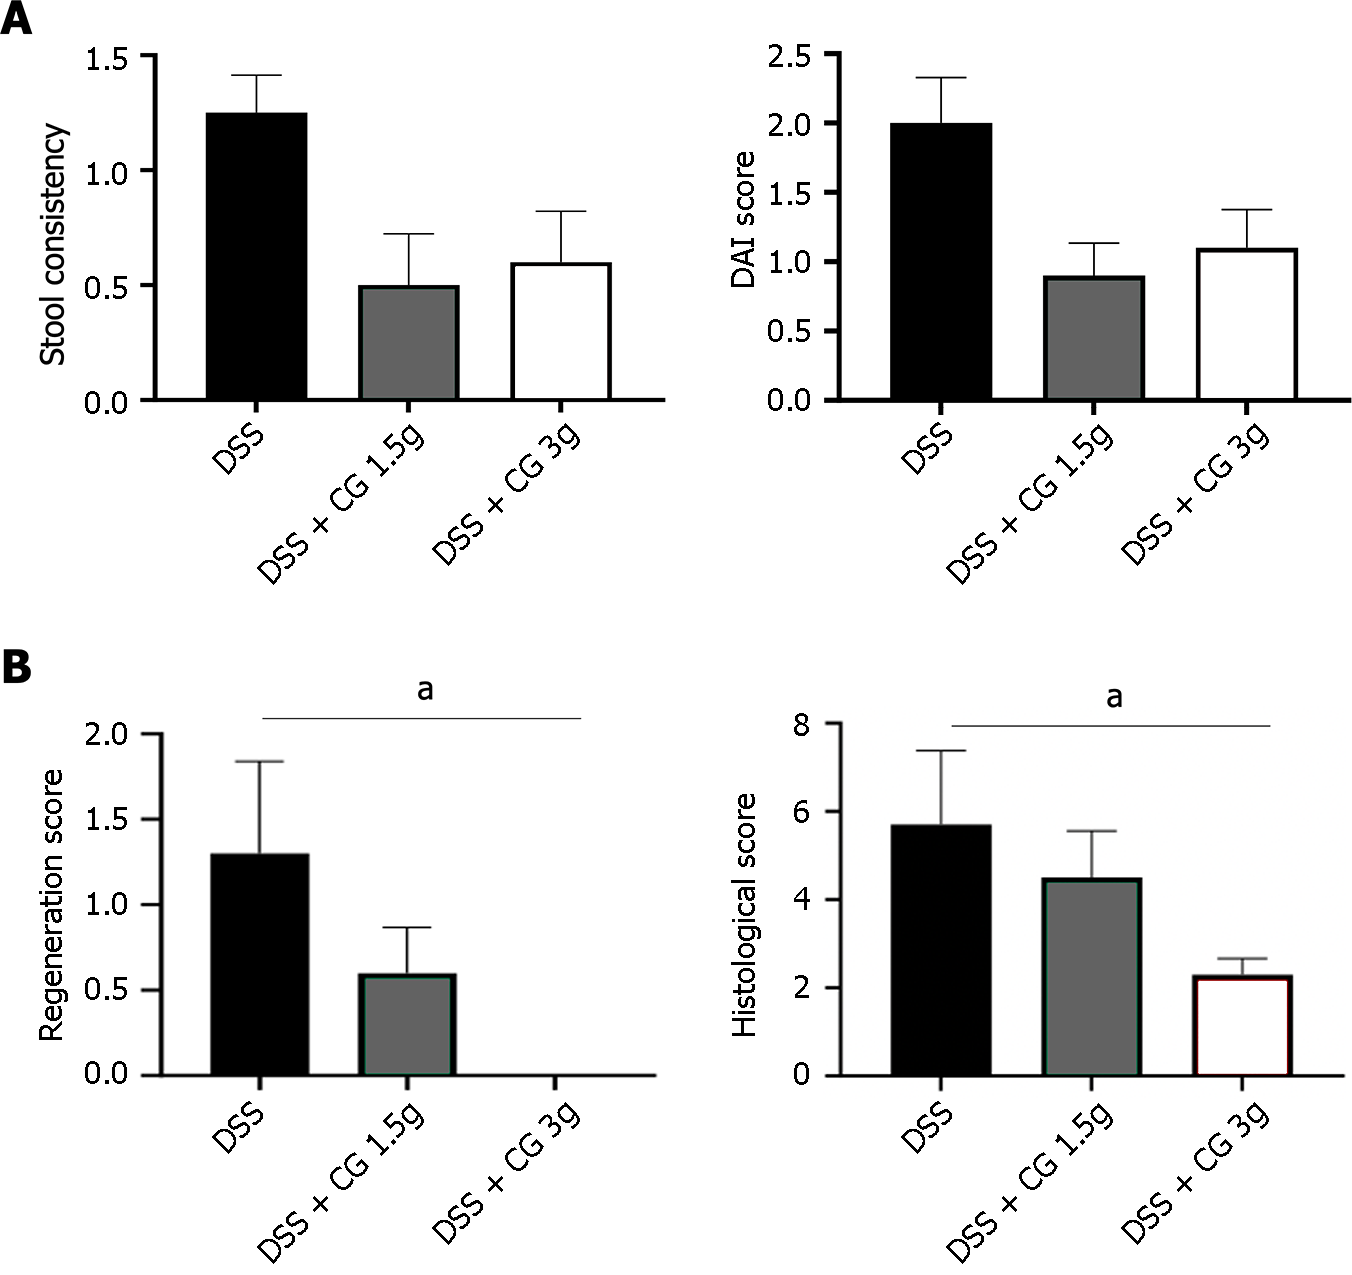
Figure 4 Improvement of clinical and histological scores in animals with colitis receiving chitin-glucan treatment.
A: Stool consistency in mice with colitis [Dextran sodium sulfate (DSS), black] was improved by chitin glucan (CG) treatment at a concentration of 1.5 g/d (DSS + CG: 1.5 g, grey), or 3 g/d (DSS + CG: 3.0 g, white); B: Disease activity index (DAI) in mice with colitis (DSS, black) was improved by CG treatment at 1.5 g/d (DSS + CG: 1.5 g, grey), or 3.0 g/d (DSS + CG: 3.0 g, white); C: Regeneration score in mice with colitis (DSS-induced, black) was improved by CG treatment at 1.5 g/d (DSS + CG: 1.5 g, grey), or 3.0 g/d (DSS + CG: 3.0 g, white); D: Histologial score in mice with colitis (DSS, black) was improved by CG treatment at 1.5 g/d (DSS + CG: 1.5 g, grey), or 3.0 g/d (DSS + CG 3.0 g, white). aP < 0.05. DSS: Dextran sodium sulfate; CG: Chitin glucan; DAI: Disease activity index.
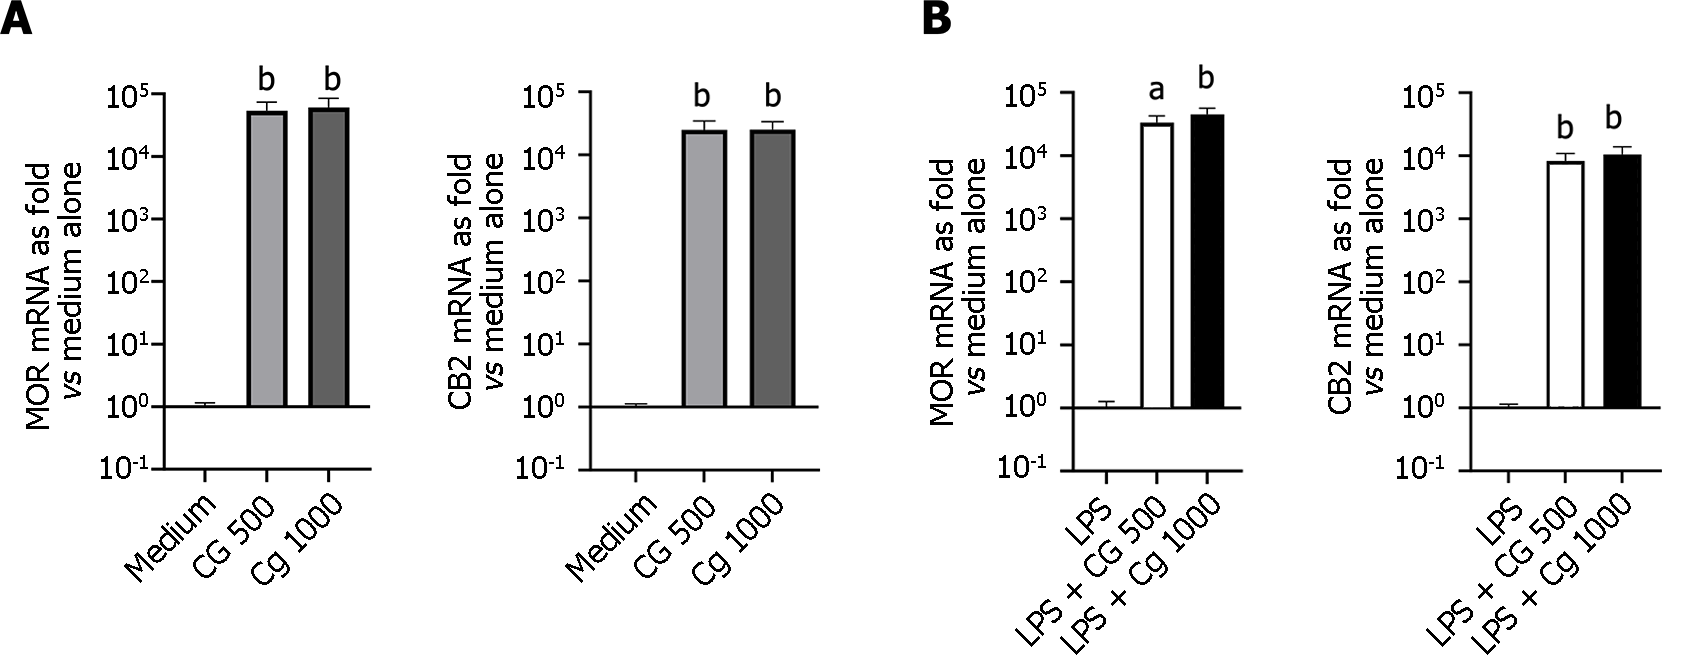
Figure 5 Modulation of analgesic-related receptors in HT-29 cells incubated with chitin-glucan at different concentrations, with or without lipopolysaccharide stimulation.
A: Modulation of analgesic-related receptors in non-stimulated HT-29 cells incubated for 3 h in medium alone (medium), chitin-glucan at 500 microgram per milliliter [chitin glucan (CG) 500, grey], or chitin-glucan at 1000 microgram per milliliter (CG 1000, dark grey); B: Modulation of analgesic-related receptors in HT-29 cells stimulated during 24 h with lipopolysaccharide (LPS) and incubated 3 additional hours in medium alone (LPS), chitin-glucan at 500 microgram per milliliter (LPS + CG: 500, white), or chitin-glucan at 1000 microgram per milliliter (LPS + CG: 1000, black). aP < 0.05, bP < 0.01. MOR: Mu-opioid receptor; CB2: Cannabinoid receptor; CG: Chitin glucan; LPS: Lipopolysaccharide.
Figure 6 Modulation of inflammatory-related cytokines in HT-29 cells incubated with chitin-glucan at different concentrations, with or without lipopolysaccharide stimulation.
A: Modulation of inflammatory-related cytokines in non-stimulated HT-29 cells incubated for 3 h in medium alone (medium, white), chitin-glucan at 500 microgram per milliliter [chitin glucan (CG): 500, grey)], or chitin-glucan at 1000 microgram per milliliter (CG 1000, dark grey); B: Modulation of inflammatory-related cytokines in HT-29 cells stimulated during 24 h by lipopolysaccharide (LPS) and incubated 3 additional hours in medium alone (LPS, white), chitin-glucan at 500 microgram per milliliter (LPS + CG 500, grey), or chitin-glucan at 1000 microgram per milliliter (LPS + CG 1000, black). bP < 0.01. IL-1b: Interleukin-1 beta; IL-8: Interleukin-8; IL-10: Interleukin-10; CG: Chitin glucan; LPS: Lipopolysaccharide.
Figure 7 Modulation of intestinal barrier-related molecules in HT-29 cells incubated with chitin-glucan at different concentrations, with or without lipopolysaccharide stimulation.
A: Modulation of intestinal barrier-related molecules in non-stimulated HT-29 cells incubated for 3 h in medium alone (medium, white), chitin-glucan at 500 microgram per milliliter [chitin glucan (CG): 500, grey)], or chitin-glucan at 1000 microgram per milliliter (CG 1000, dark grey); B: Modulation of intestinal barrier-related molecules in HT-29 cells stimulated during 24 h by lipopolysaccharide (LPS) and incubated 3 additional hours in medium alone (LPS, white), chitin-glucan at 500 microgram per milliliter (LPS + CG: 500, grey), or chitin-glucan at 1000 microgram per milliliter (LPS + CG: 1000, black). bP < 0.01. MUC5AC: Mucin-5AC; ZO-2: Zonula occludens-2; CG: Chitin glucan; LPS: Lipopolysaccharide.
Figure 8 Molecular modelling of interaction between lipopolysaccharide and chitin-glucan.
A: Trapping of lipopolysaccharide (LPS) (O antigen moiety colored in yellow and lipid A moiety colored in magenta) by chitin-glucan (CG) (chitin moiety colored in orange and glucan moiety colored in green); B: Folding of CG into a hairpin showing the cavity that hosts LPS in its middle (chitin moiety colored in orange and glucan moiety colored in green); C: Interactions of LPS (O antigen moiety colored in magenta and lipid A moiety colored in blue) with CG (chitin moiety colored in orange and glucan moiety colored in green) via a network of 18 hydrogen bonds (yellow dashed line).
Figure 9 Molecular modelling of interaction between lipoteichoic acid and chitin-glucan.
A: Trapping of lipoteichoic acid (LTA) (colored in yellow) by chitin-glucan (CG) (chitin moiety colored in orange and glucan moiety colored in green); B: Folding of CG showing a small hole occupied by the shortest lipidic side chain of LTA (chitin moiety colored in orange and glucan moiety colored in green); C: Interactions of LTA (colored in magenta) with CG (chitin moiety colored in orange and glucan moiety colored in green) via four hydrogen bonds (yellow dashed line).
Figure 10 Molecular modelling of interaction between phospholipomannan and chitin-glucan.
A: Trapping of phospholipomannan (PLM) (colored in yellow) by chitin-glucan (CG) (chitin moiety colored in orange and glucan moiety colored in green); B: Folding of CG showing the large cavity that hosts PLM in its middle (chitin moiety colored in orange and glucan moiety colored in green); C: Lipophilic potential surfaces (according to the lipophilicity scale from blue for the minimum until brown for the maximum) of PLM trapped by CG (chitin moiety colored in orange and glucan moiety colored in green); D: Interactions of PLM (colored in magenta) with CG (chitin moiety colored in orange and glucan moiety colored in green) via a network of 13 hydrogen bonds (yellow dashed line).
- Citation: Valibouze C, Dubuquoy C, Chavatte P, Genin M, Maquet V, Modica S, Desreumaux P, Rousseaux C. Chitin-glucan improves important pathophysiological features of irritable bowel syndrome. World J Gastroenterol 2024; 30(16): 2258-2271
- URL: https://www.wjgnet.com/1007-9327/full/v30/i16/2258.htm
- DOI: https://dx.doi.org/10.3748/wjg.v30.i16.2258


