Copyright
©The Author(s) 2024.
World J Gastroenterol. Apr 28, 2024; 30(16): 2249-2257
Published online Apr 28, 2024. doi: 10.3748/wjg.v30.i16.2249
Published online Apr 28, 2024. doi: 10.3748/wjg.v30.i16.2249
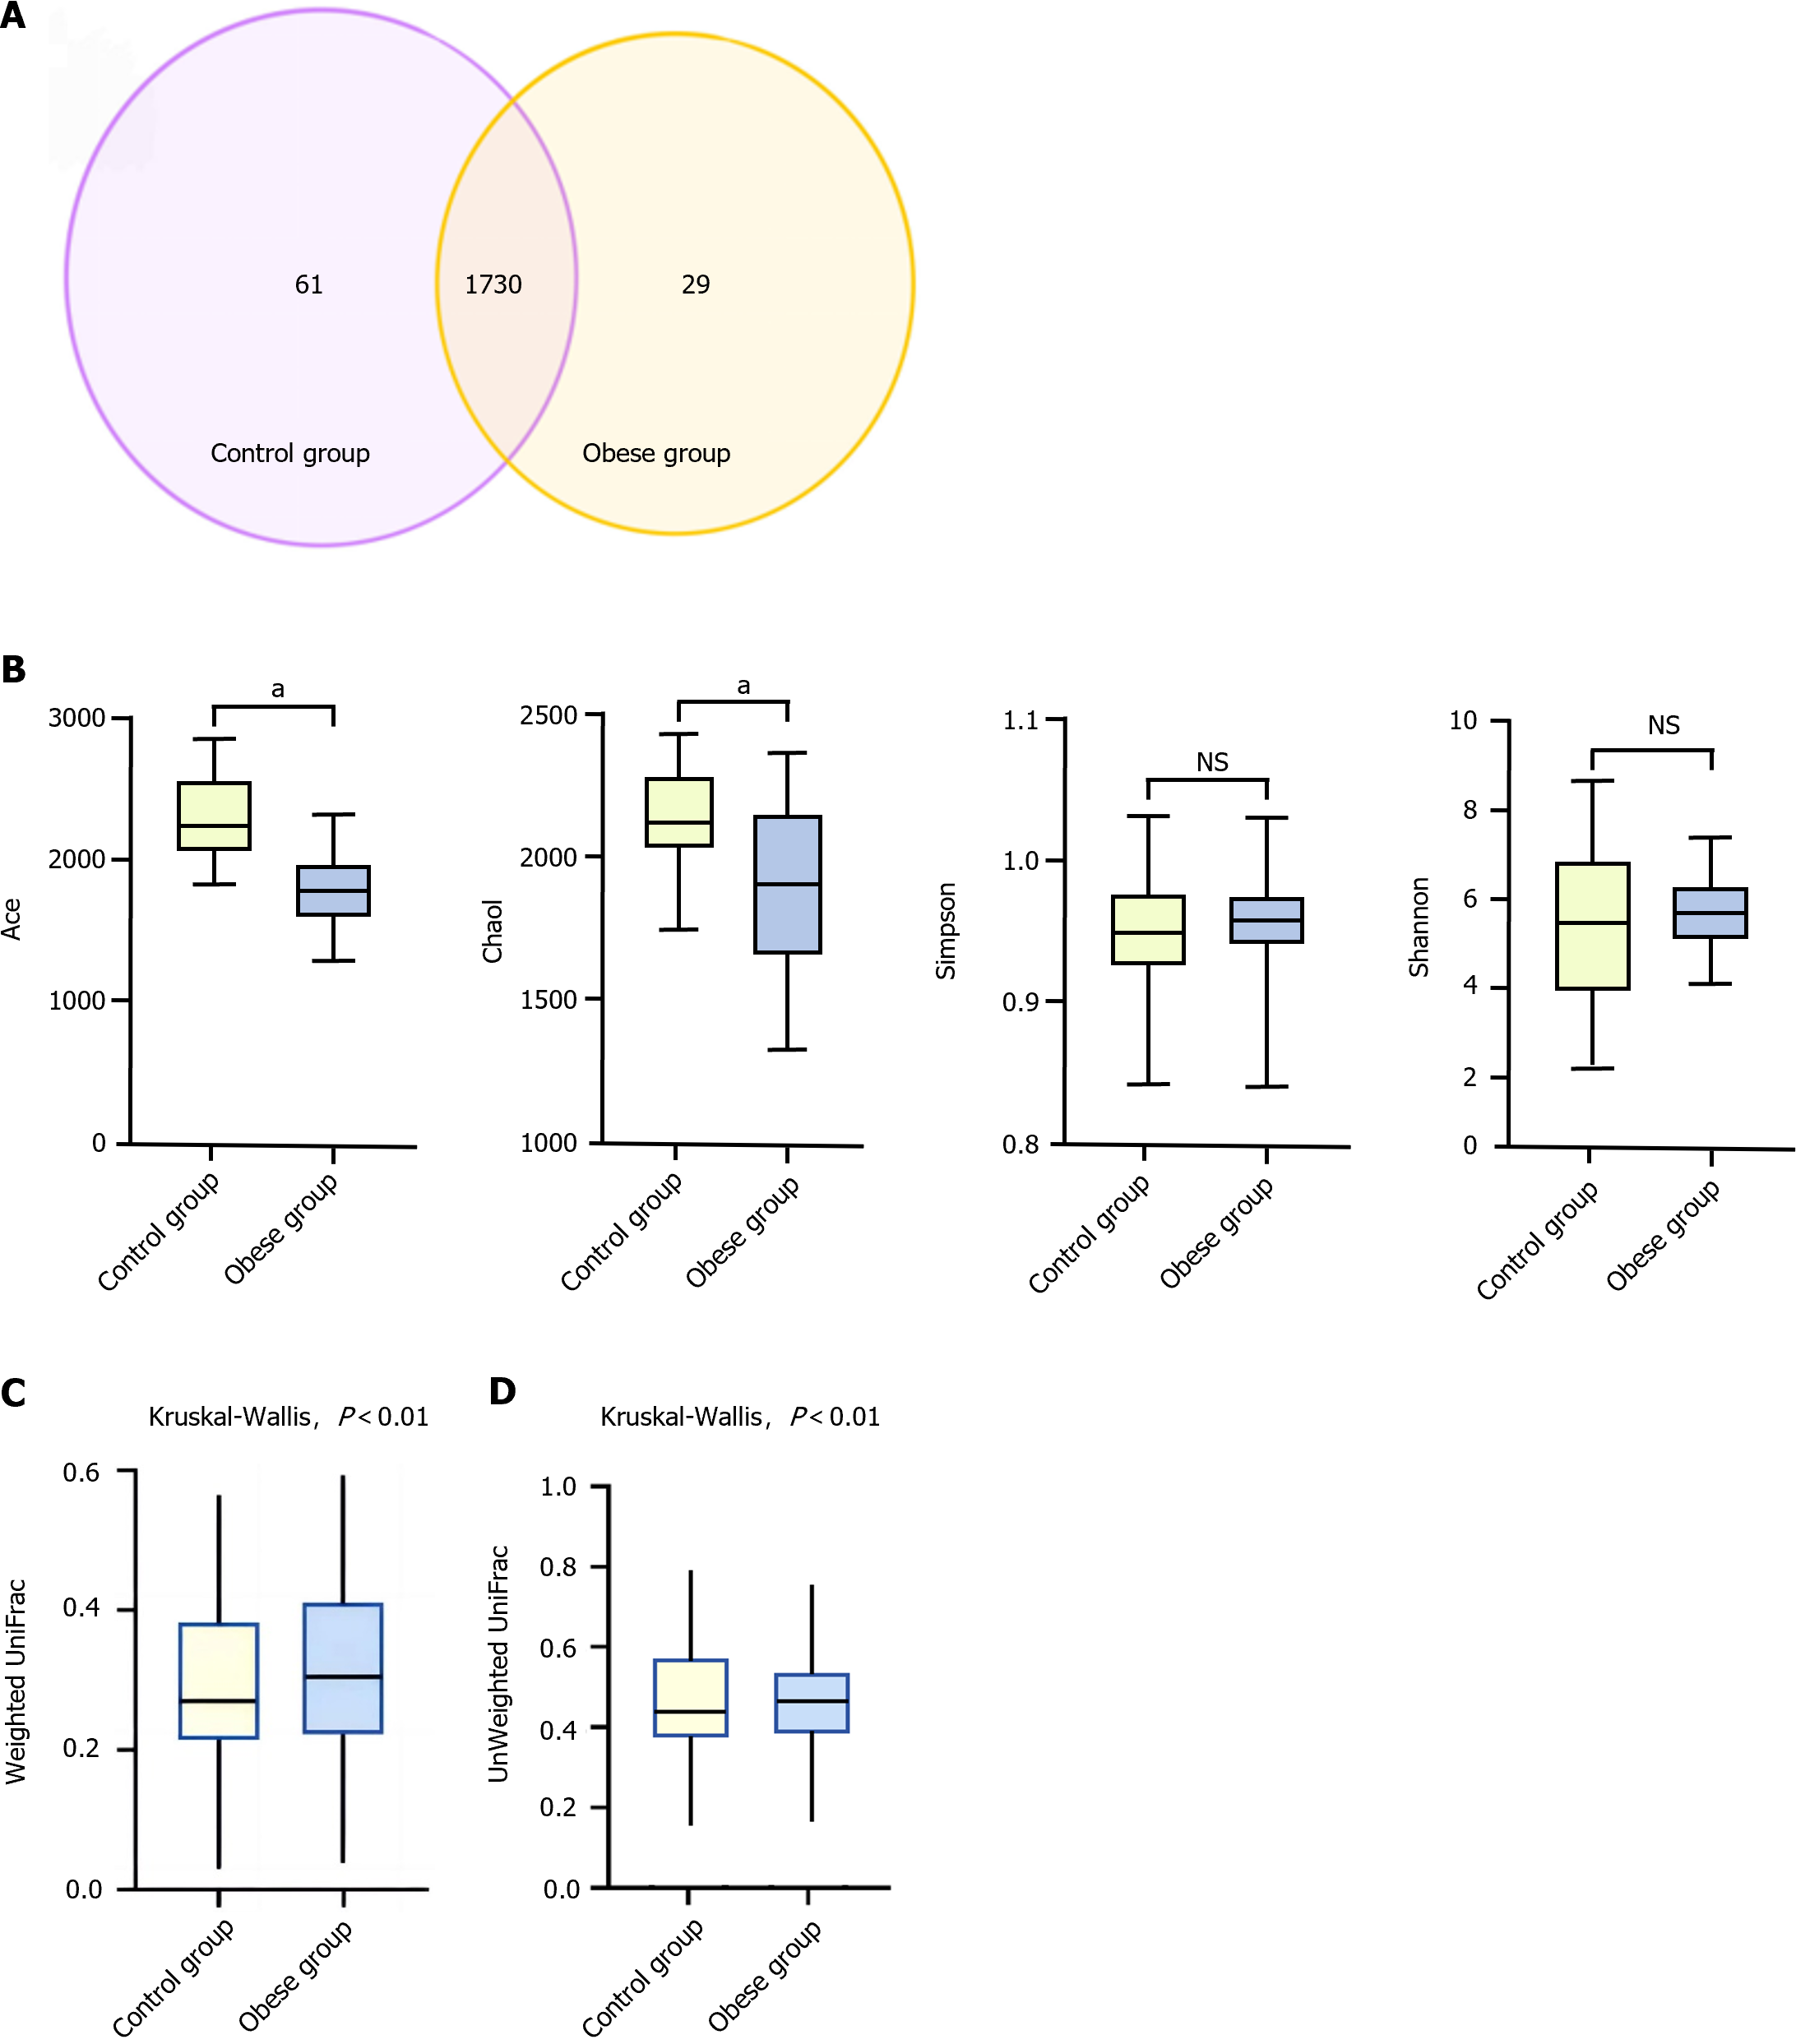
Figure 1 Basic analysis of gut microbiota.
A: Venn diagram illustrating the richness of operational taxonomic units in children; B: Alpha diversity analysis of gut microbiota in the control group and obese group children; C and D: Beta diversity distance comparison. aP < 0.001.
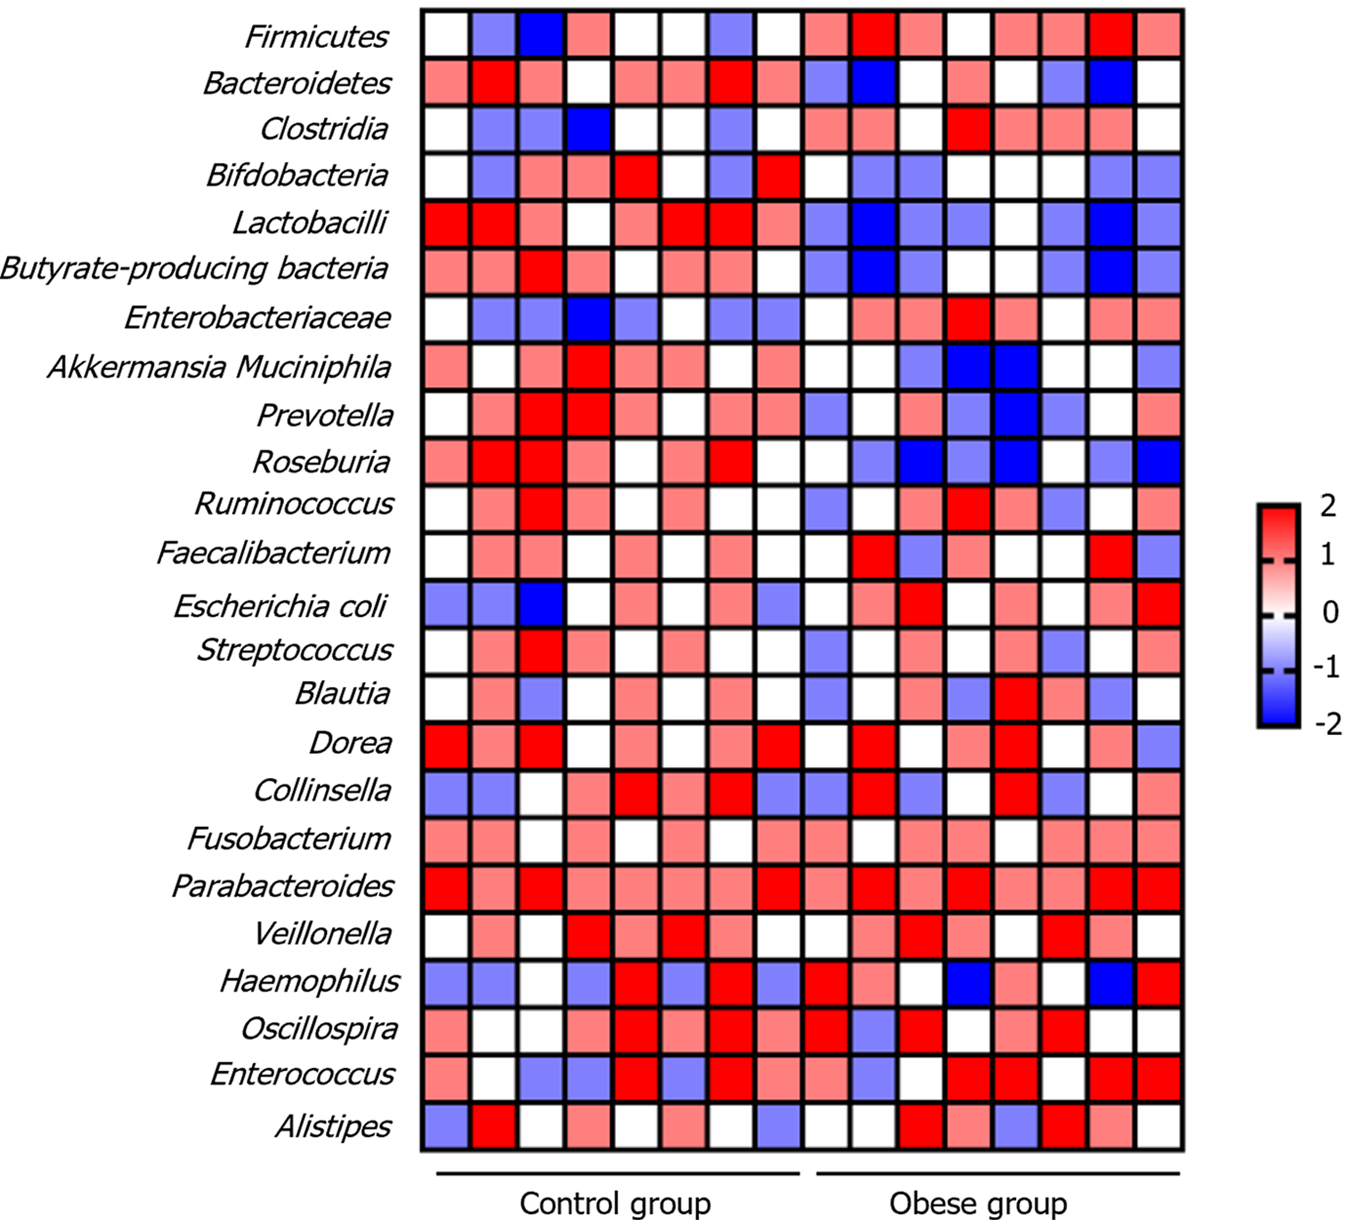
Figure 2 Comparative heat map of gut microbial communities in obese and normal-weight children.
- Citation: Li XM, Lv Q, Chen YJ, Yan LB, Xiong X. Association between childhood obesity and gut microbiota: 16S rRNA gene sequencing-based cohort study. World J Gastroenterol 2024; 30(16): 2249-2257
- URL: https://www.wjgnet.com/1007-9327/full/v30/i16/2249.htm
- DOI: https://dx.doi.org/10.3748/wjg.v30.i16.2249


