Copyright
©The Author(s) 2024.
World J Gastroenterol. Apr 14, 2024; 30(14): 2018-2037
Published online Apr 14, 2024. doi: 10.3748/wjg.v30.i14.2018
Published online Apr 14, 2024. doi: 10.3748/wjg.v30.i14.2018
Figure 1 Abundance of Fusobacteriumnucleatum is significantly increased in colorectal cancer tissues.
A: 16S rDNA sequencing results of clinical tissue samples (A: Normal tissue; B: Colorectal cancer tissue; C: Paracancerous tissue); B: Fluorescence in situ hybridization results showed that the abundance of Fusobacterium nucleium in colorectal cancer tissue was significantly higher than that in normal colorectal tissue.
Figure 2 Abundance of butyrate-producing bacteria in fecal samples from colorectal cancer patients is lower compared to that of healthy individuals.
A: There were significant differences in bacterial composition between colorectal cancer and normal/adjacent tissues; B: Butyricimonas, Roseburia, Faecalibacterium and other butyric acid producing bacteria are enriched in the feces of healthy individuals; C: The abundance of Lac_Lachnospira, Lac_Roseburia, and Rum_Faecalibacterium in fecal samples of healthy people was significantly higher than that of colorectal cancer patients; D: The abundance of Trichospira and Rochella in the fecal samples of healthy people is significantly higher than that of patients with stage I-IV colorectal cancer, and the abundance of Fecal bacilli in the fecal samples of healthy people and patients with stage I colorectal cancer is higher.
Figure 3 Abundance of butyrate-producing bacteria is decreased in mice treated with Fusobacteriumnucleatum.
A and B: The 16S rDNA sequencing results showed that the abundance of fecal butyric acid-producing bacteria (Lac_Rosebaria and Clostridium) was lower than those of the control group in mice treated with Fusobacterium nucleatum by gavage (n = 12 for each group). Each bar represents the content of Clostridium (A) or Lactobacillus (B) in the feces of mice in the treatment group.
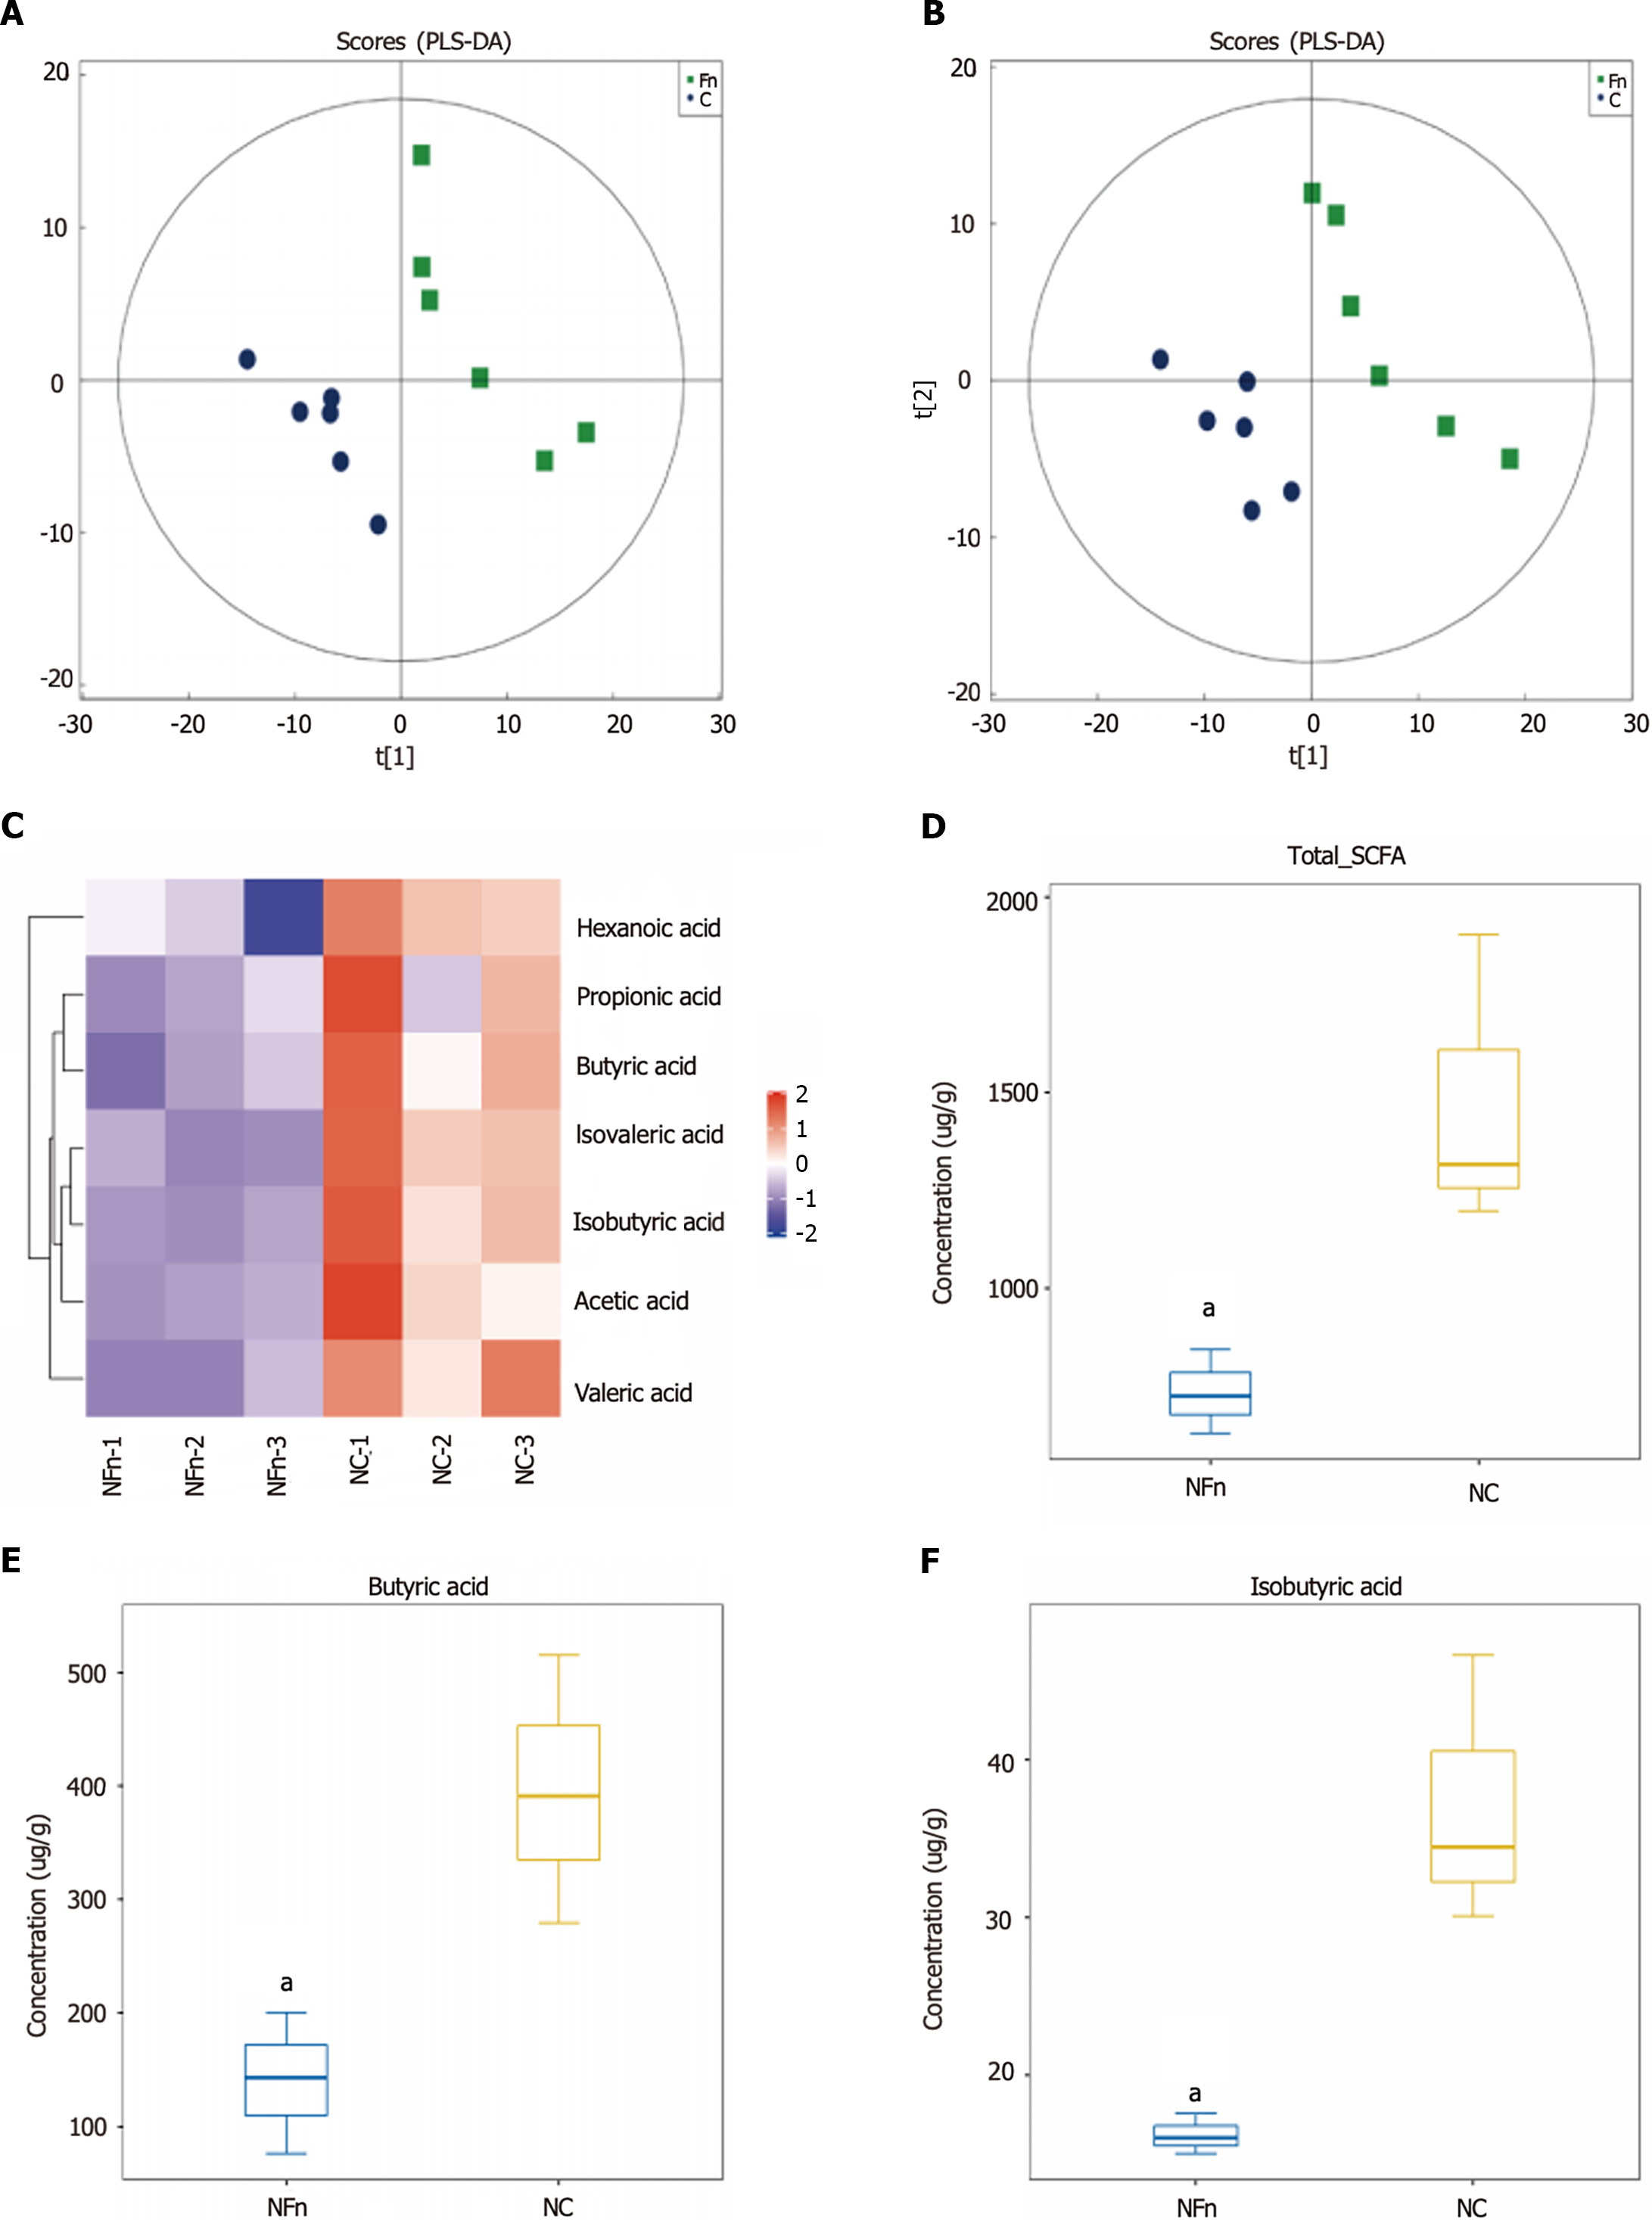
Figure 4 Fusobacteriumnucleatum inhibits the formation of the short chain fatty acid butyric acid.
A and B: Positive ion mode PLS-DA analysis diagram and negative ion mode PLS-DA analysis diagram show that there is a significant difference between the feces of mice treated with Fusobacterium nucleatum (F. nucleatum) and the control group (NC) in the PC1 direction (n = 6 for each group); C-F: The total amount of short-chain fatty acids (SCFAs), butyric acid, and isobutyric acid was significantly lower in the treatment group of F. nucleatum than the untreated group (n = 3 for each group). NFn: F. nucleatum treatment group. aP < 0.05.
Figure 5 Effects of sodium butyrate and Fusobacteriumnucleatum on the cell cycle of HCT116 and DLD-1 cells.
A: Sodium butyrate (NaB) blocks the cell cycle at G2/M phase, while treatment with Fusobacterium nucleatum has no significant effect on the cell cycle; B: Statistical analysis of flow cytometry results. ns: P > 0.05, bP < 0.01, cP < 0.001. FAB: Fusobacterium nucleatum supernatant.
Figure 6 Effects of Fusobacteriumnucleatum and sodium butyrate on mitochondrial membrane potential and reactive oxygen species in colorectal cancer cells.
A: Sodium butyrate (NaB) decreased the mitochondrial membrane potential of colorectal cancer cells; however, the mitochondrial membrane potential of the cells recovered after treatment with NaB and Fusobacterium nucleatum supernatant (FAB); B: Statistical results of mitochondrial membrane potential experiments. Data are presented as mean ± standard deviation (SD) from at least three independent experiments; C: NaB stimulates the generation of reactive oxygen species (ROS) in colorectal cancer cells, FAB decreased the effect of NaB and reduced NaB damage to mitochondria; D: Statistical results of ROS. Data from at least three independent experiments are expressed as mean ± SD. ns: P > 0.05, aP < 0.05, cP < 0.001.
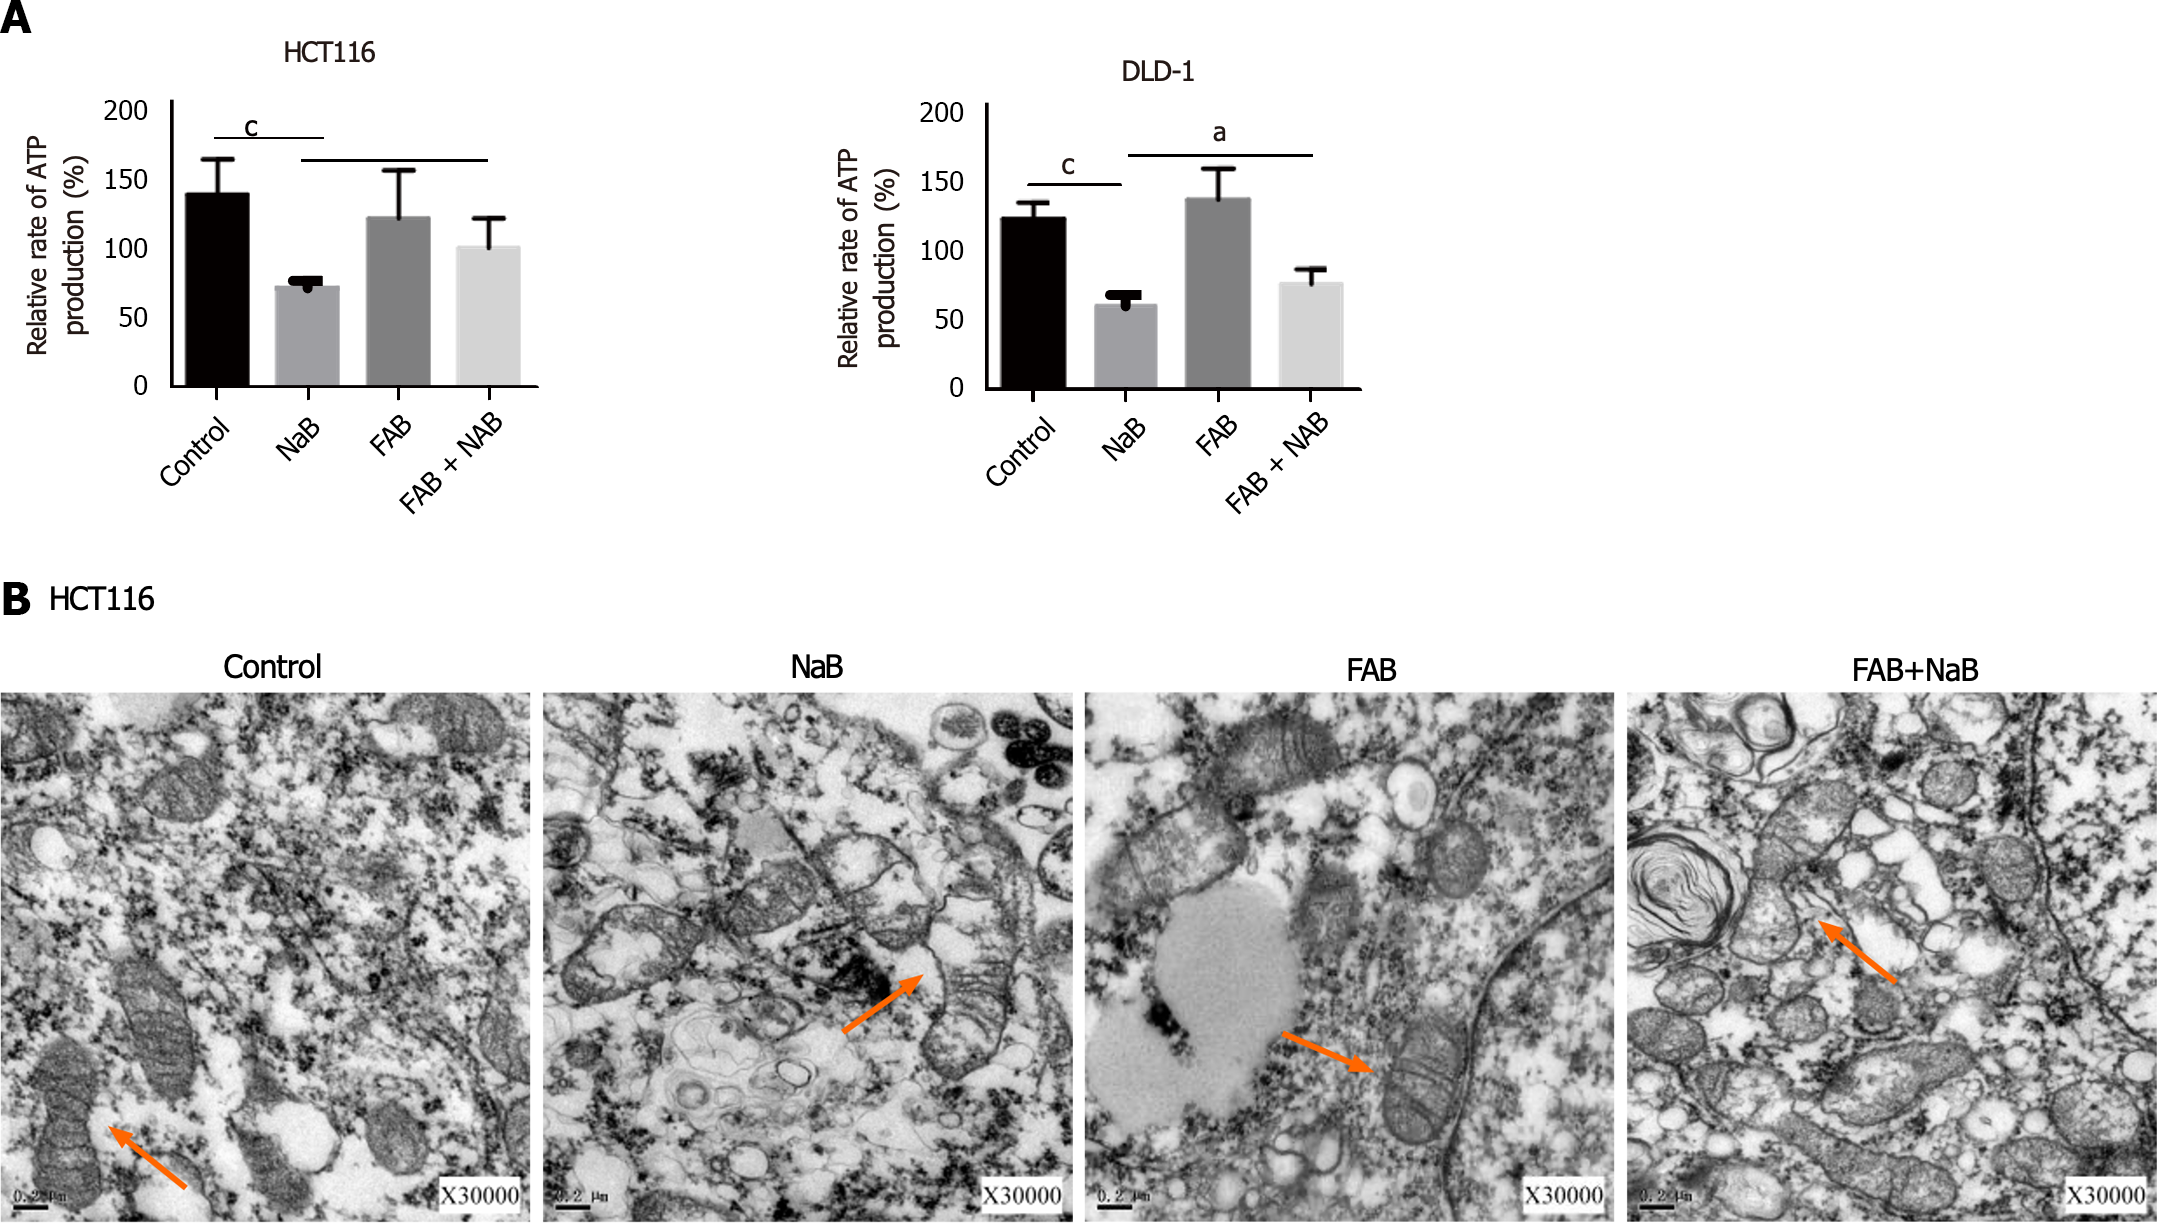
Figure 7 Sodium butyrate damages the mitochondrial morphology of colorectal cancer cells.
A: Sodium butyrate (NaB) inhibits adenosine triphosphate synthesis, but treatment with Fusobacterium nucleatum supernatants (FAB) suppresses this effect; B: After treatment with NaB and FAB, morphological changes of mitochondria were observed under transmission electron microscopy. aP < 0.05, cP < 0.001.
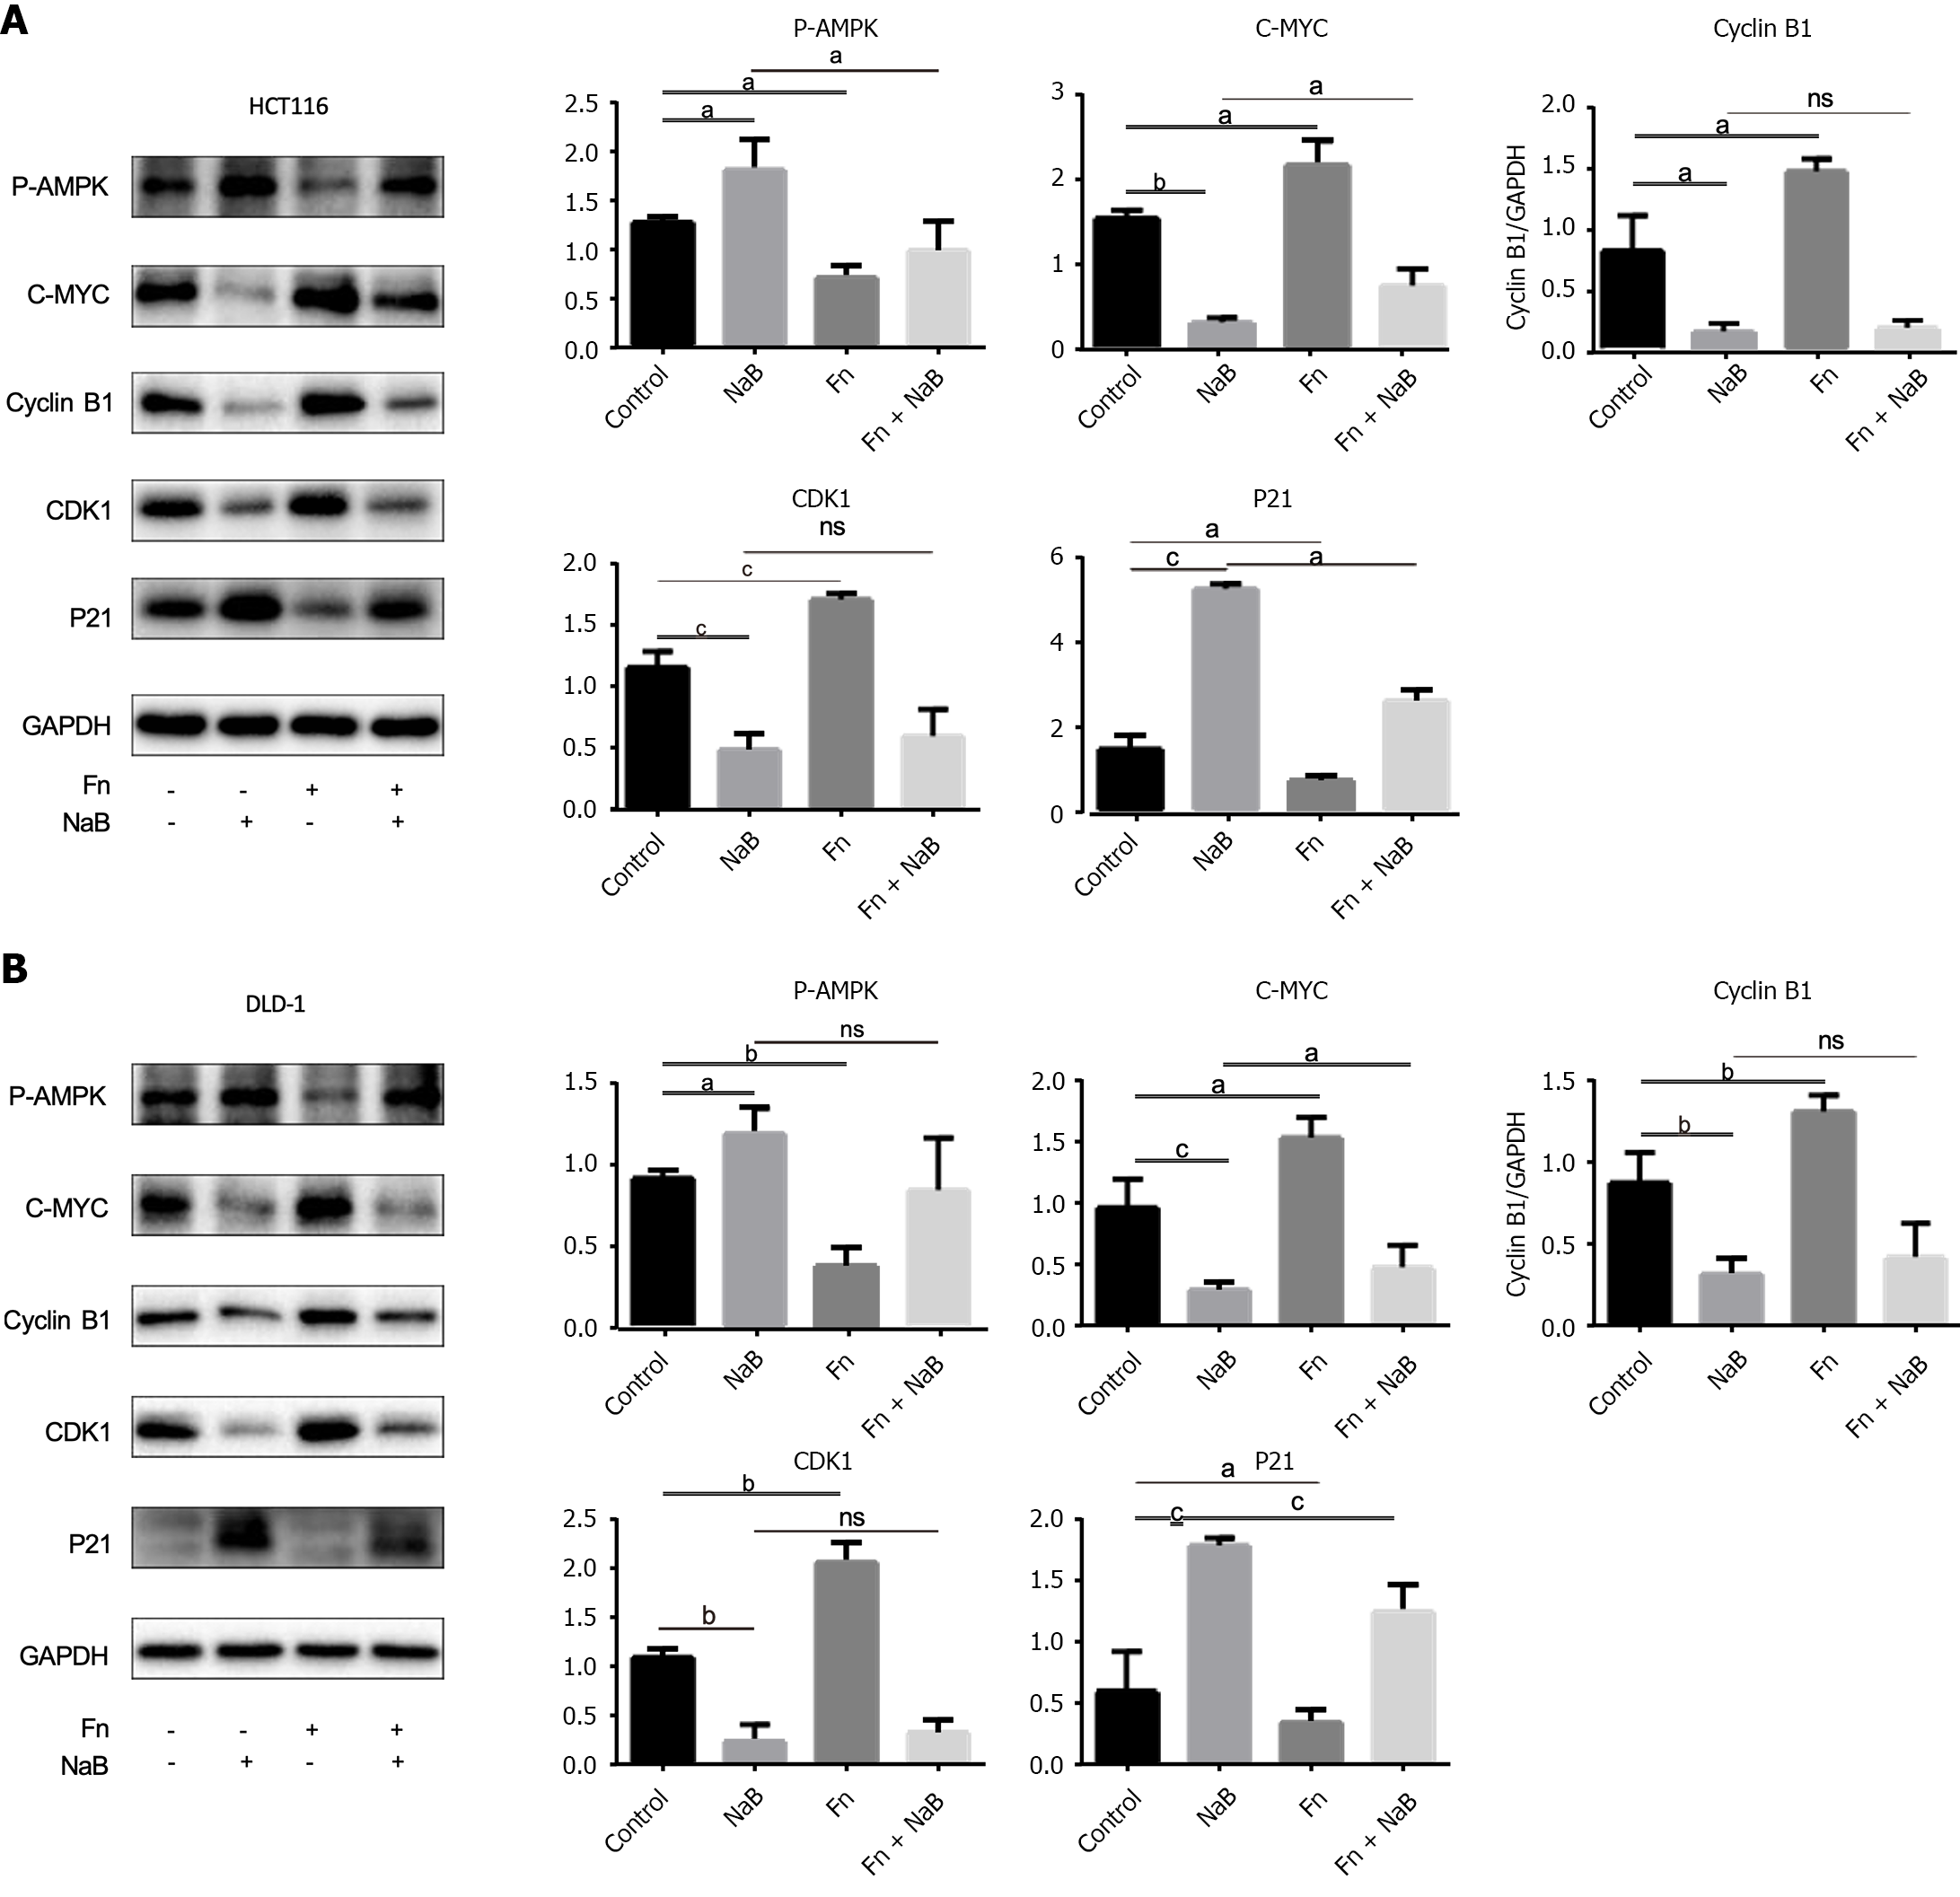
Figure 8 Sodium butyrate and Fusobacteriumnucleatum regulates the proliferation of colorectal cancer cells through the adenosine monophosphate-activated protein kinase signal pathway.
A and B: Adenosine monophosphate-activated protein kinase (AMPK) was activated in DLD-1 and HCT116 cells by treatment with sodium butyrate (NaB), leading to increased expression of phosphorylated AMPK (p-AMPK), decrease in expression of proliferation proteins such as CDK1, C-myc, and cyclin B1, and increase in expression of cycle arrest protein P21. However, treatment with Fusobacterium nucleatum inhibited the expression of p-AMPK. Data are expressed as mean ± standard deviation, from at least three independent experiments. aP < 0.05, bP < 0.01, cP < 0.001, ns: P > 0.05.
Figure 9 Adenosine monophosphate-activated protein kinaseα-specific small interfering RNA effectively reduced the expression of adenosine monophosphate-activated protein kinase and its phosphorylation in DLD-1 and HCT116 cells.
A and B: Adenosine monophosphate-activated protein kinase (AMPK)α-specific small interfering RNA (siRNA) reduces AMPK phosphorylation, increases the expression of proteins such as C-myc, CDK1, and Cyclin B1, and reduces the expression of P21. Data are expressed as mean ± standard deviation, from at least three independent experiments. aP < 0.05, bP < 0.01, cP < 0.001. NC: Control; p-AMPK: Phosphorylated-adenosine monophosphate-activated protein kinase.
Figure 10 Adenosine monophosphate-activated protein kinaseα-specific small interfering RNA inhibits the anticancer effect of sodium butyrate.
A and B: Sodium butyrate (NaB) activates adenosine monophosphate-activated protein kinase (AMPK), inhibits proliferative protein expression. However, after transfection with AMPK small interfering RNA (siRNA), AMPK is knocked down, and the inhibitory function of NaB on cancer is weakened. Data are expressed as mean ± standard deviation, from at least three independent experiments. aP < 0.05, bP < 0.01, cP < 0.001. NC: Control; p-AMPK: Phosphorylated adenosine monophosphate-activated protein kinase.
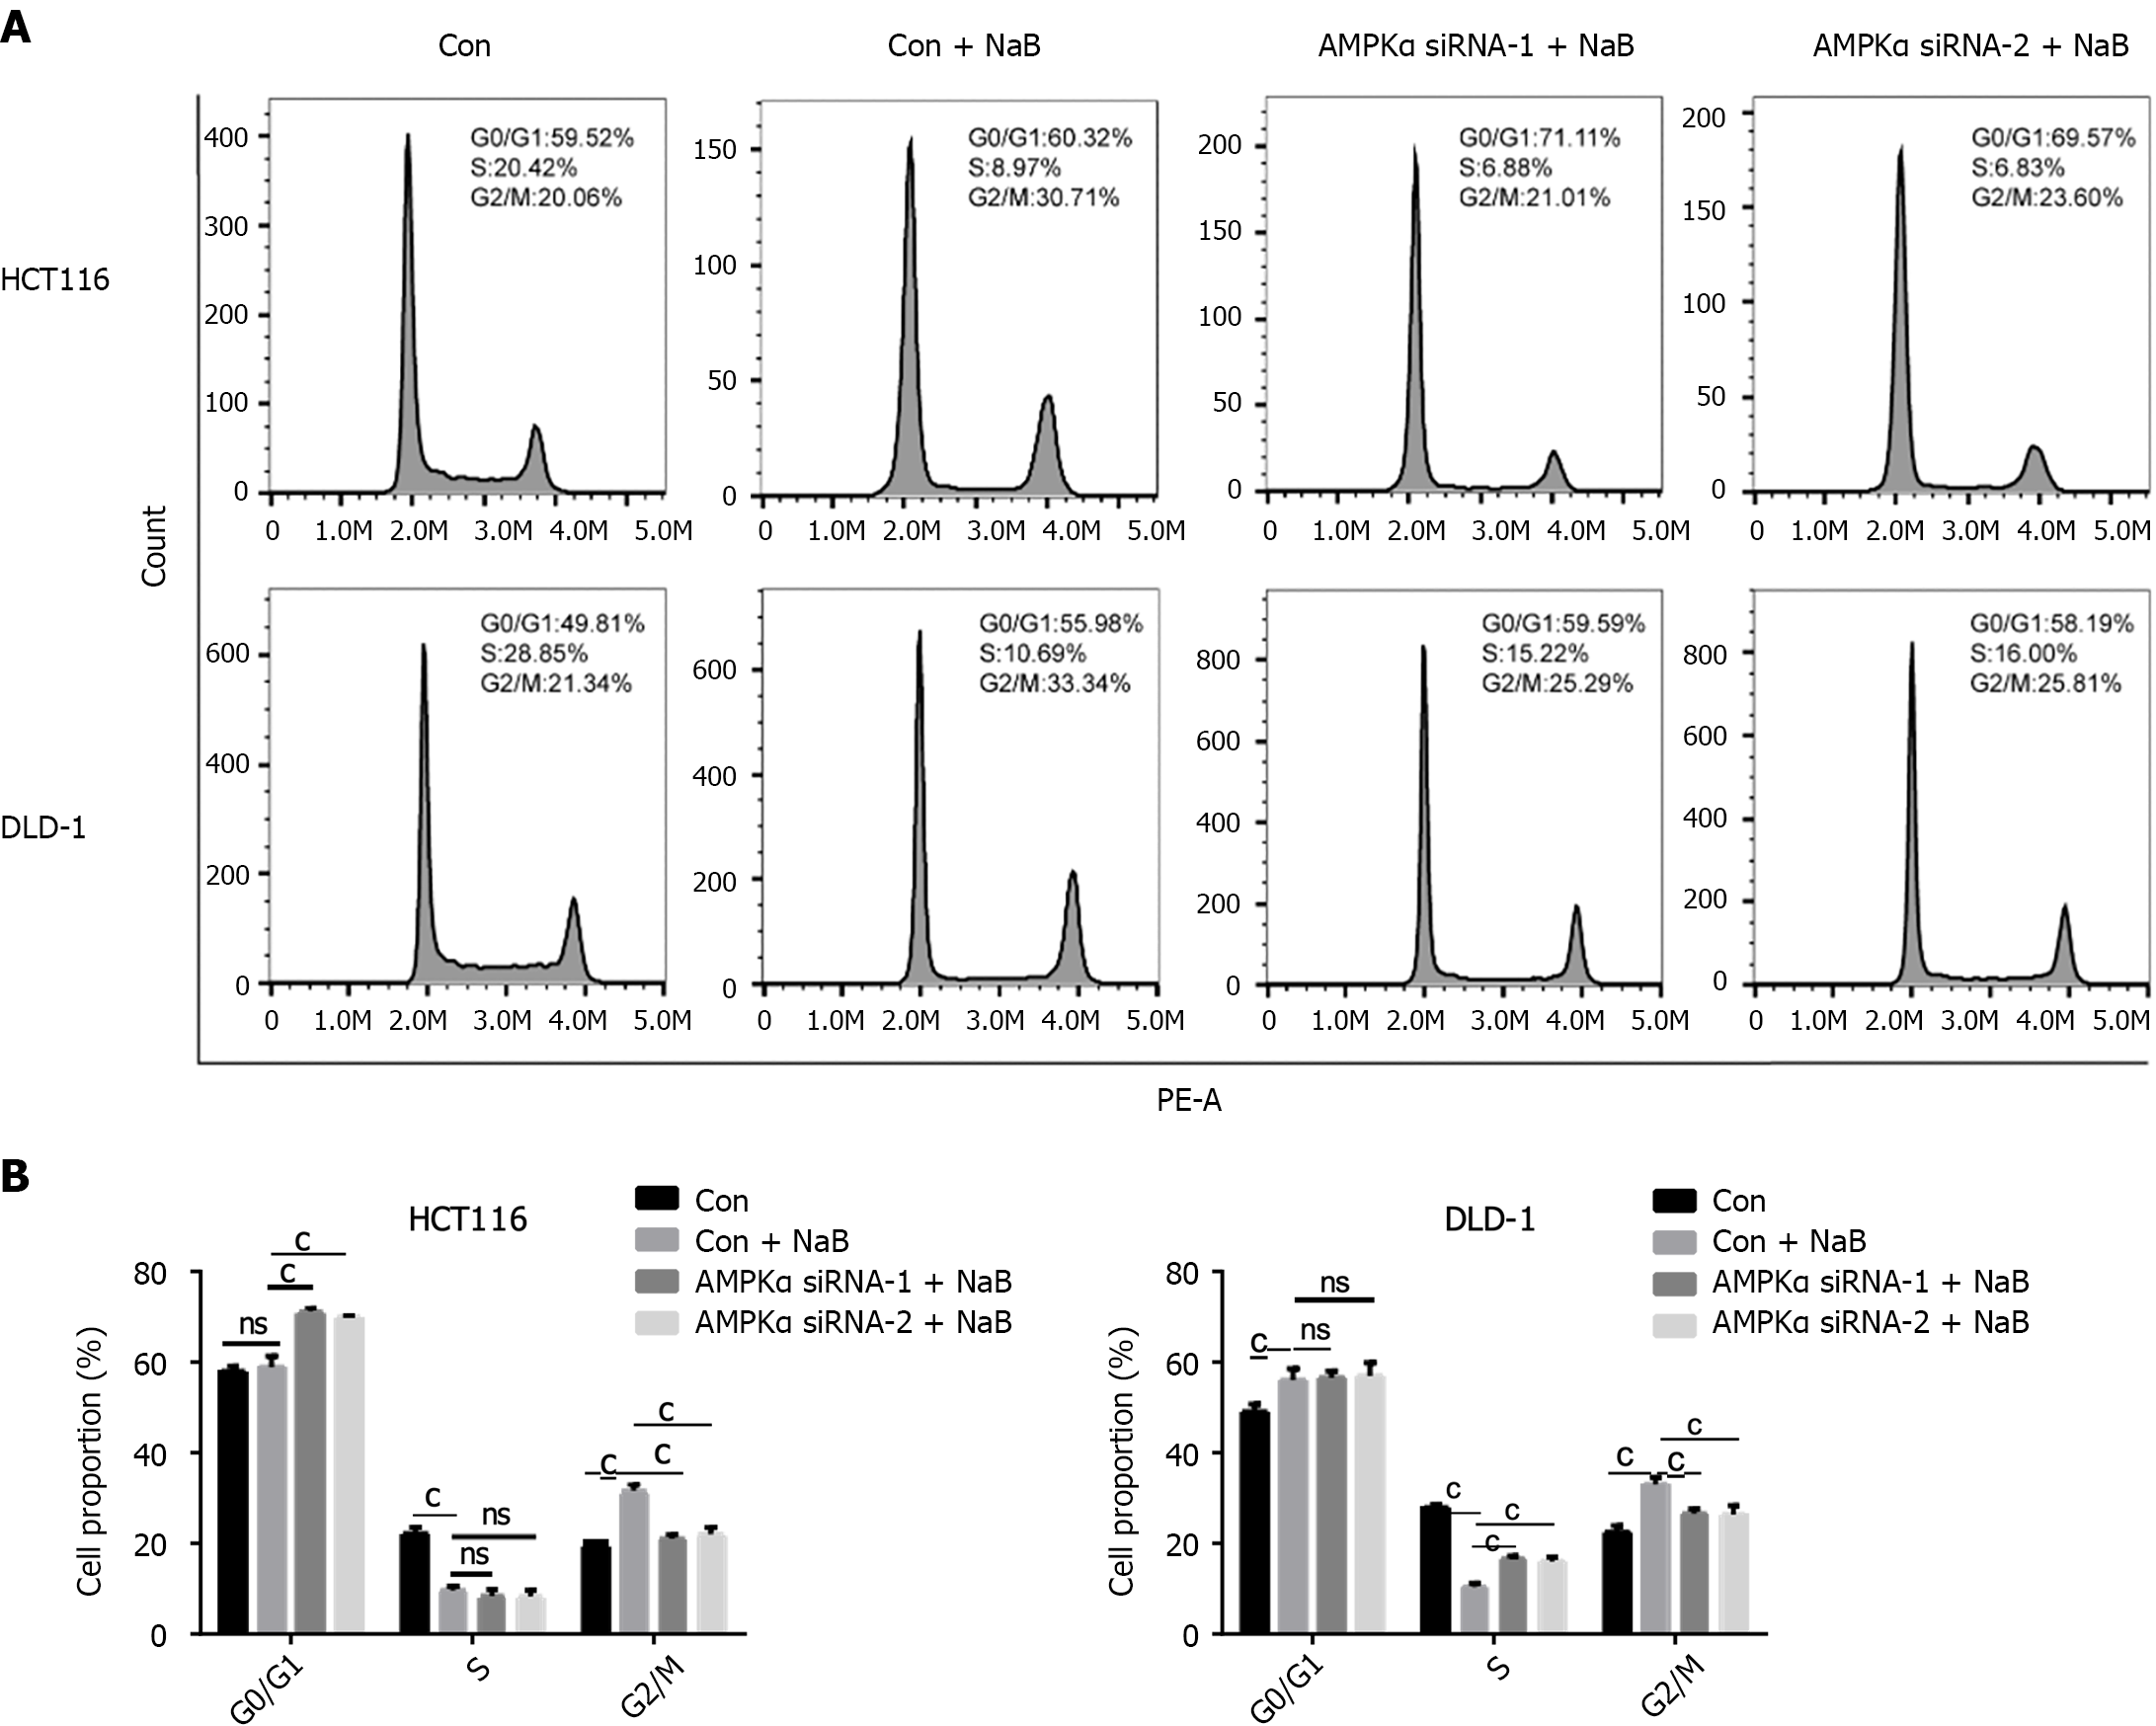
Figure 11 Adenosine monophosphate-activated protein kinase-specific small interfering RNA prevented cycle arrest caused by sodium butyrate.
A and B: Sodium butyrate (NaB) arrested the cell cycle of DLD-1 and HCT116 cells in the G2/M phase, while adenosine monophosphate-activated protein kinase small interfering RNA (siRNA) transfection inhibited this phenomenon. ns: P > 0.05, cP < 0.001. p-AMPK: Phosphorylated adenosine monophosphate-activated protein kinase.
- Citation: Wu QL, Fang XT, Wan XX, Ding QY, Zhang YJ, Ji L, Lou YL, Li X. Fusobacterium nucleatum-induced imbalance in microbiome-derived butyric acid levels promotes the occurrence and development of colorectal cancer. World J Gastroenterol 2024; 30(14): 2018-2037
- URL: https://www.wjgnet.com/1007-9327/full/v30/i14/2018.htm
- DOI: https://dx.doi.org/10.3748/wjg.v30.i14.2018


