Copyright
©The Author(s) 2024.
World J Gastroenterol. Mar 28, 2024; 30(12): 1764-1776
Published online Mar 28, 2024. doi: 10.3748/wjg.v30.i12.1764
Published online Mar 28, 2024. doi: 10.3748/wjg.v30.i12.1764
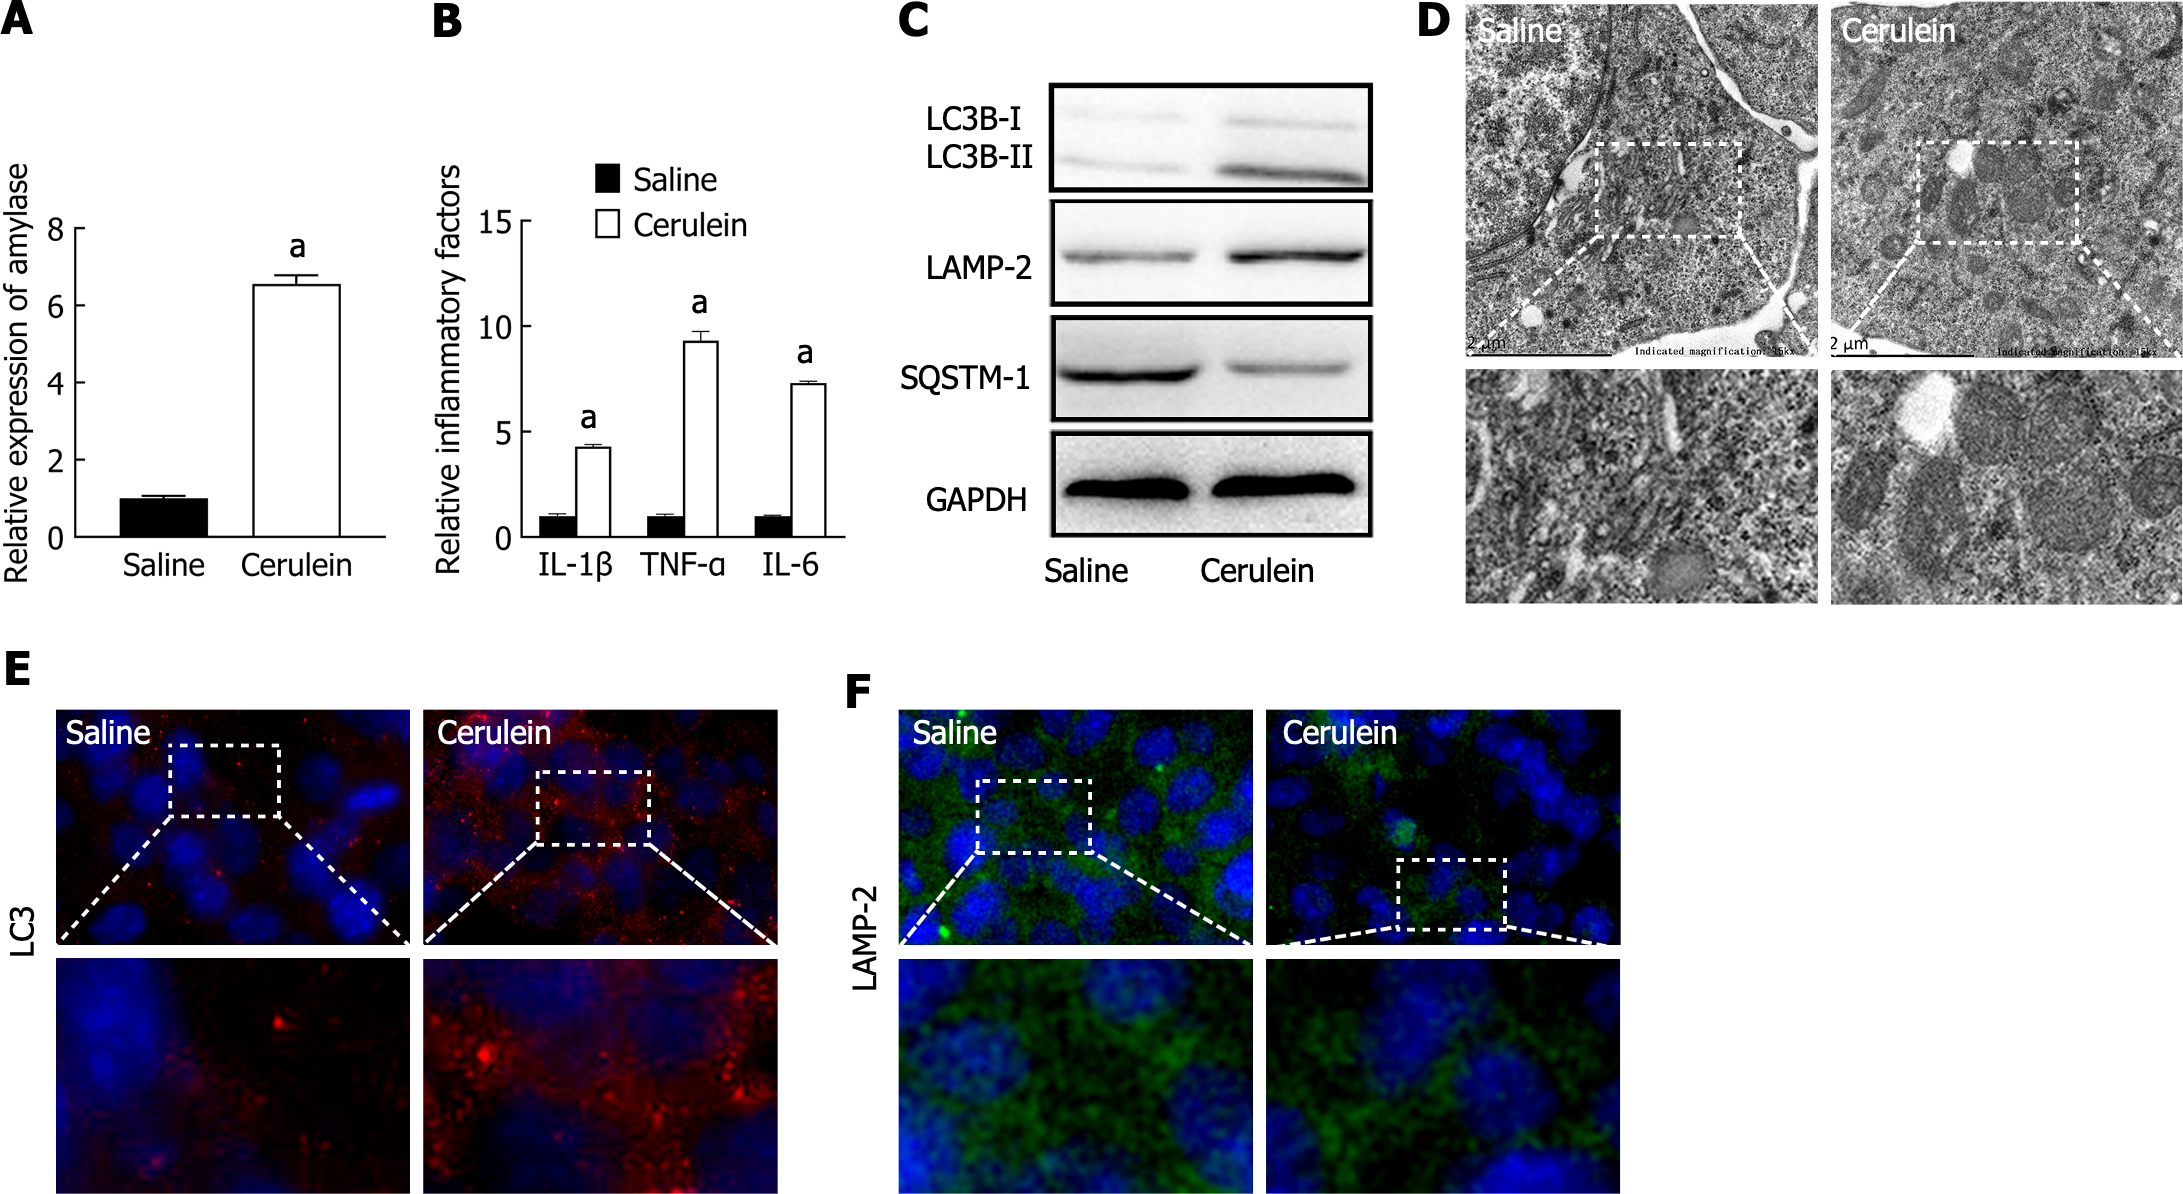
Figure 1 Impaired autophagy in a mouse acute pancreatitis cell model.
A: The levels of amylase in the supernatant were detected by ELISA; B: The levels of inflammatory factors in the supernatant were detected by ELISA; C: The expression of autophagy-related proteins was detected by western blot; D: The microstructure of intracellular autophagy was observed by transmission electron microscopy; E: The expression of LC3 was detected by immunofluorescence (magnification × 800); F: The expression of LAMP-2 was detected by immunofluorescence (magnification × 800). aP < 0.05 vs saline group. TNF: Tumor necrosis factor; IL: Interleukin.
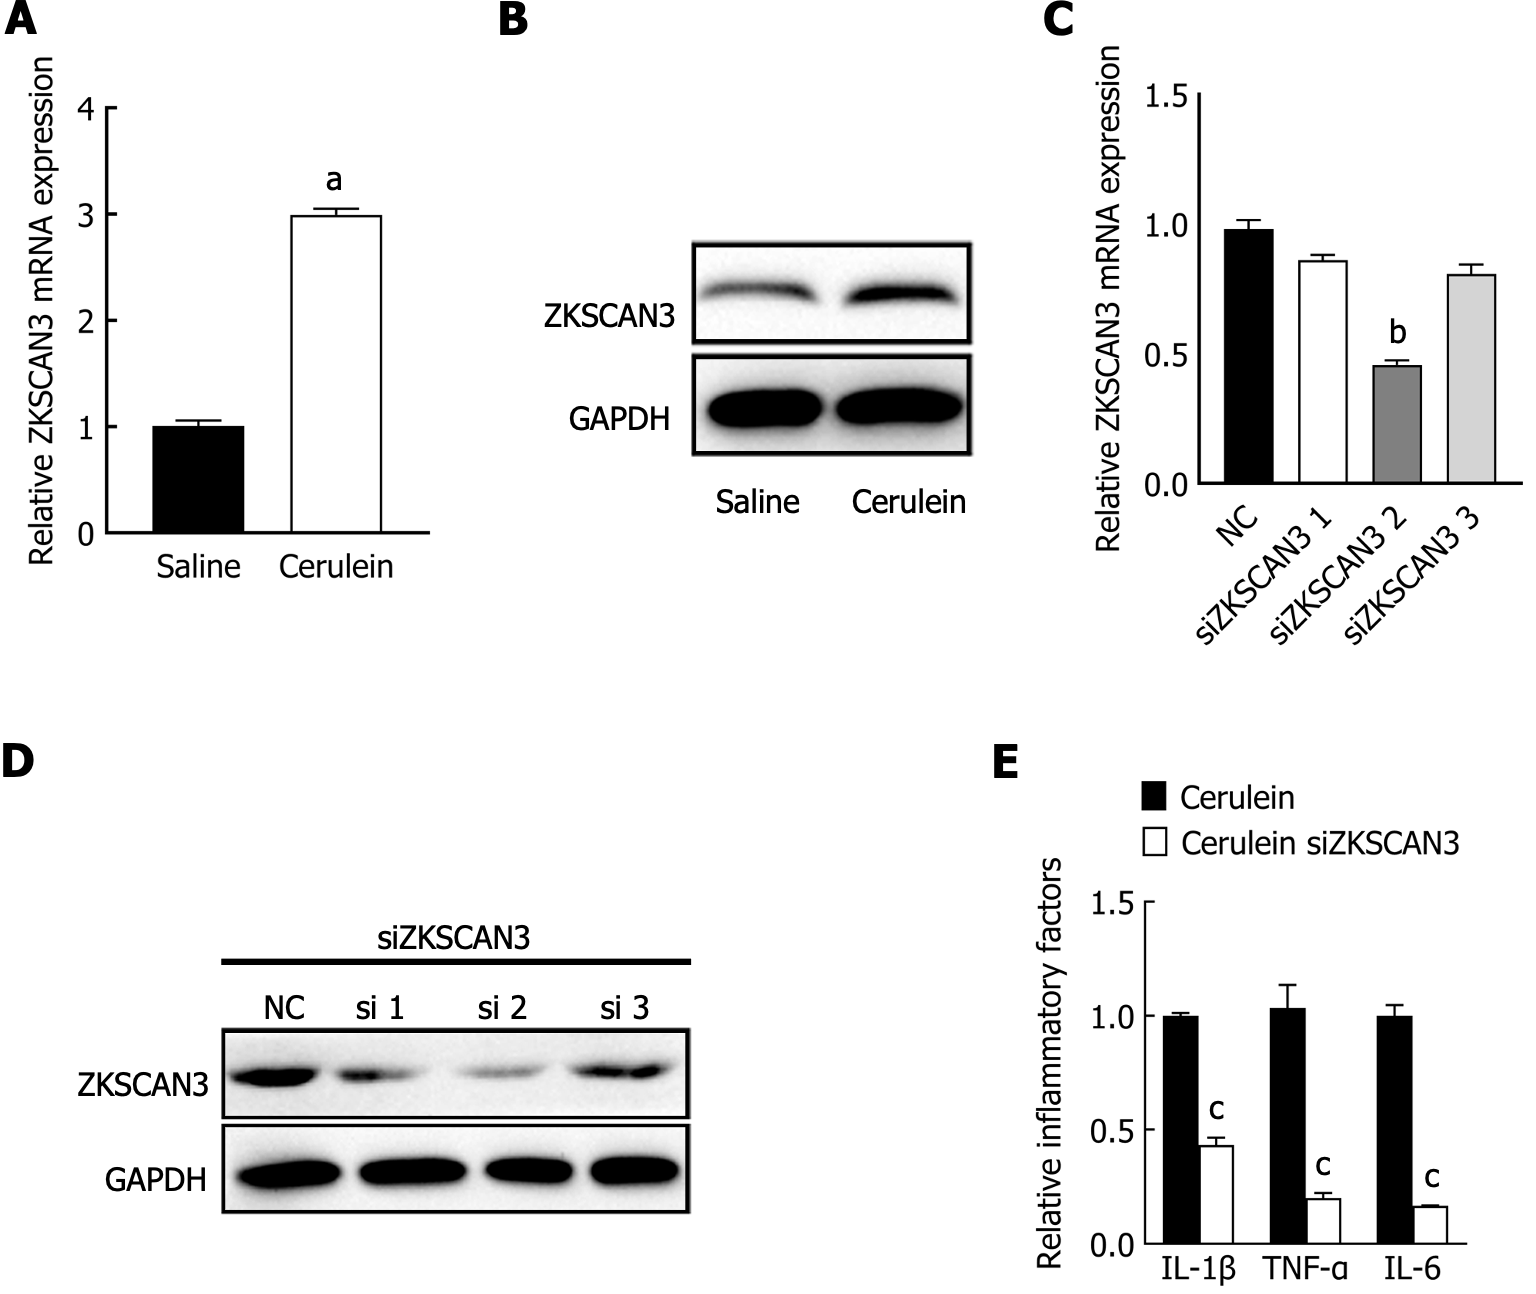
Figure 2 The expression and function of ZKSCAN3 in acute pancreatitis.
A: The expression of ZKSCAN3 mRNA was detected by qPCR; B: The expression level of ZKSCAN3 protein was detected by western blot; C: The expression level of ZKSCAN3 mRNA treated with three different siRNAs was detected by qPCR; D: The expression level of ZKSCAN3 protein in the MPC-83 cell line treated with three different siRNAs; E: After interfering with the expression of ZKSCAN3, the expression level of inflammatory factors in the mouse acute pancreatitis cell model was detected by ELISA. aP < 0.05 vs saline group; bP < 0.05 vs negative control group; cP < 0.05 vs cerulein group. NC: Negative control. TNF: Tumor necrosis factor; IL: Interleukin.
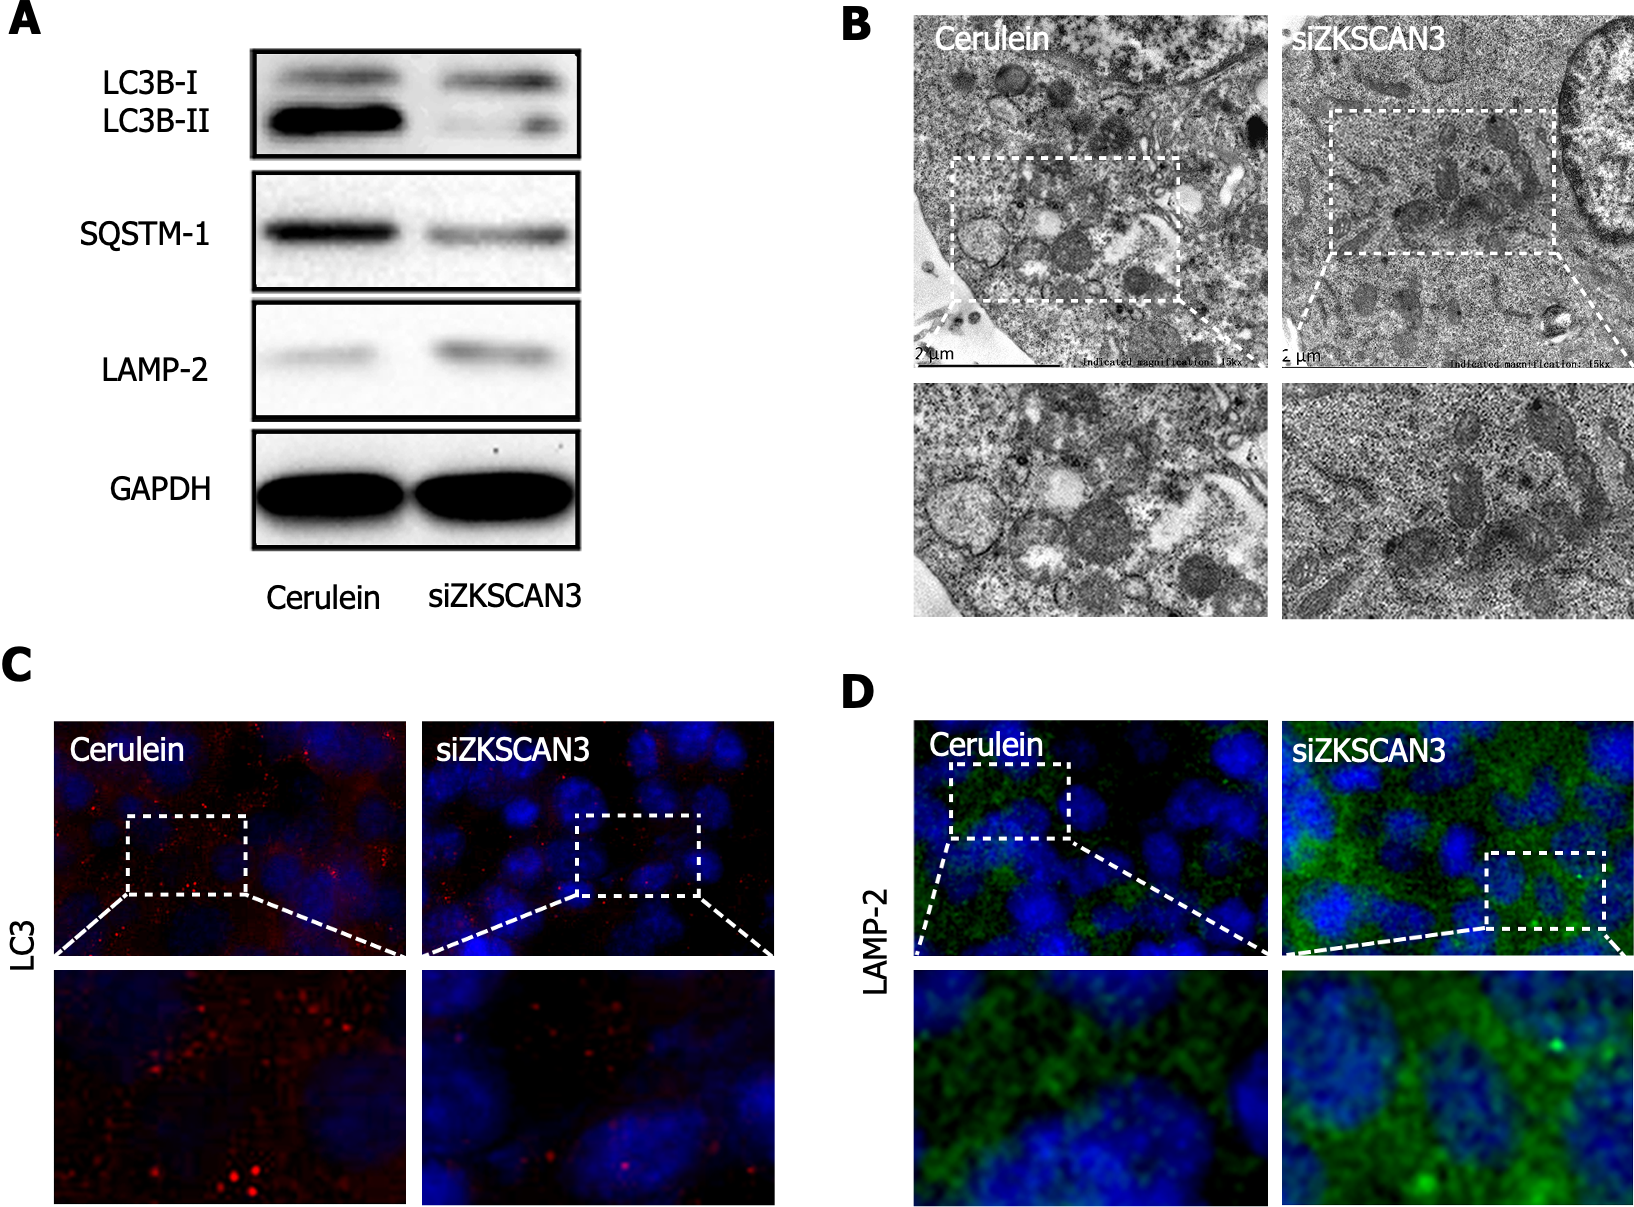
Figure 3 ZKSCAN3 inhibits autophagic flux in acute pancreatitis.
A: The expression of autophagy related proteins in the negative control group and knockdown group was detected by western blot; B: The extent of autophagy was observed by transmission electron microscopy; C: The expression of LC3 was detected by immunofluorescence (magnification × 800); D: The expression of LAMP-2 was detected by immunofluorescence (magnification × 800).
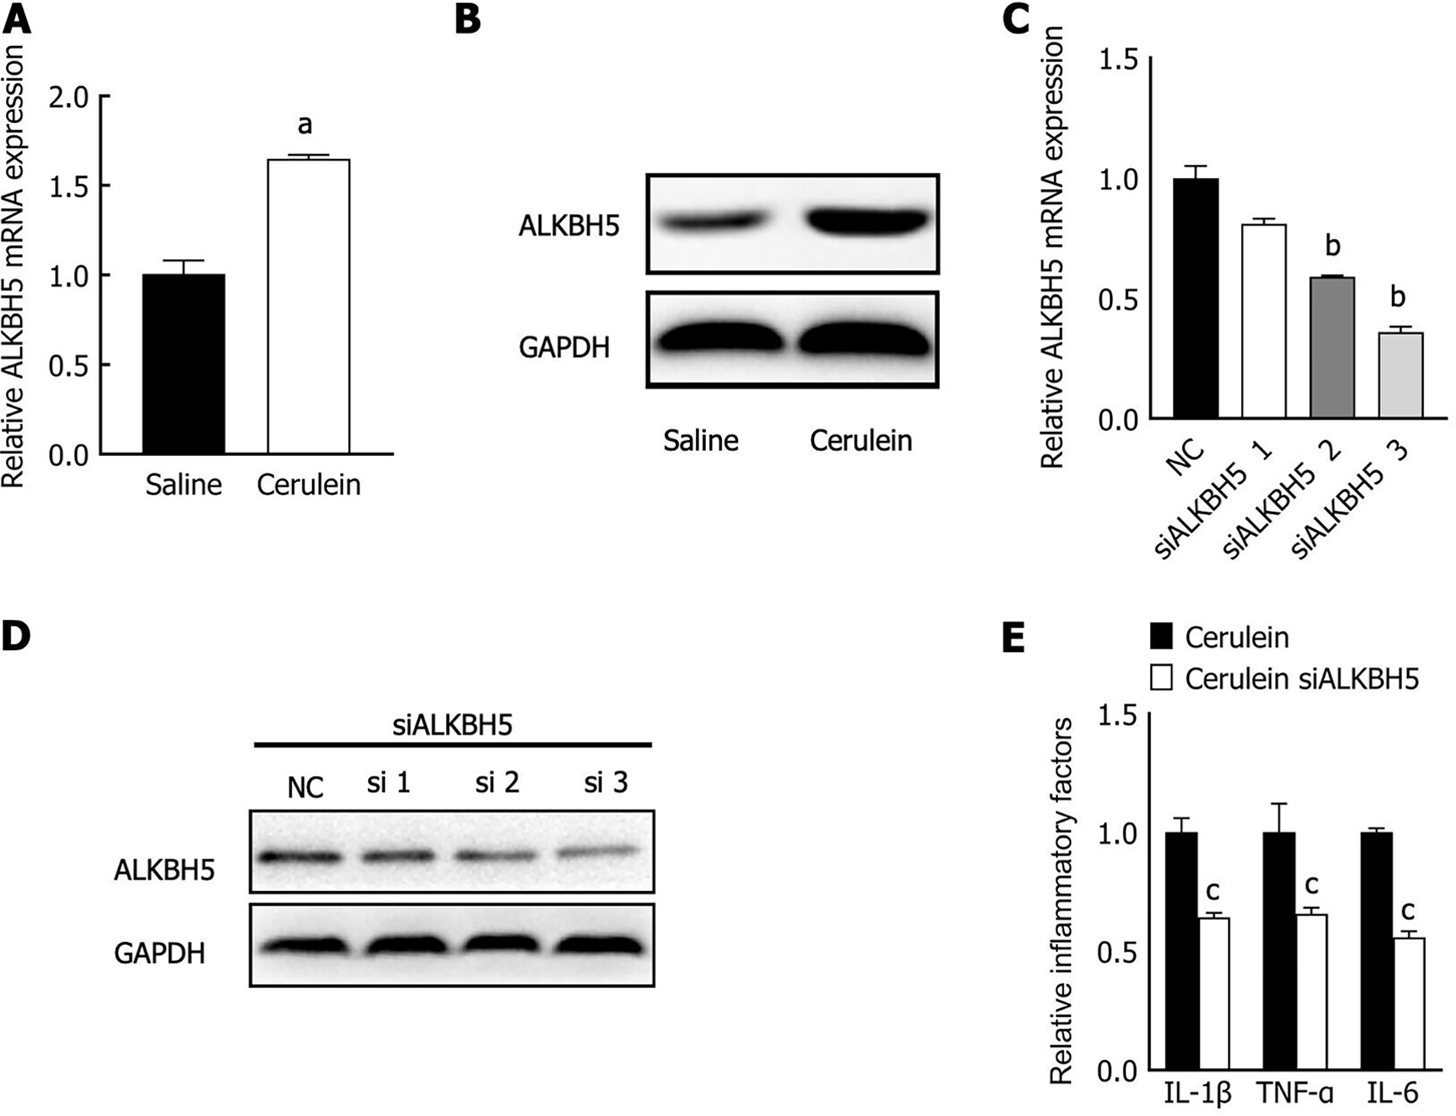
Figure 4 The expression and function of ALKBH5 in acute pancreatitis.
A: qPCR was used to detect ALKBH5 mRNA expression in acute pancreatitis (AP) group and control group; B: The expression level of the ALKBH5 protein in AP group and control group was detected by western blot; C: qPCR was used to detect ALKBH5 mRNA expression in the MPC-83 cell line treated with different siRNAs; D: western blot was used to detect ALKBH5 protein expression in MPC-83 cell line treated with three different siRNA; E: After interfering with the expression of ALKBH5, the expression level of inflammatory factors in the mouse AP cell line was detected by ELISA. aP < 0.05 vs saline group; bP < 0.05 vs negative control group; cP < 0.05 vs cerulein group. NC: Negative control; TNF: Tumor necrosis factor; IL: Interleukin.
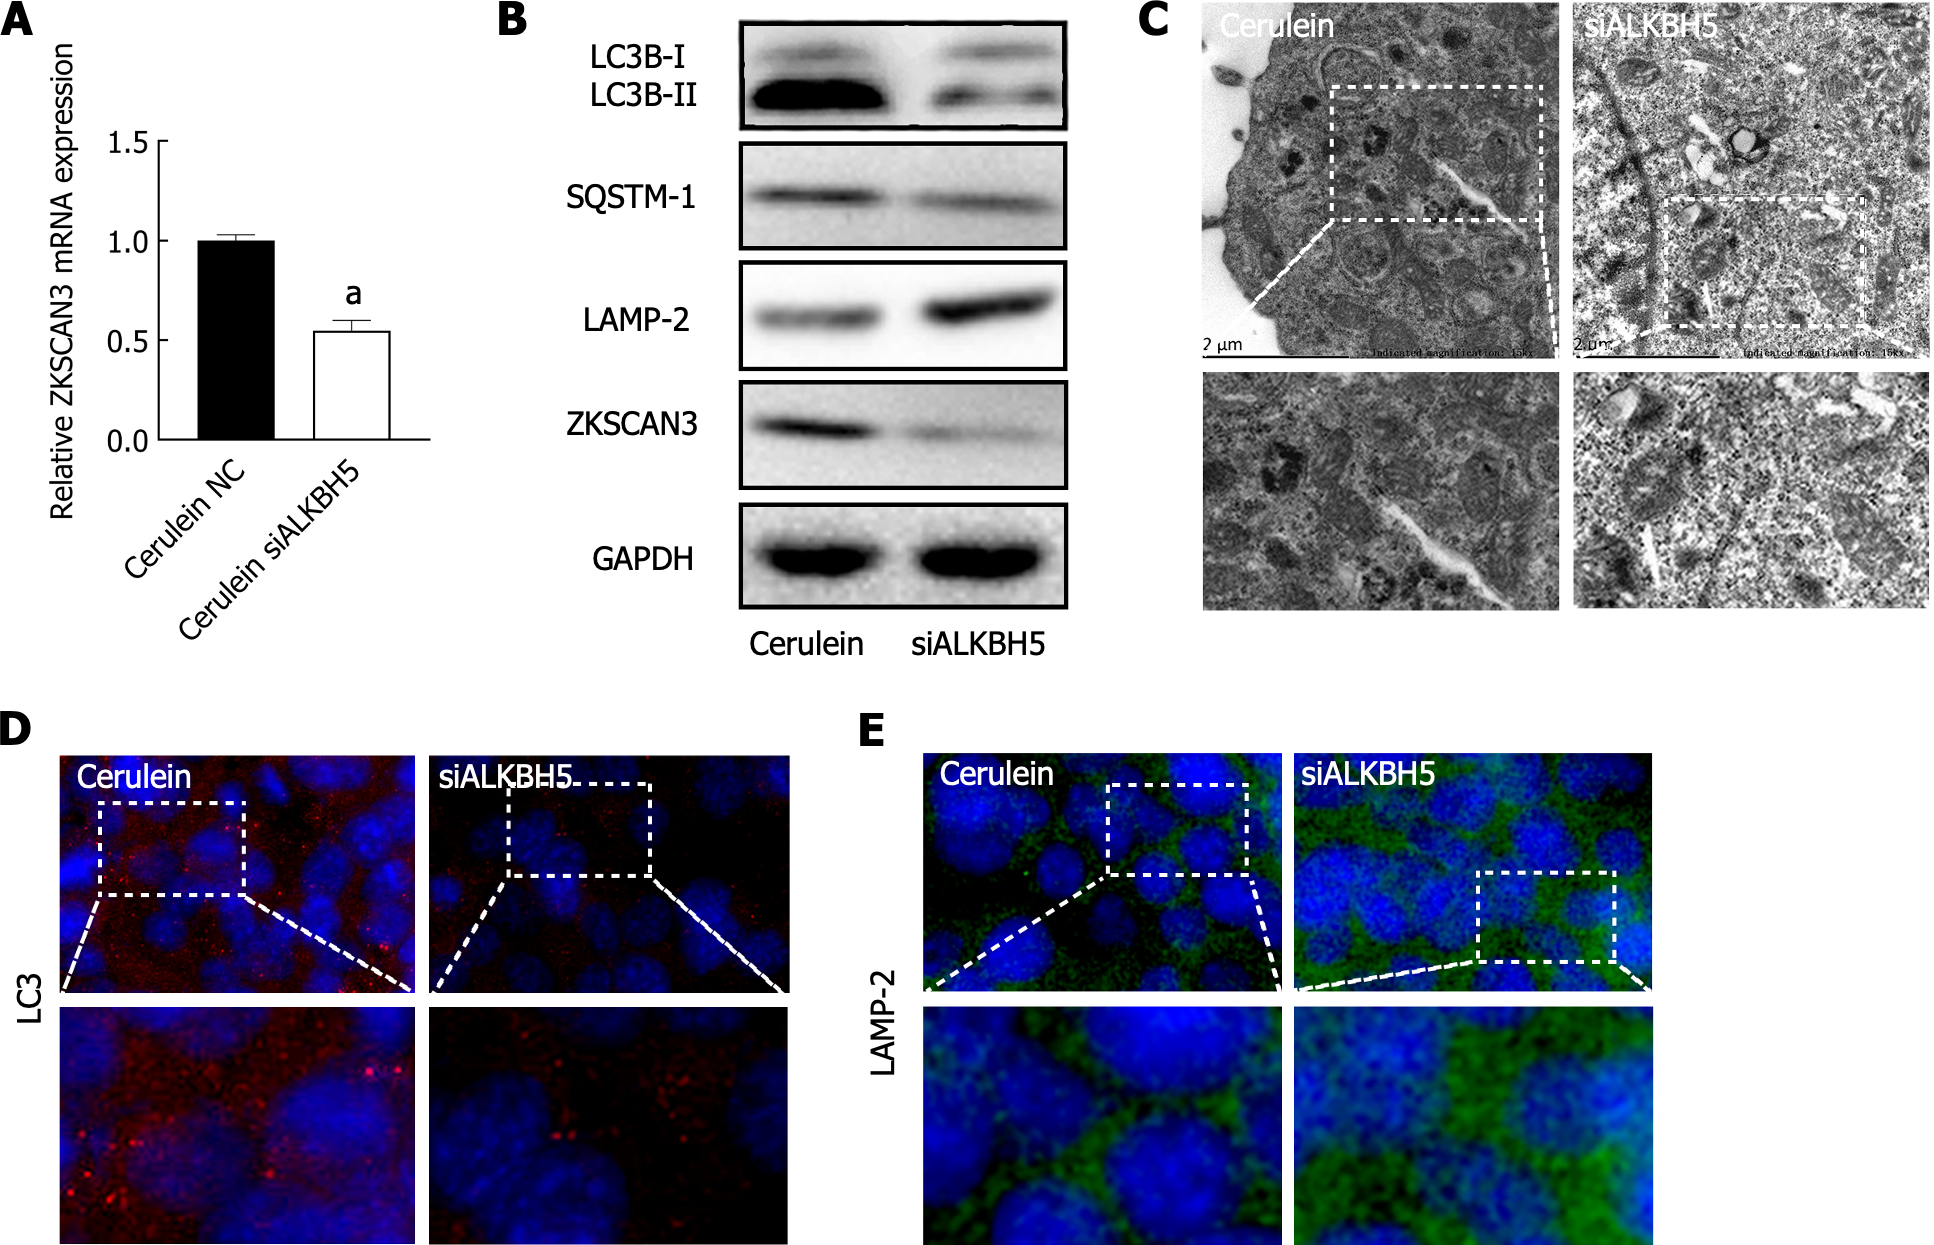
Figure 5 ALKBH5 promoted the expression of ZKSCAN3 and inhibited autophagic flux.
A: After interfering with ALKBH5 expression, the expression level of ZKSCAN3 mRNA was detected by qPCR; B: The expression levels of ZKSCAN3 protein and autophagy related proteins were detected by western blot; C: Autophagic microstructure was observed by transmission electron microscopy; D: LC3 was detected by immunofluorescence (magnification × 800); E: LAMP-2 was detected by immunofluorescence (magnification × 800). aP < 0.05 vs negative cerulein group. NC: Negative control.
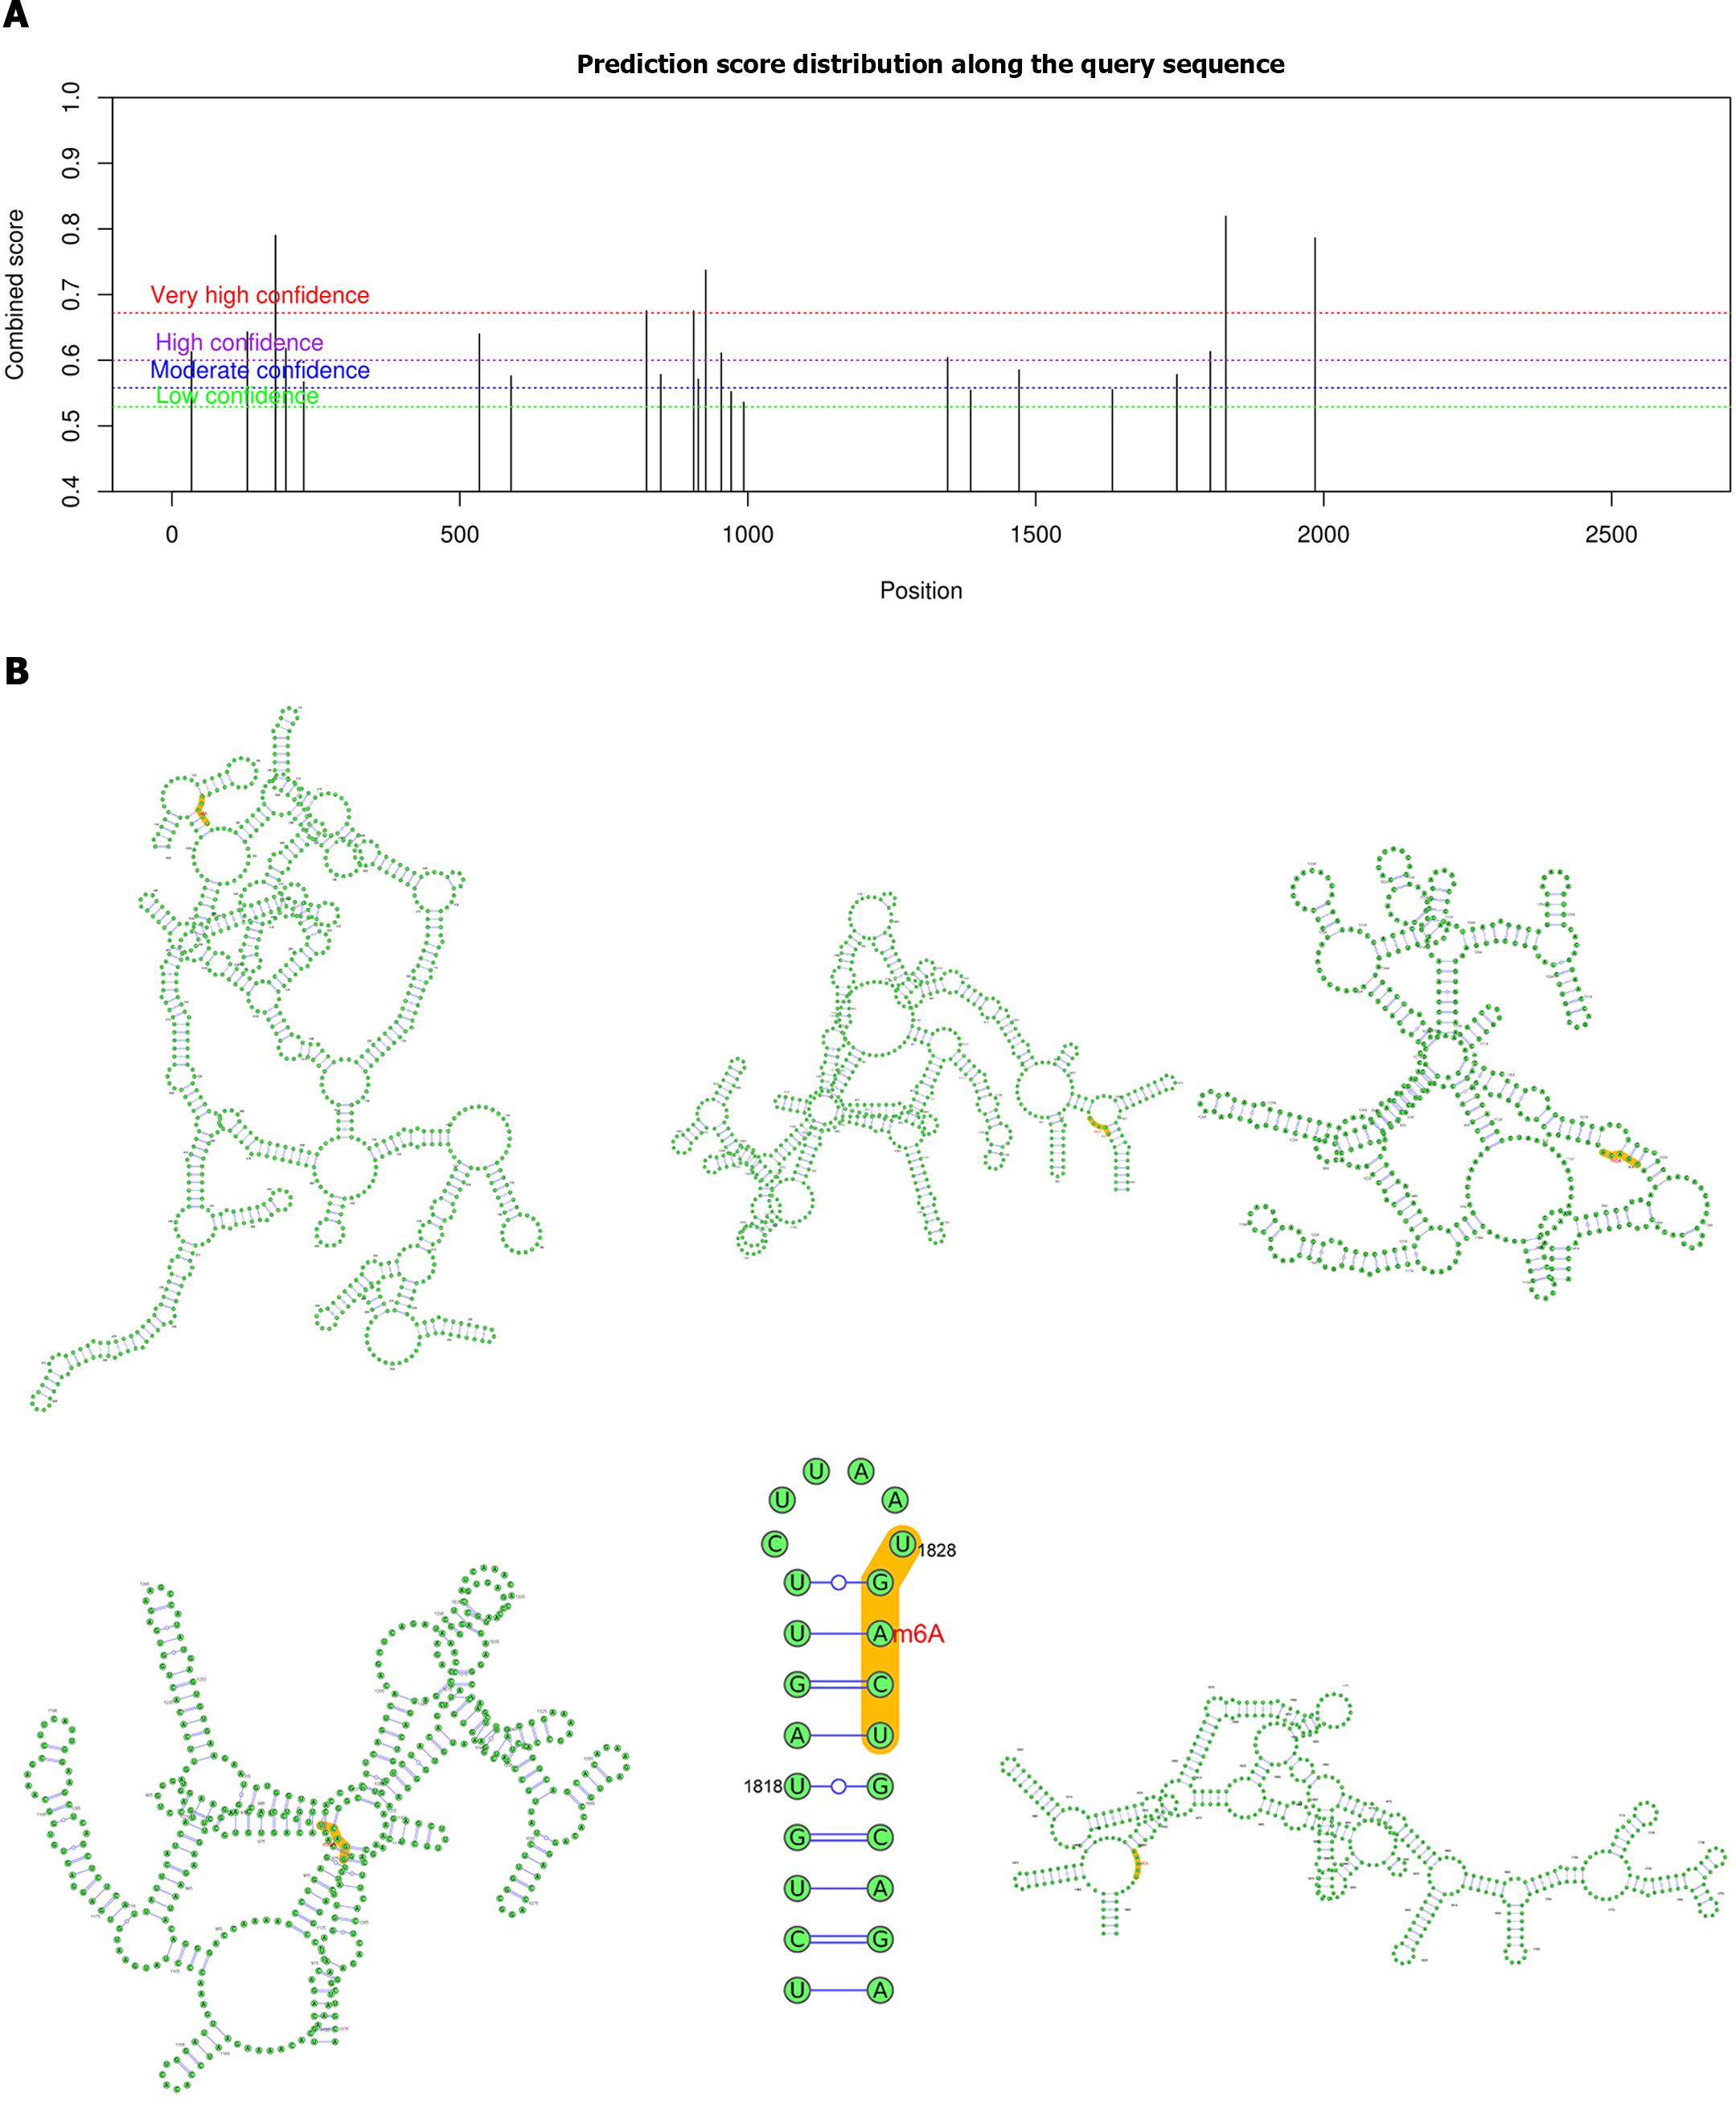
Figure 6 Prediction of m6A binding sites in ZKSCAN3.
A: Potential m6A binding sites on ZKSCAN3 mRNA were analyzed via a website (http://www.cuilab.cn/sramp/); B: Diagram of the secondary structure of highly credible m6A binding sites. m6A: N6-methyladenosine.
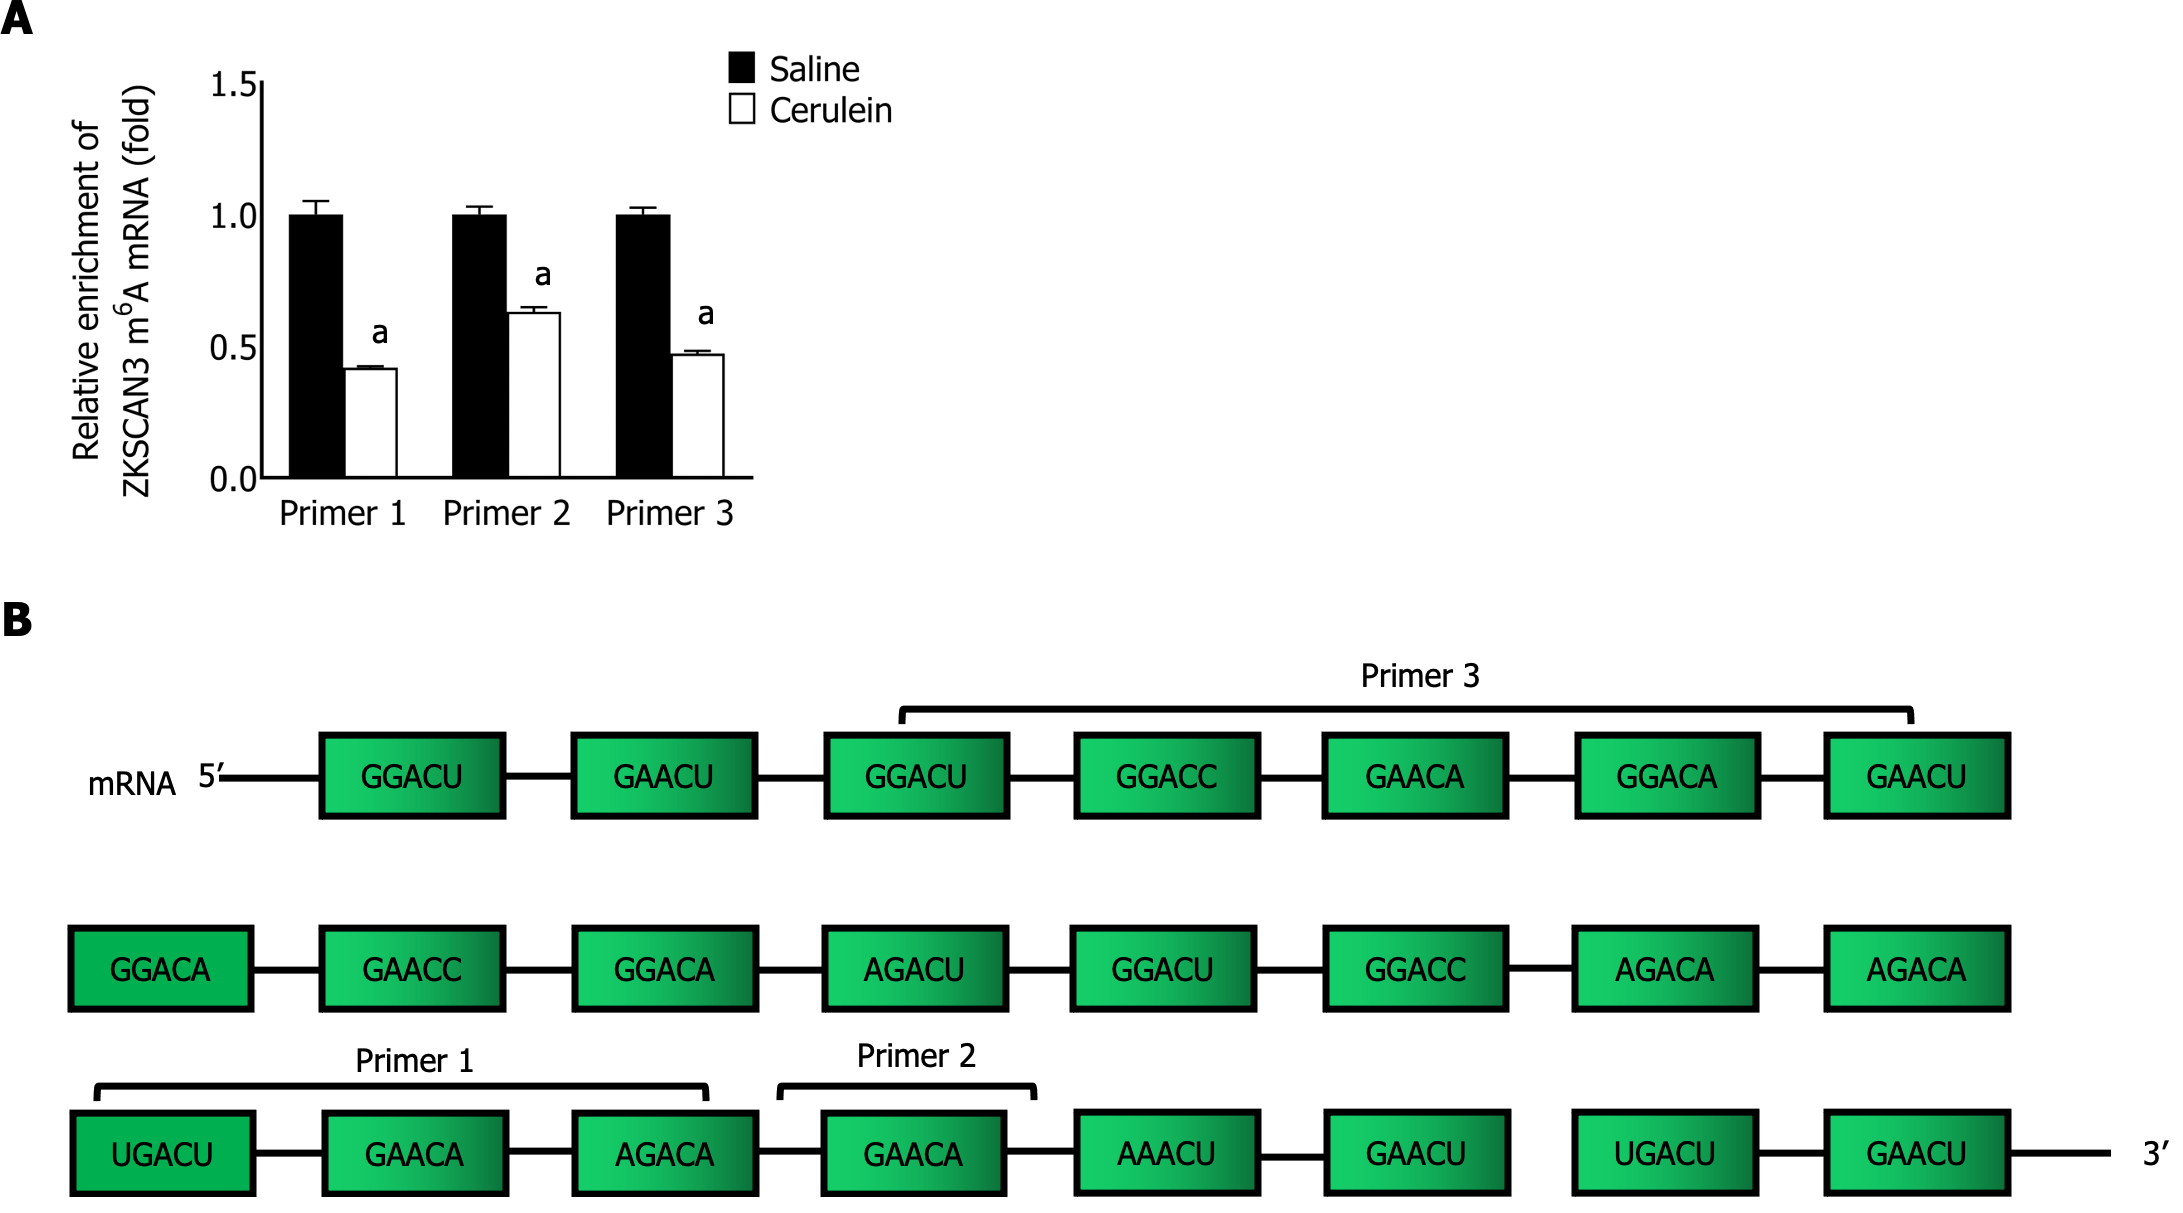
Figure 7 Enrichment levels of m6A modifications on ZKSCAN3 mRNA.
A: qPCR was used to detect the m6A modification level of ZKSCAN3 mRNA; B: Schematic diagram of the sequences of primers used for ZKSCAN3 mRNA. aP < 0.05 vs saline group.
- Citation: Zhang T, Zhu S, Huang GW. ALKBH5 suppresses autophagic flux via N6-methyladenosine demethylation of ZKSCAN3 mRNA in acute pancreatitis. World J Gastroenterol 2024; 30(12): 1764-1776
- URL: https://www.wjgnet.com/1007-9327/full/v30/i12/1764.htm
- DOI: https://dx.doi.org/10.3748/wjg.v30.i12.1764


