Copyright
©The Author(s) 2024.
World J Gastroenterol. Mar 28, 2024; 30(12): 1751-1763
Published online Mar 28, 2024. doi: 10.3748/wjg.v30.i12.1751
Published online Mar 28, 2024. doi: 10.3748/wjg.v30.i12.1751
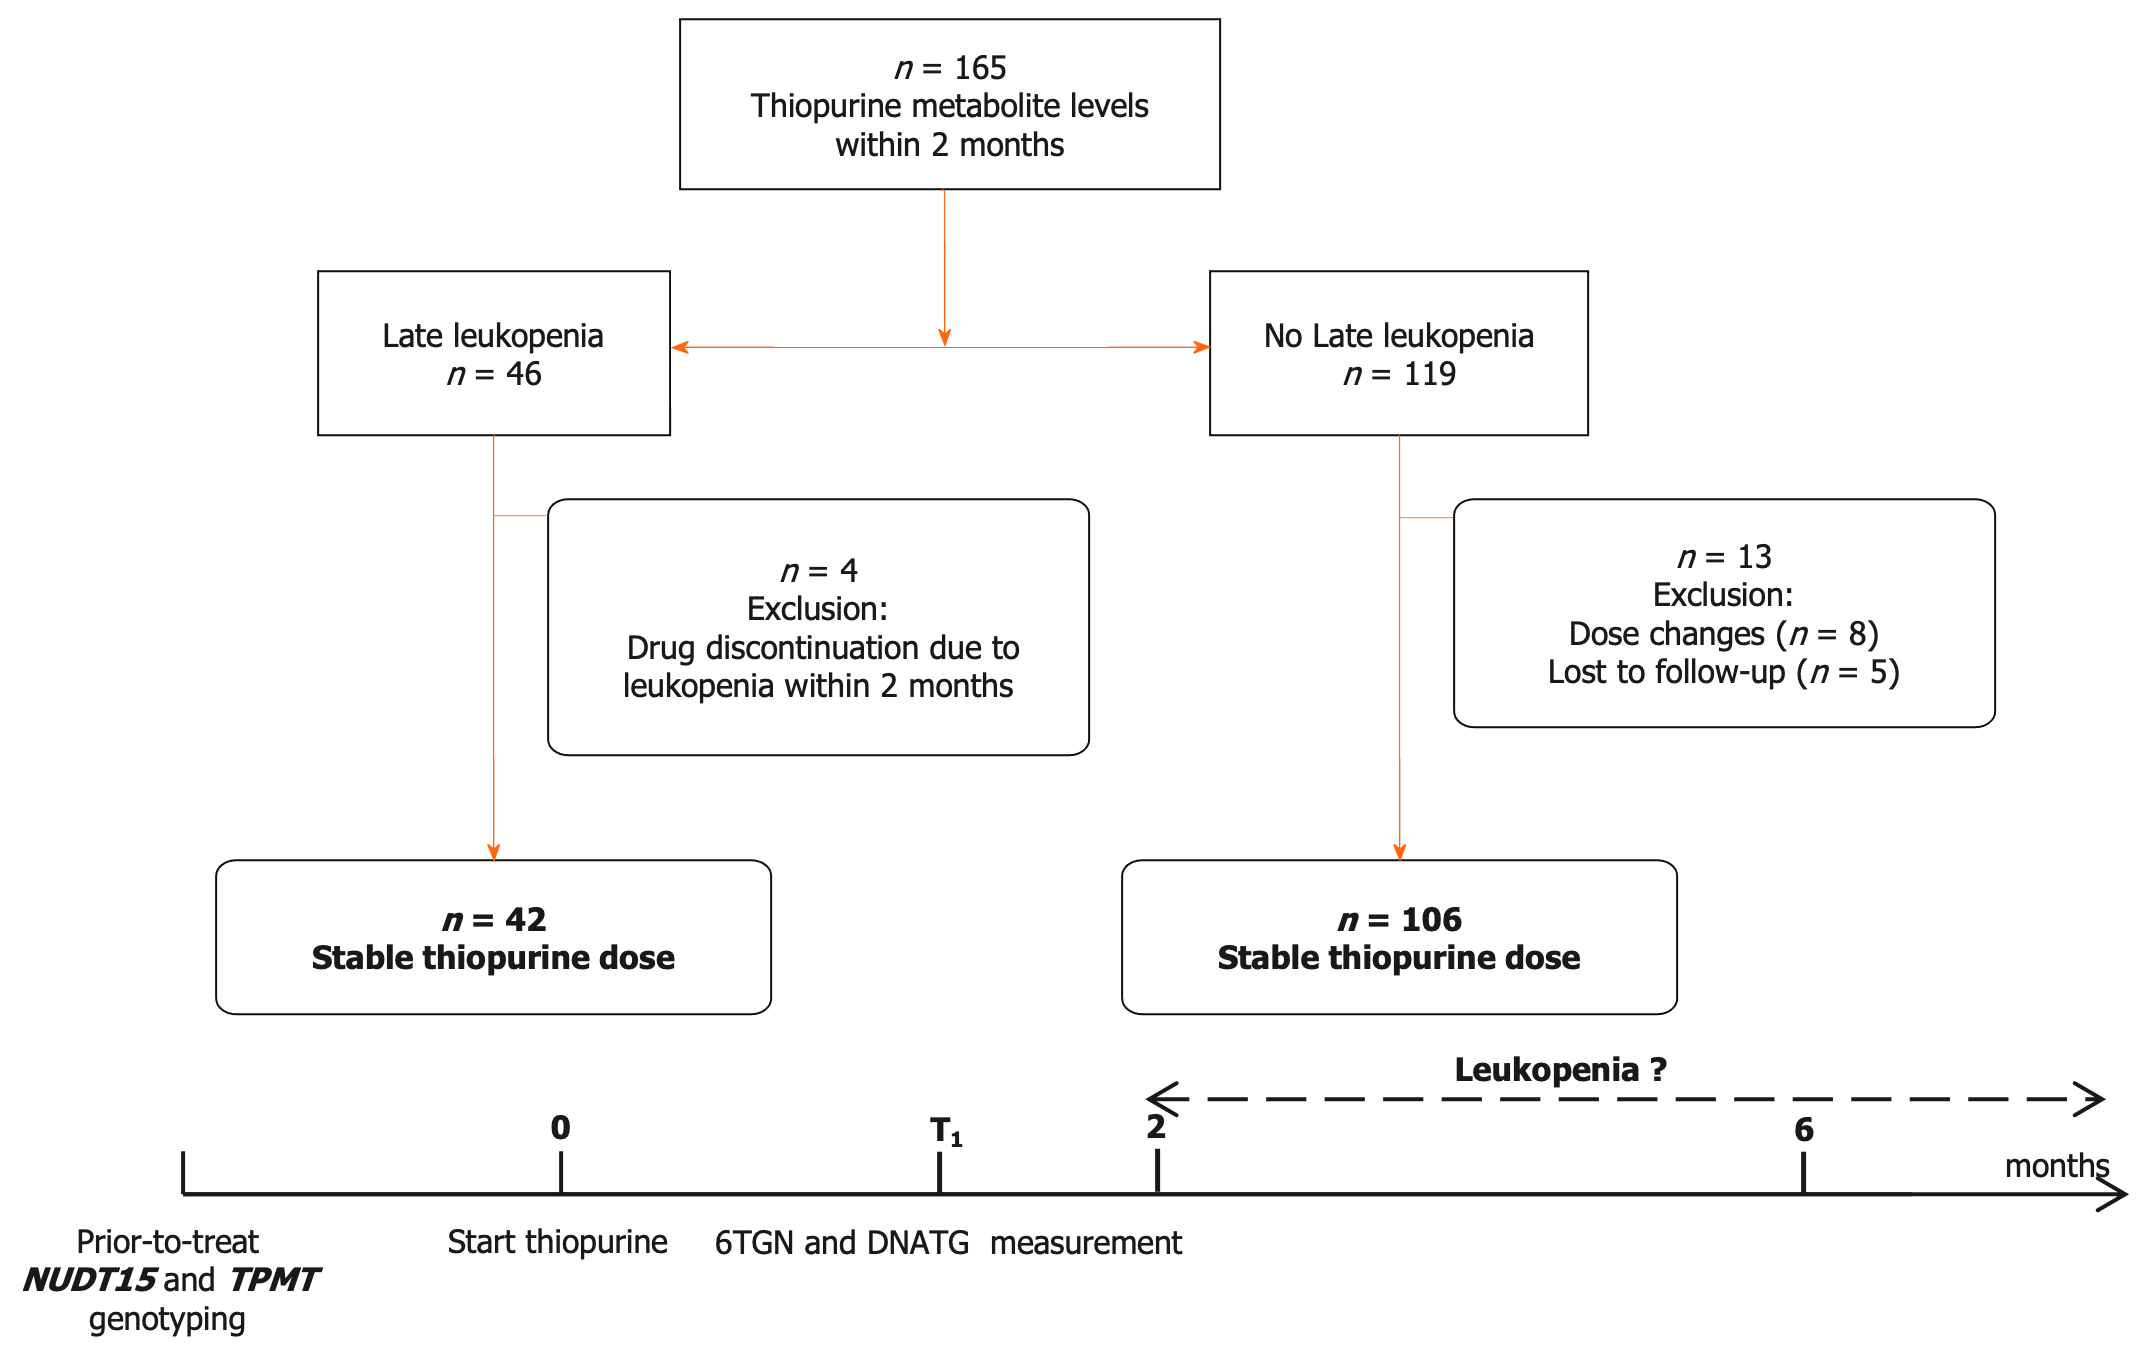
Figure 1 Flow chart of patient enrolment, exclusion, and follow-up.
Late leucopenia was defined as a leukocyte count < 3.5 × 10⁹/L over two months. The stable dose (2.0 mg/kg/d azathioprine and 1.0 mg/kg/d 6-mercaptopurine, approximately) is reached approximately one to two weeks after the initial administration. NUDT15: Nudix hydrolase 15; TPMT: Thiopurine methyltransferase; 6TGN: 6-thioguanine nucleotides; DNATG: DNA-thioguanine.
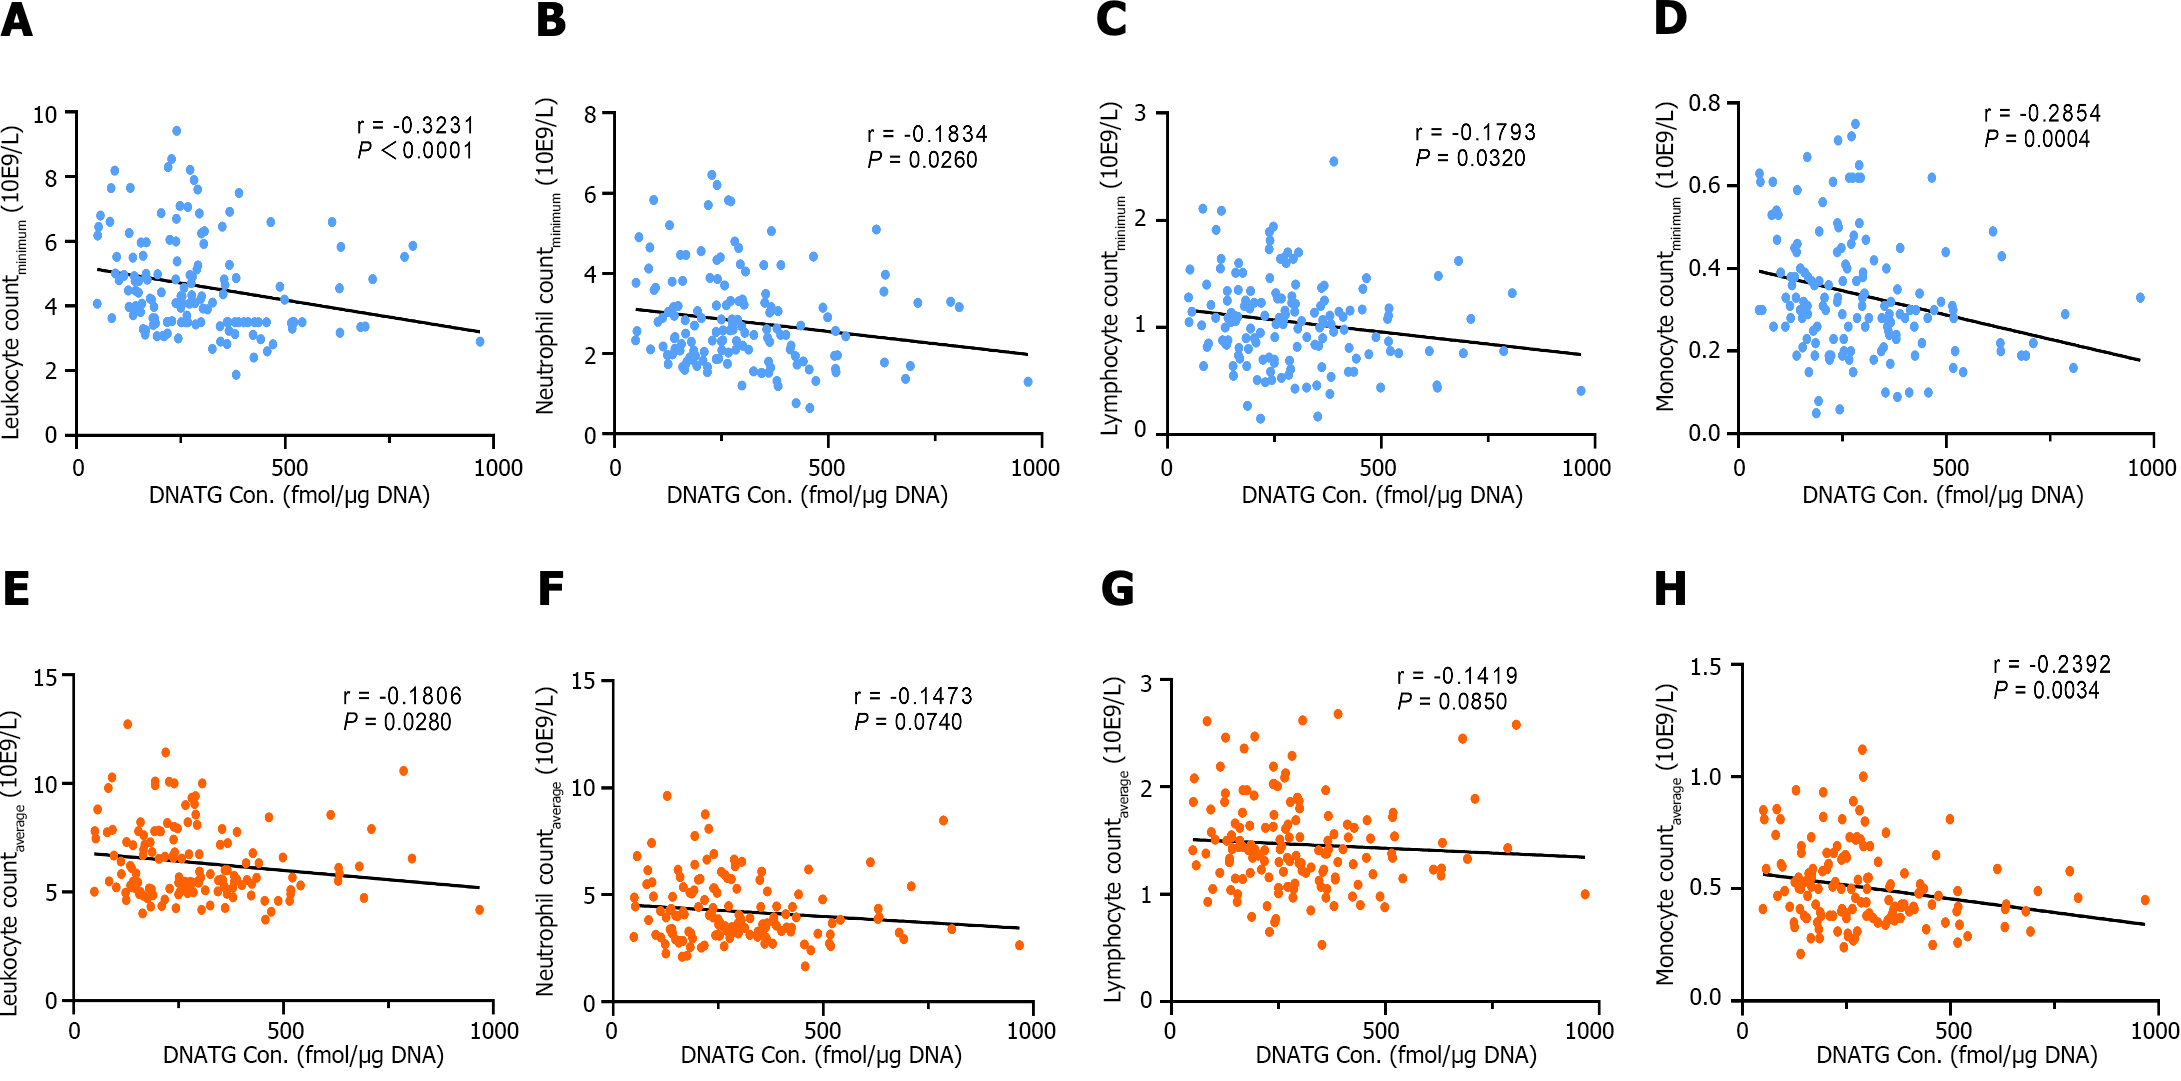
Figure 2 Correlation between early DNA-thioguanine concentration and peripheral leukocyte, neutrophil, lymphocyte, and monocyte counts.
A-D: There was a significant negative correlation between early DNA-thioguanine (DNATG) concentration, and the minimum peripheral leukocyte, neutrophil, lymphocyte, and monocyte counts during follow-up; E-H: A marginally significant negative correlation was found between early DNATG concentration and the average peripheral leukocyte, neutrophil, lymphocyte, and monocyte counts. P values were determined by the nonparametric Spearman test. DNATG: DNA-thioguanine.
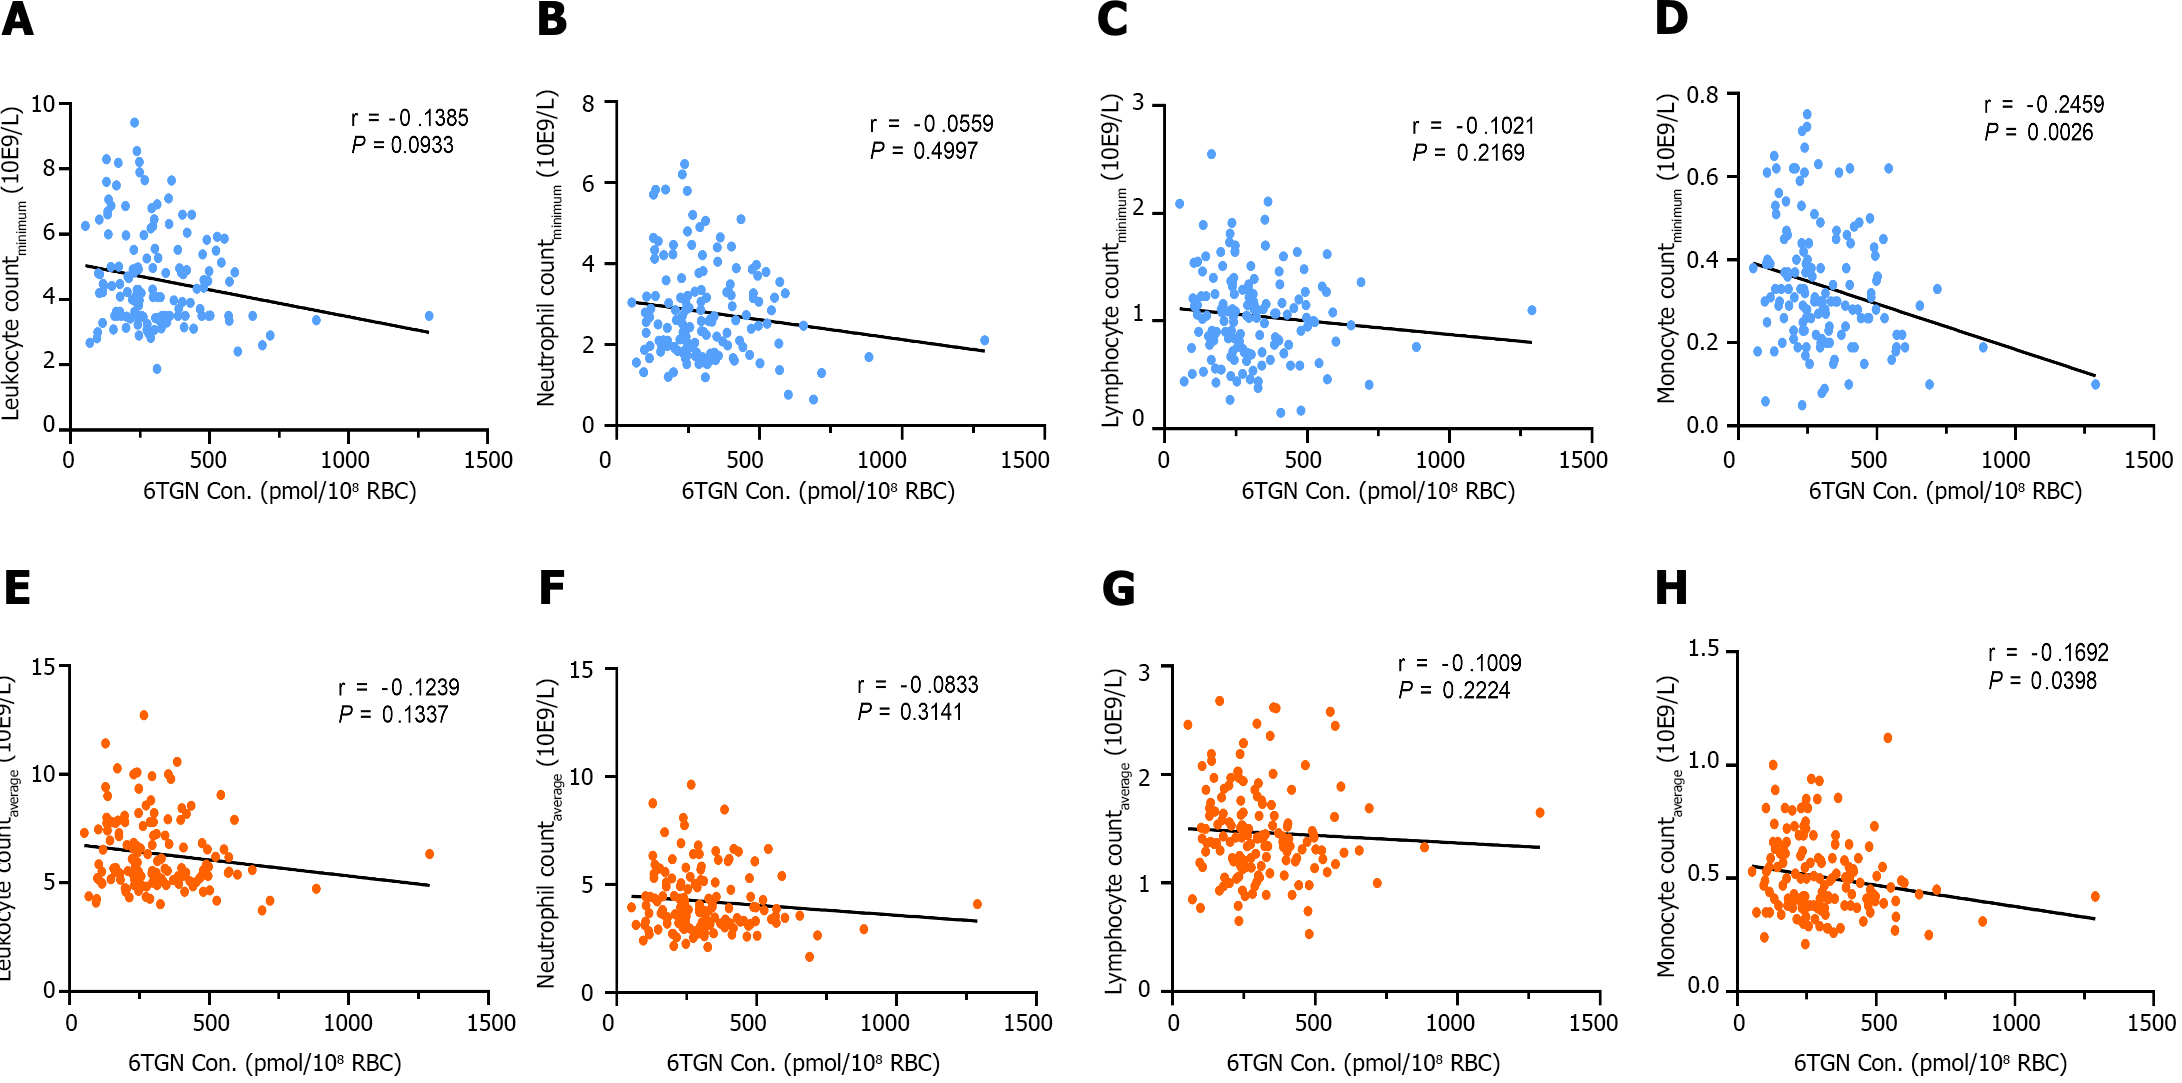
Figure 3 Correlation between early 6-thioguanine nucleotide concentration and peripheral leukocyte, neutrophil, lymphocyte, and monocyte counts.
A-H: There was no significant correlation between early 6-thioguanine nucleotides (6TGN) concentration, and the minimum or average peripheral leukocyte, neutrophil, and lymphocyte counts during follow-up (P > 0.05) (A-C, E-G). There was a correlation between early 6TGN concentration and the minimum or average peripheral monocyte counts (P < 0.05) (D and H). P values were determined by the nonparametric Spearman test. 6TGN: 6-thioguanine nucleotides; RBC: Red blood cell.
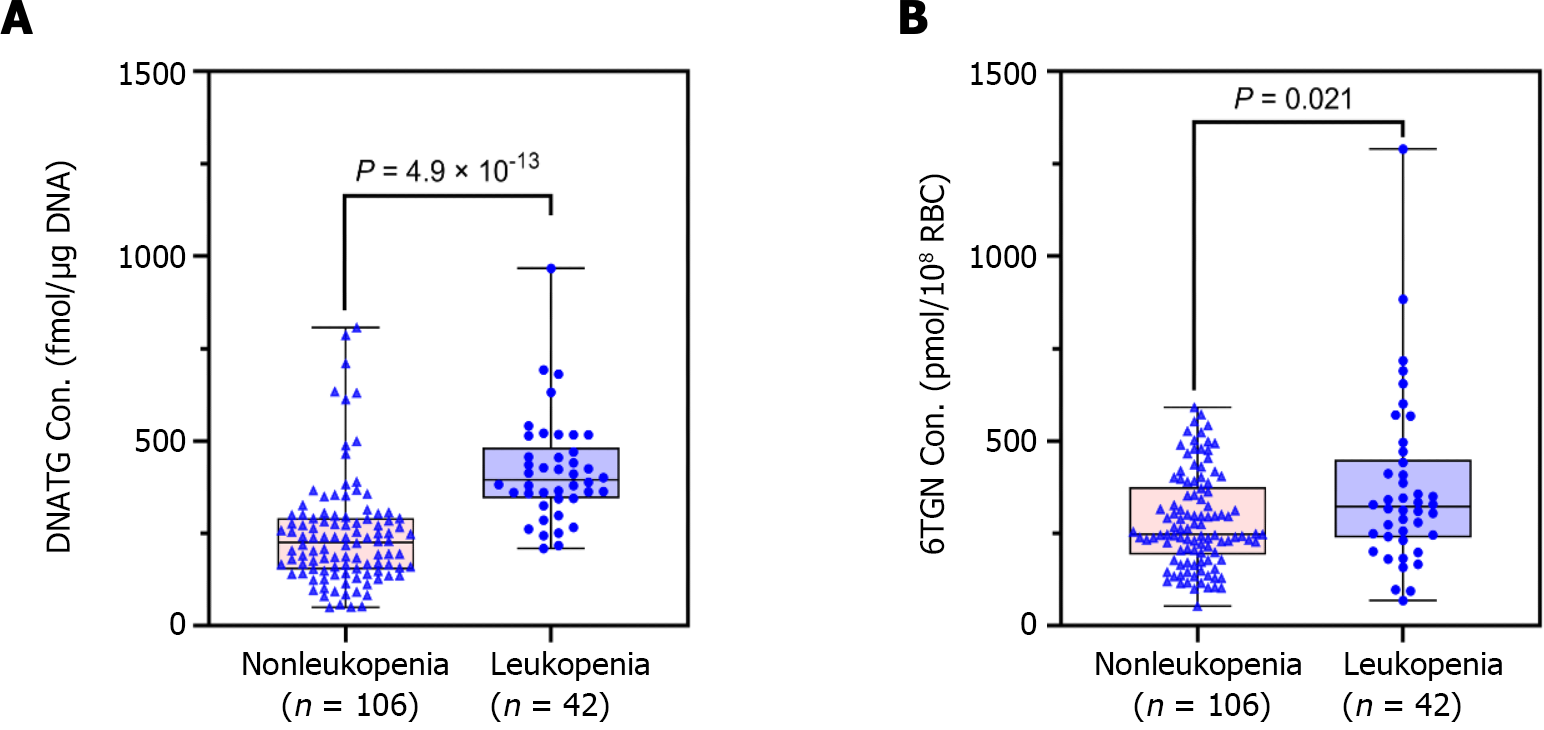
Figure 4 Early DNA-thioguanine concentration was associated with late leucopenia with immense significance compared to 6-thioguanine nucleotides.
A: Patients who developed leucopenia had much higher early DNA-thioguanine levels compared with those who did not (P = 4.9 × 10⁻¹³); B: Patients who developed leucopenia had slightly higher early 6-thioguanine nucleotides levels compared with those who did not (P = 0.021). P values were determined by the Mann-Whitney test. 6TGN: 6-thioguanine nucleotides; DNATG: DNA-thioguanine.
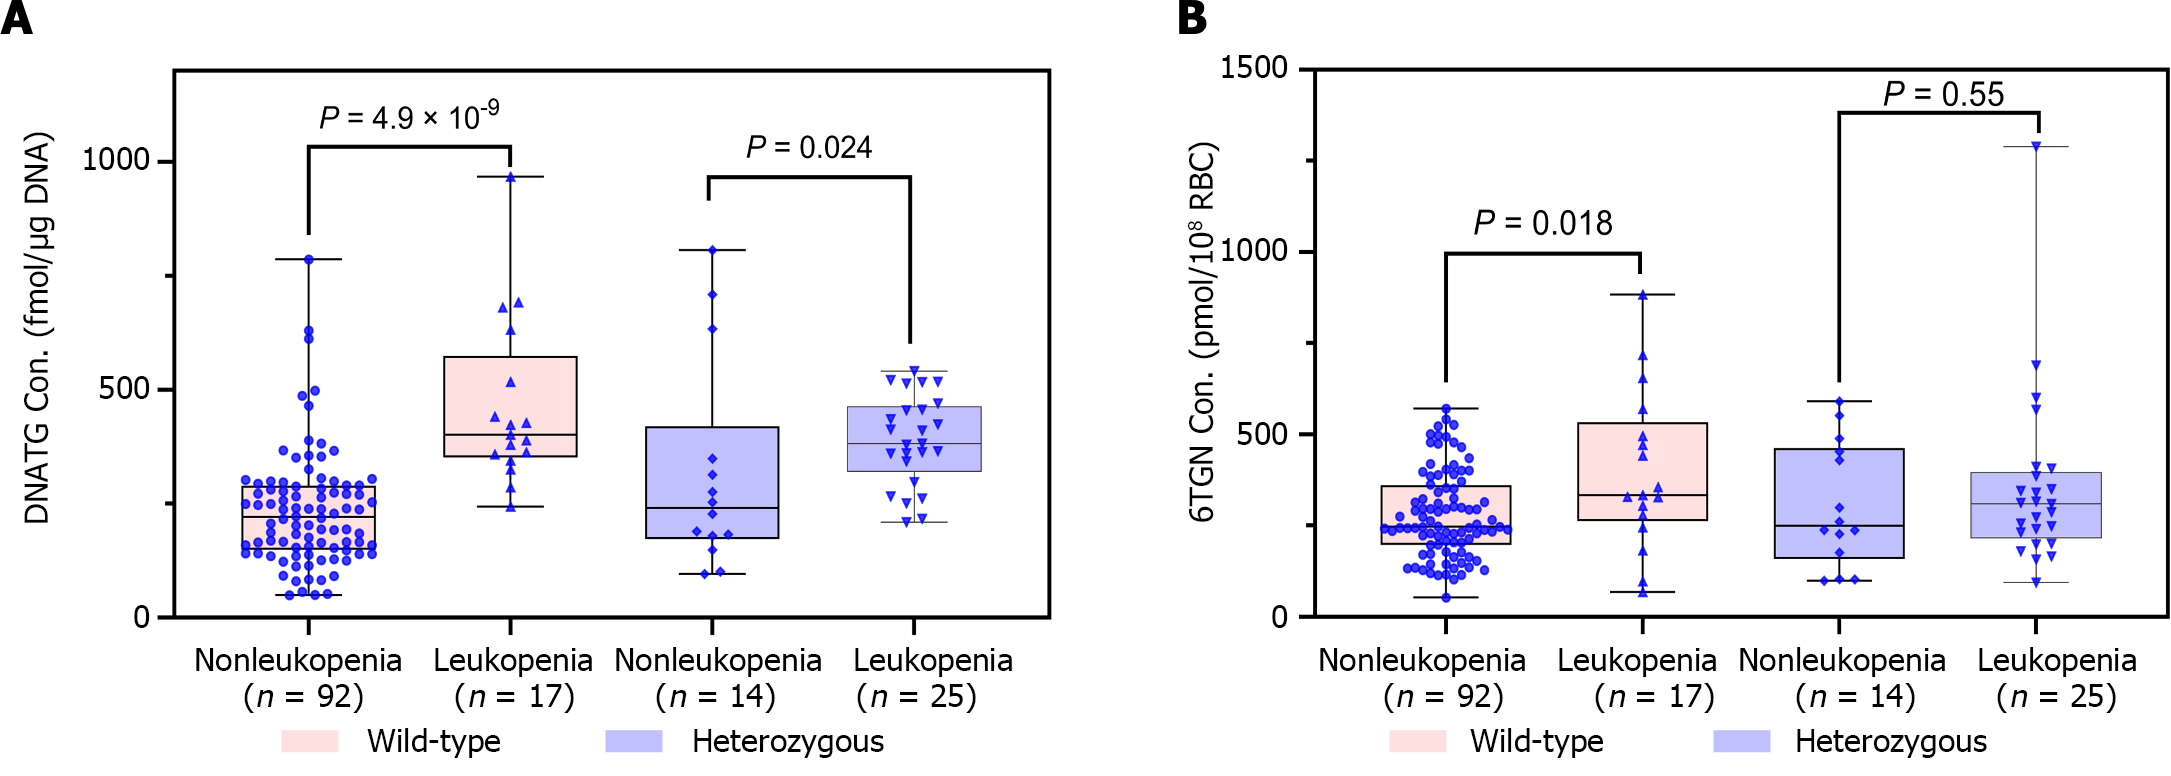
Figure 5 Early DNA-thioguanine concentration was significantly associated with late leucopenia, especially in thiopurine methyl-transferase/nudix hydrolase 15 wild-type patients compared to 6-thioguanine nucleotides.
A: Early DNA-thioguanine concentration was associated with late leucopenia, especially in nudix hydrolase 15 (NUDT15)/thiopurine methyltransferase (TPMT) wild-type patients (P = 4.9 × 10⁻⁹vs P = 0.024); B: 6-thioguanine nucleotides was correlated with late leucopenia in NUDT15/TPMT wild-type patients (P = 0.018) but not in heterozygous subgroups (P =0.55). P values were determined by the Mann-Whitney test. 6TGN: 6-thioguanine nucleotides; DNATG: DNA-thioguanine; RBC: Red blood cell.
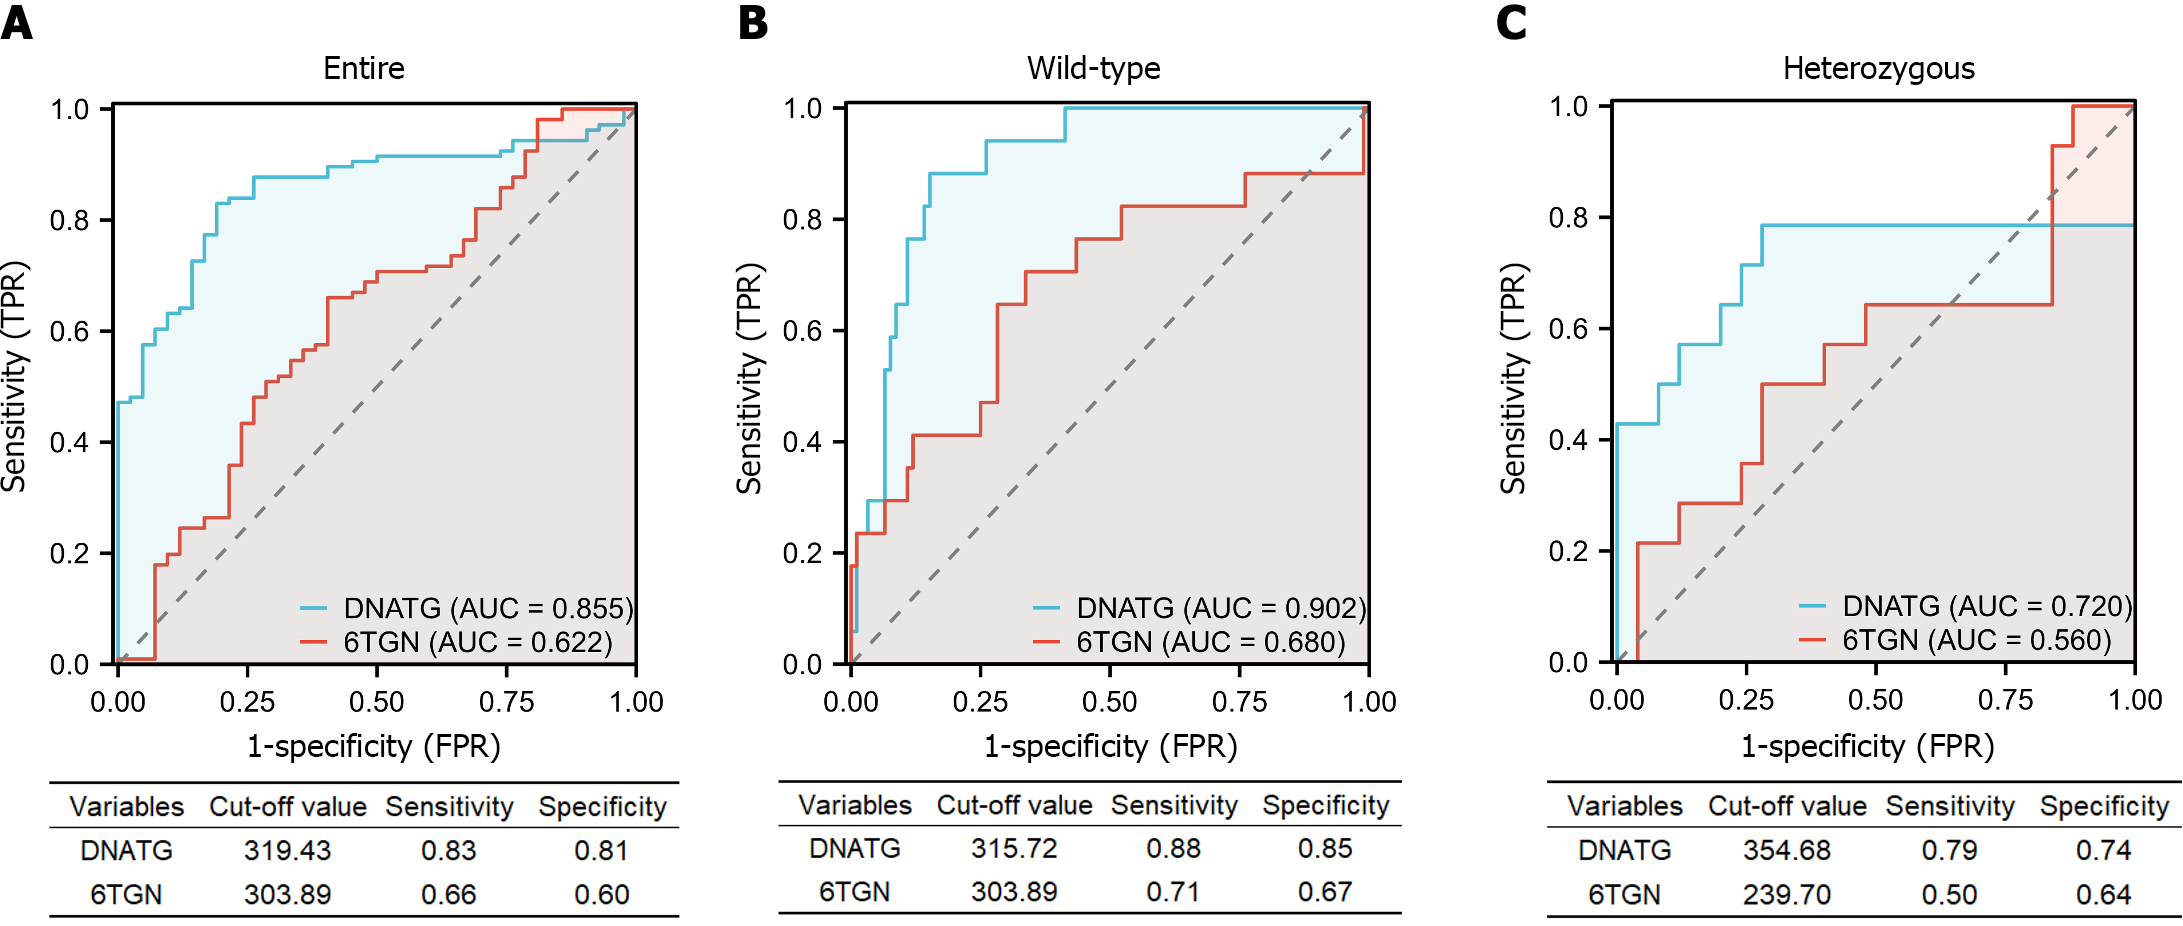
Figure 6 Performance of early DNA-thioguanine and 6-thioguanine nucleotides concentrations in the prediction of late leucopenia in the entire population, nudix hydrolase 15/thiopurine methyltransferase wild-type and heterozygous subgroups.
A: Performance in the entire population; B: Performance in nudix hydrolase 15 (NUDT15)/thiopurine methyltransferase (TPMT) wild-type subgroups; C: Performance in NUDT15/TPMT heterozygous subgroups. 6TGN: 6-thioguanine nucleotides; DNATG: DNA-thioguanine; AUC: Area under the curve; FPR: False positive rate; TPR: True positive rate.
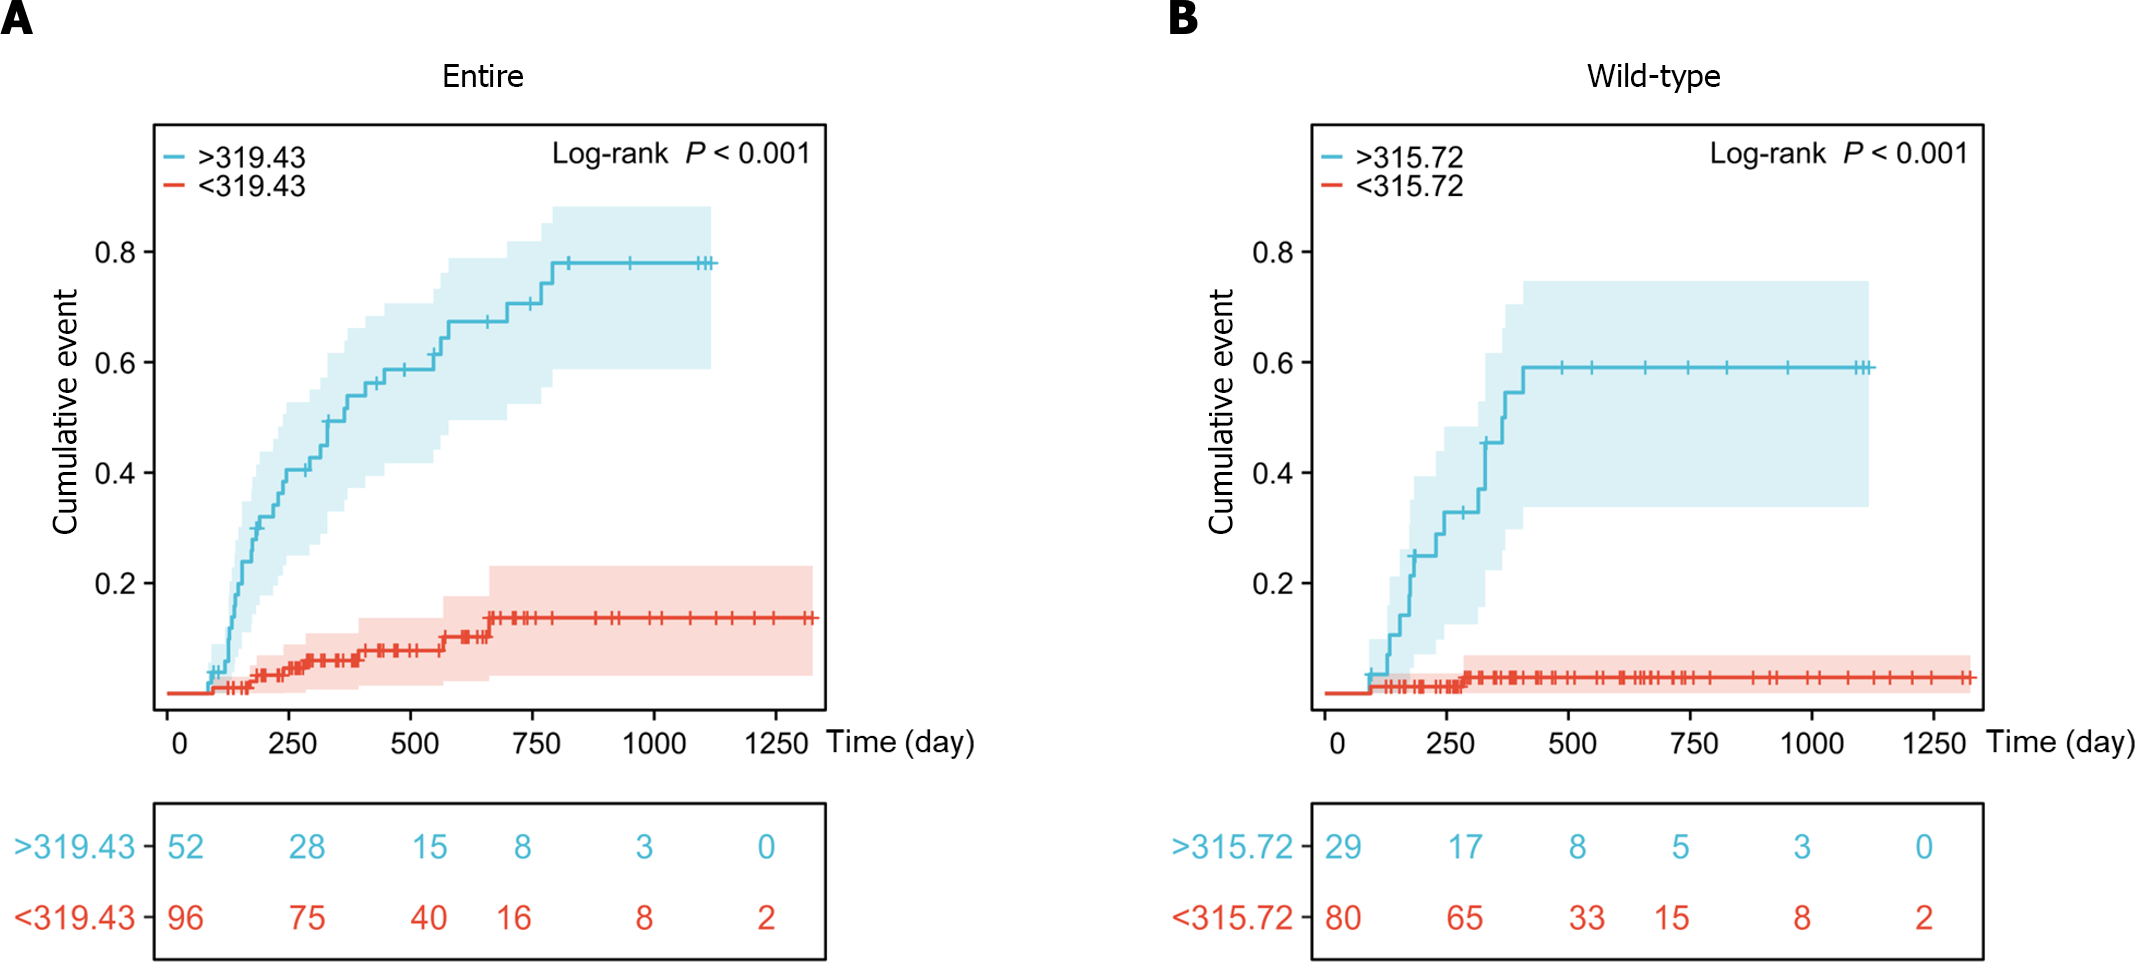
Figure 7 The cumulative events of leucopenia with corresponding DNA-thioguanine thresholds in the entire and thiopurine methyltransferase/nudix hydrolase 15 wild-type populations.
A: Cumulative incidence rates were significantly greater in patients with DNA-thioguanine (DNATG) concentrations of more than 319.43 fmol/μg DNA in the entire population; B: Cumulative incidence rates were significantly greater in patients with DNATG concentrations of more than 315.72 fmol/μg DNA in the thiopurine methyltransferase/nudix hydrolase 15 wild-type population. Both log-rank P < 0.001. Kaplan-Meier survival analysis followed by the log-rank test was employed to estimate cumulative leucopenia events.
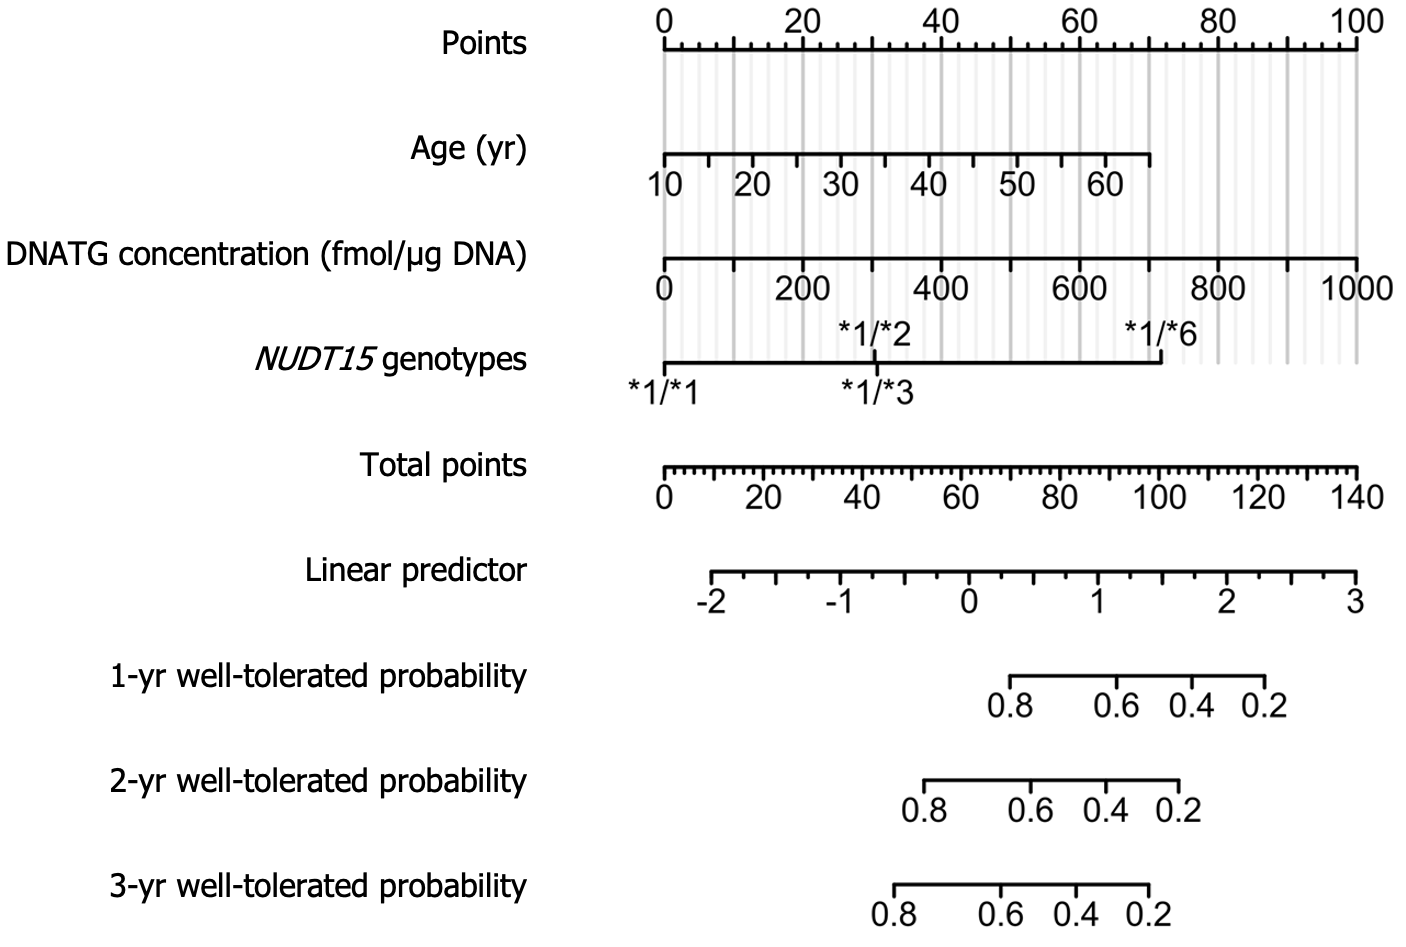
Figure 8 Nomogram based on the multivariate analysis results shown in Table 2.
For example, a 65-year-old patient with the wild-type nudix hydrolase 15 (NUDT15)*1/*1, having a DNA-thioguanine (DNATG) concentration of 200 fmol/μg DNA, would score 70 for age, 20 for DNATG concentration, and 0 for the NUDT15 genotype, resulting in a total score of 90. Correspondingly, the estimated 1-year, 2-year, and 3-year well-tolerated (no occurrence of late leukopenia) probabilities are approximately 0.6, 0.4, and 0.3, respectively. DNATG: DNA-thioguanine; NUDT15: Nudix hydrolase 15.
- Citation: Yang T, Chao K, Zhu X, Wang XD, Chan S, Guan YP, Mao J, Li P, Guan SX, Xie W, Gao X, Huang M. Early proactive monitoring of DNA-thioguanine in patients with Crohn’s disease predicts thiopurine-induced late leucopenia in NUDT15/TPMT normal metabolizers. World J Gastroenterol 2024; 30(12): 1751-1763
- URL: https://www.wjgnet.com/1007-9327/full/v30/i12/1751.htm
- DOI: https://dx.doi.org/10.3748/wjg.v30.i12.1751


