Copyright
©The Author(s) 2024.
World J Gastroenterol. Mar 28, 2024; 30(12): 1680-1705
Published online Mar 28, 2024. doi: 10.3748/wjg.v30.i12.1680
Published online Mar 28, 2024. doi: 10.3748/wjg.v30.i12.1680
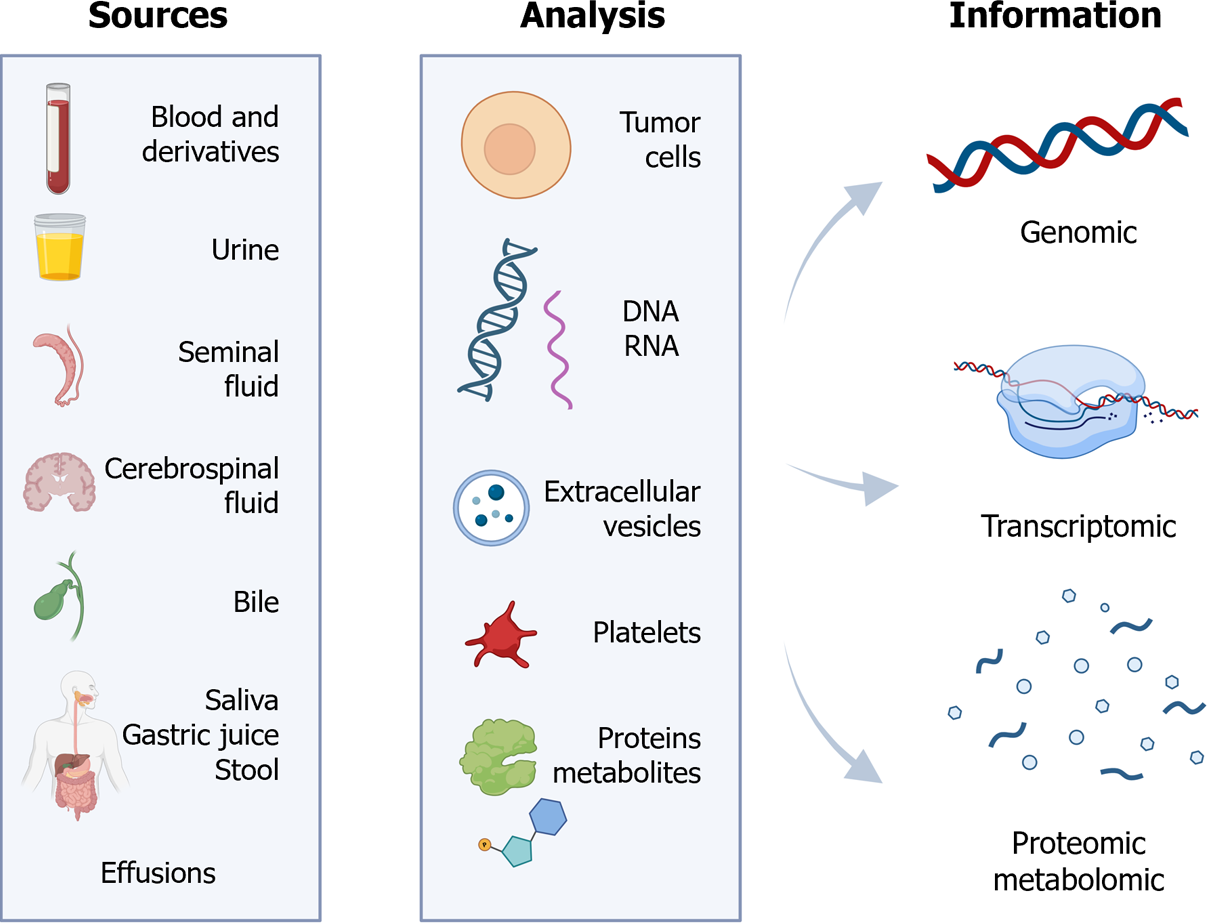
Figure 1 Key specimens, analyzable structures, and information obtained through liquid biopsy techniques.
Citation: The authors have obtained permission to use the figure from BioRender.com (Supplementary material)[210].
Figure 2 Main branches of cytology.
A: Exfoliative cytology; the study of cells shed from body surfaces, collected either spontaneously or mechanically; B: Aspiration cytology; analysis of fluids obtained via fine-needle aspiration, from both superficial and deep tissues, with or without image-guided control. Image created by Tony Punk (contacto@tonypunk.es).
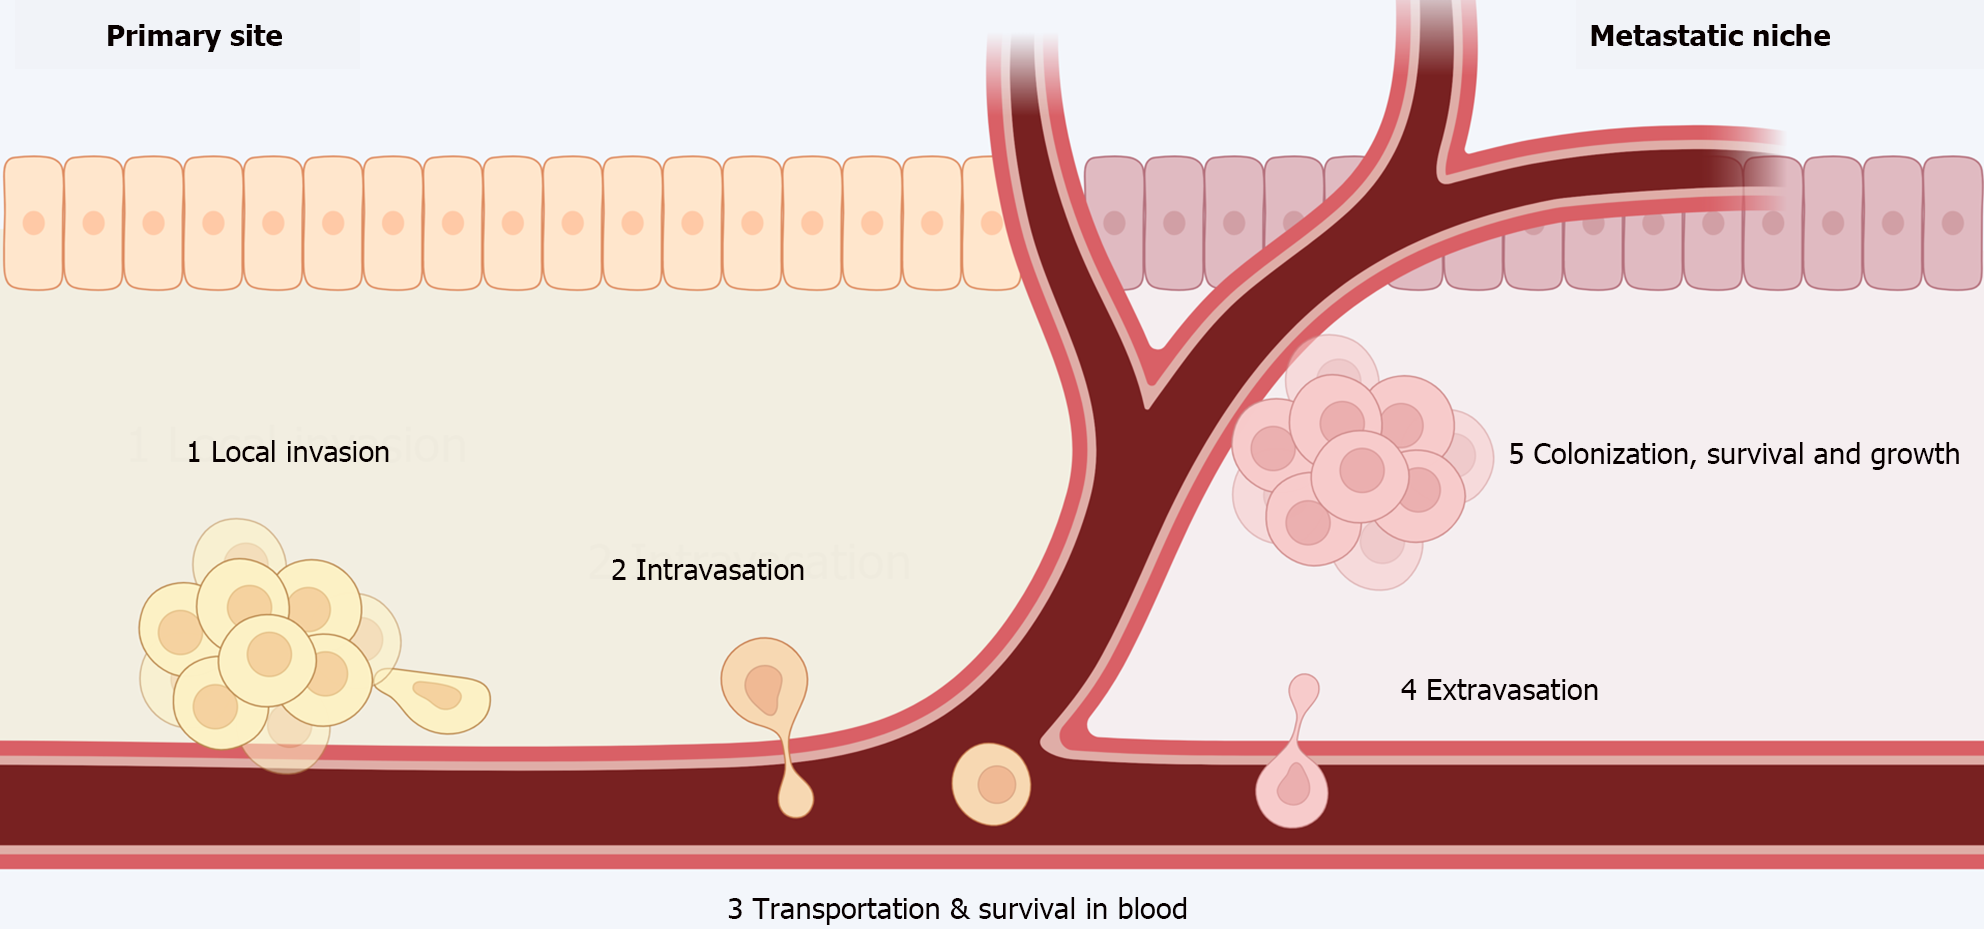
Figure 3 Metastatic process.
(1) Local invasion of tumor cells into adjacent tissues; (2) intravasation; (3) transportation and survival through the blood as circulating tumor cells; (4) extravasation; and (5) colonization, survival, and growth in distant organs until detectable metastases develop. Citation: The authors have obtained permission to use the figure from BioRender.com (Supplementary material)[210].
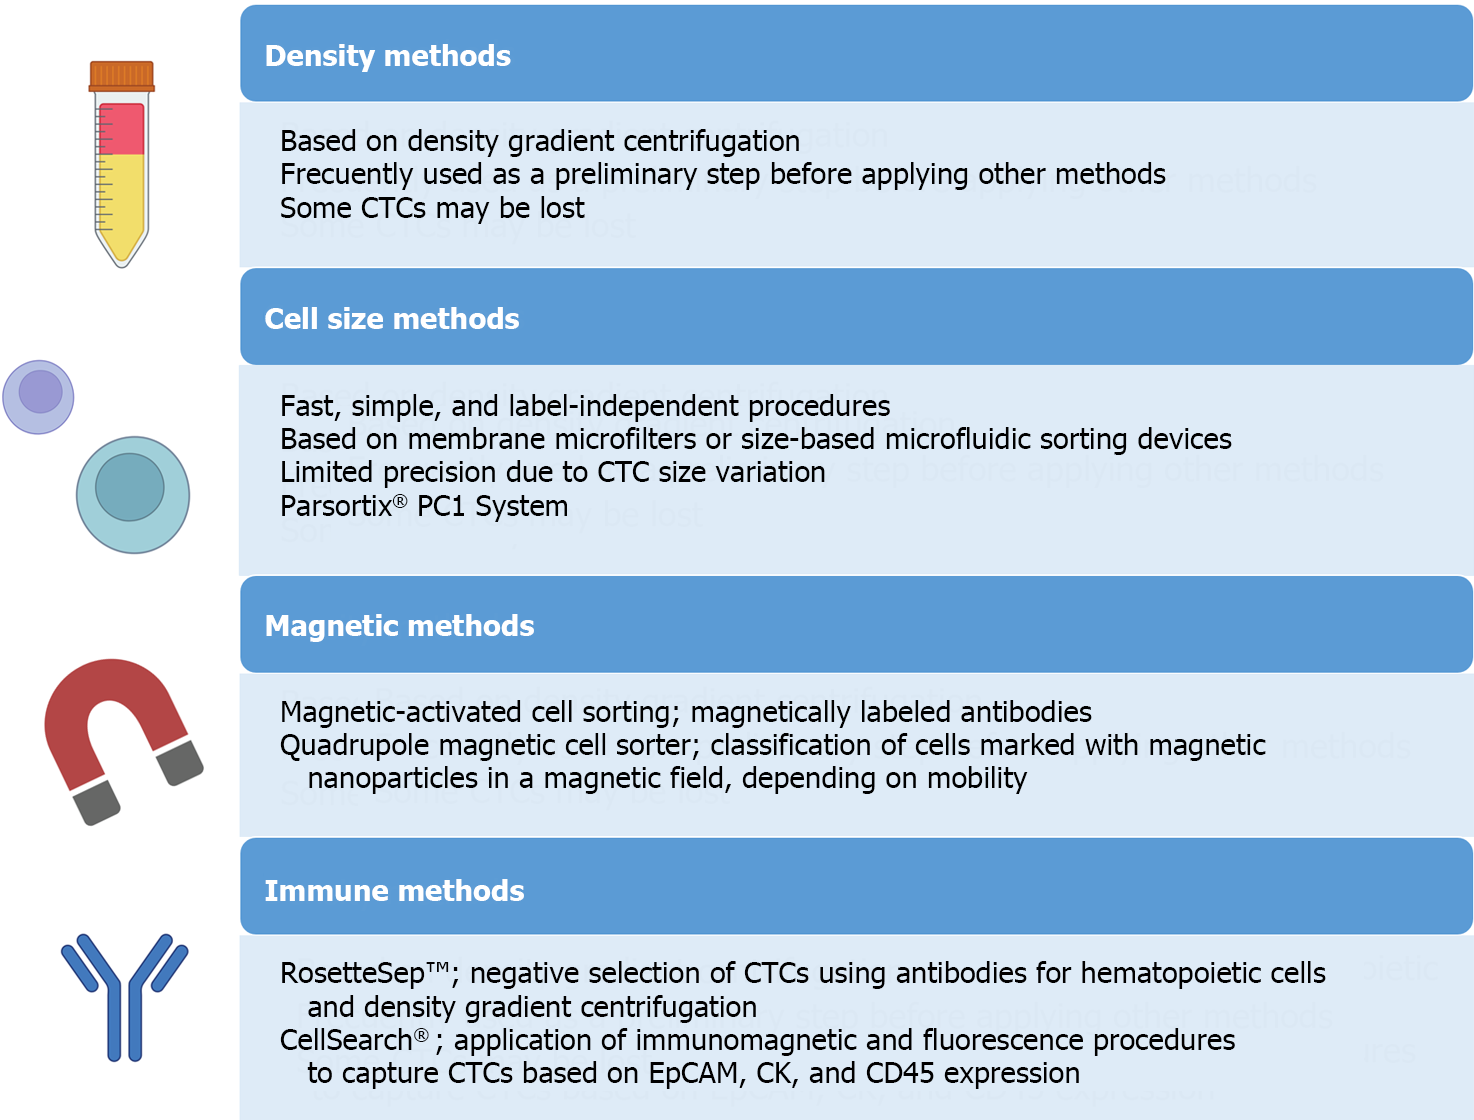
Figure 4 Principal methods developed for the isolation and detection of circulating tumor cells.
CTCs: Circulating tumor cells. Citation: The authors have obtained permission to use the figure from BioRender.com (Supplementary material)[210].
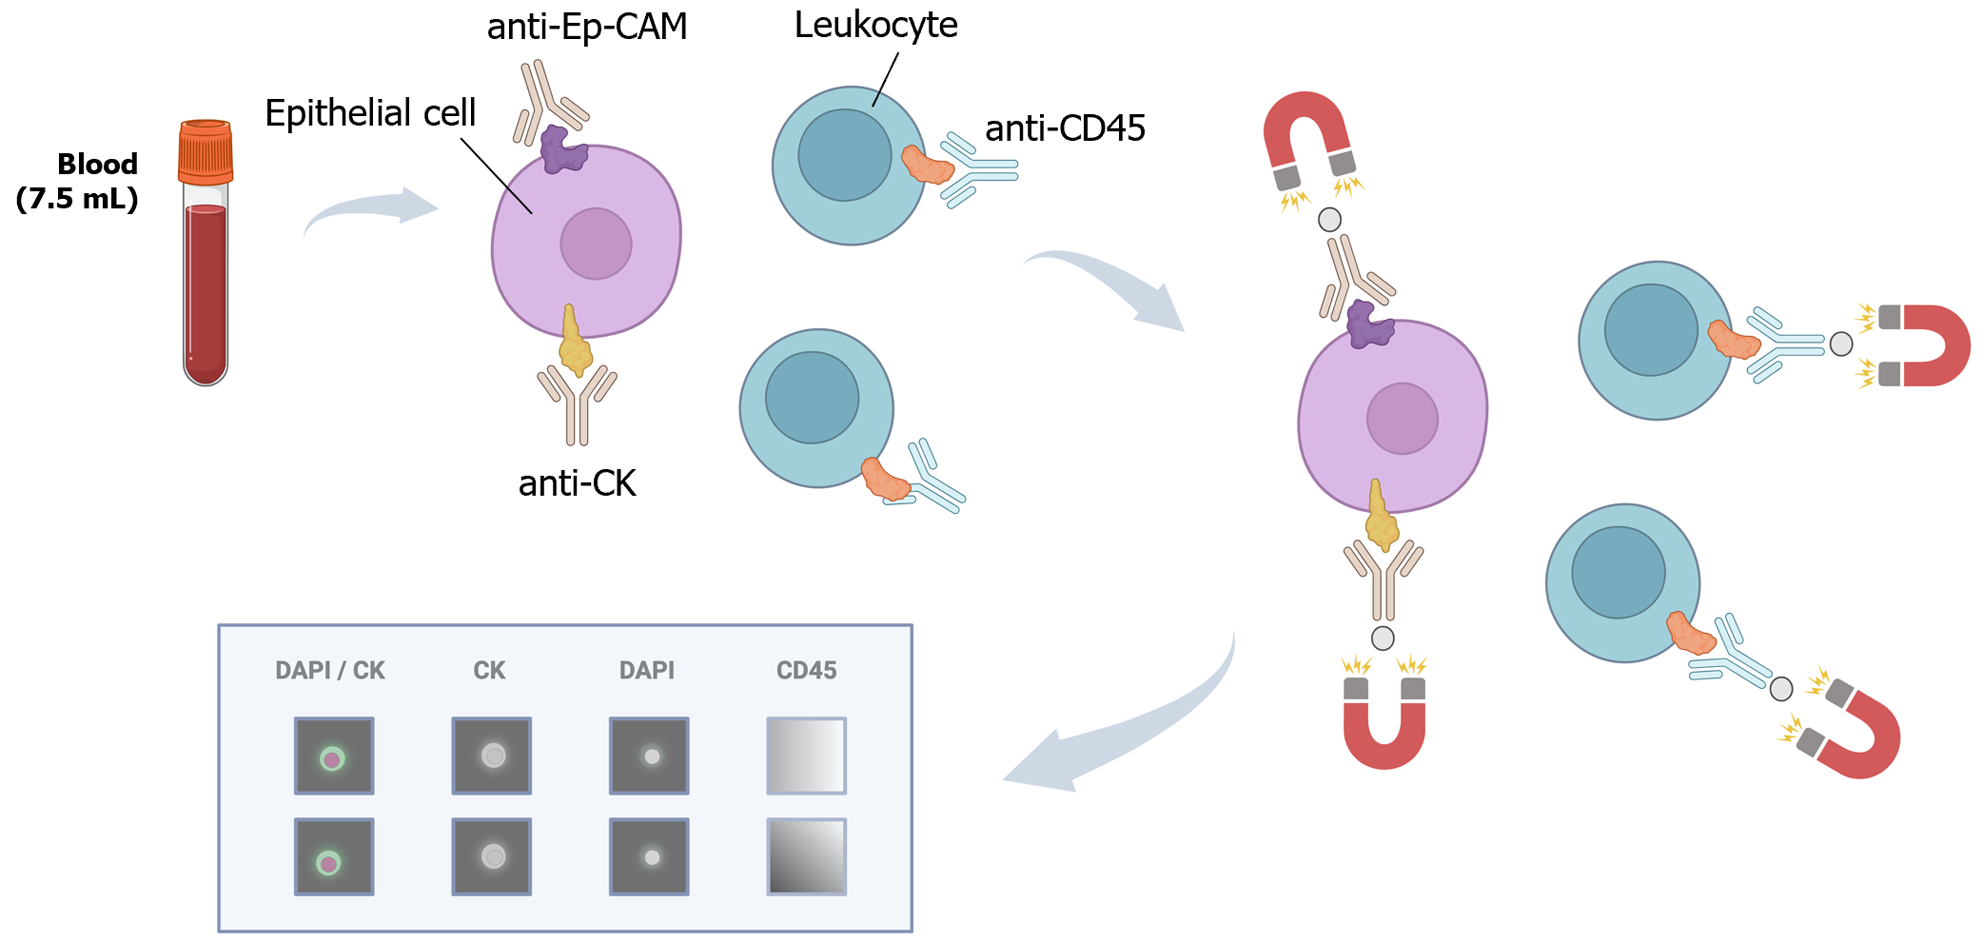
Figure 5 CellSearch® platform.
The system analyzes a 7.5 mL blood sample using a ferrofluidic capture reagent, immunofluorescent reagents, and a magnetic field. The ferrofluid reagent comprises a magnetic core surrounded by a polymer layer coated with EpCAM antibodies to capture circulating tumor cells. Fluorescent reagents (CK-PE, DAPI, and anti-CD45) are added, and the sample is loaded into a cartridge within a strong magnetic field. The platform scans the surface of the cartridge, acquires images, and presents them in a gallery format for final classification. Citation: The authors have obtained permission to use the figure from BioRender.com (Supplementary material)[210].
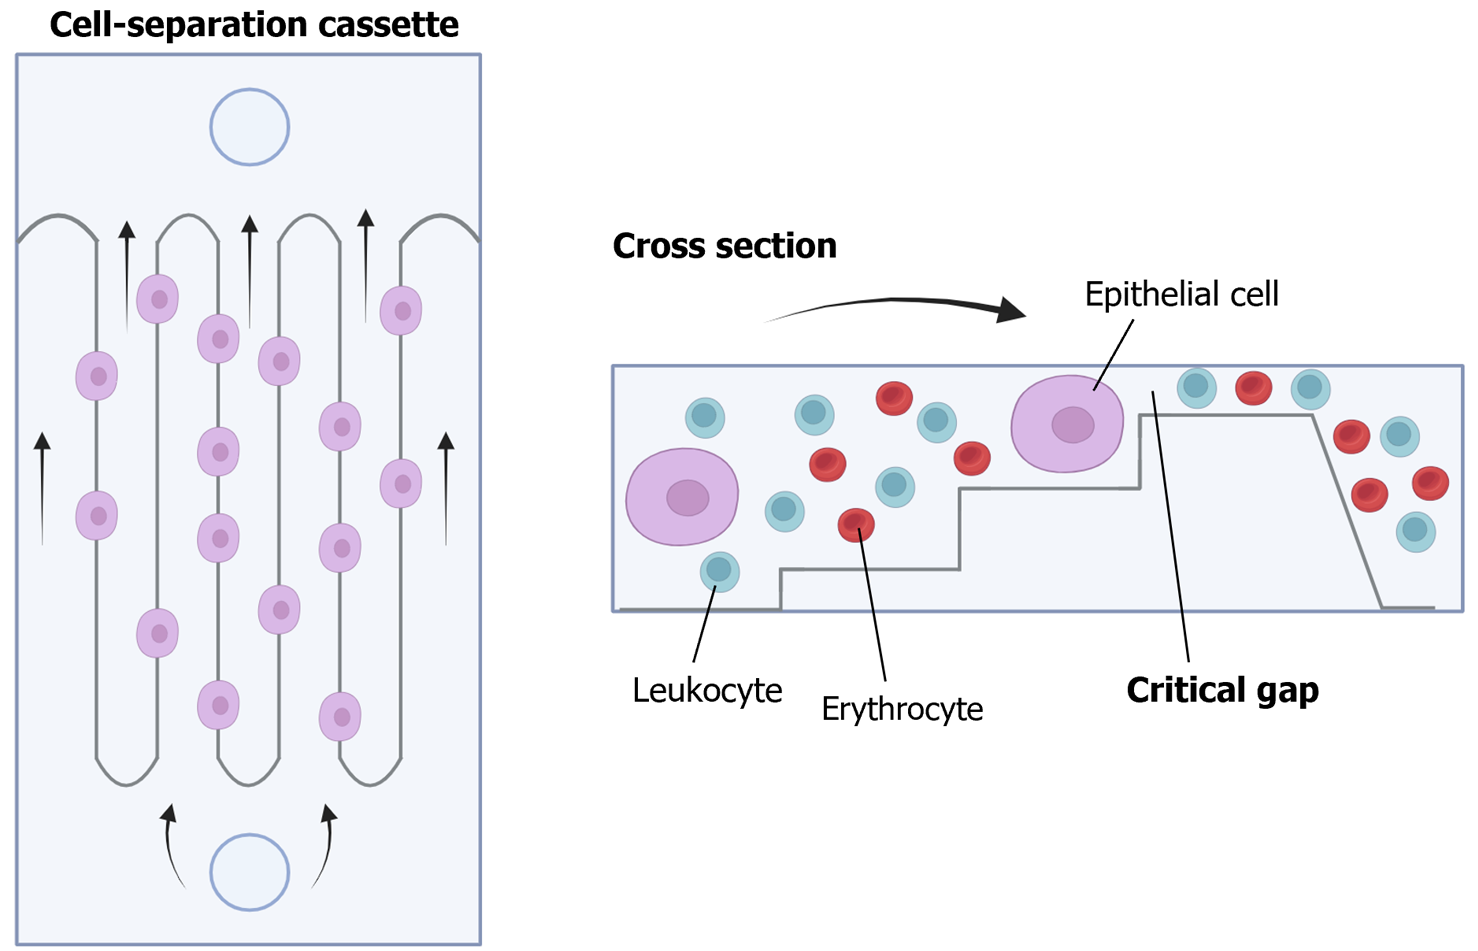
Figure 6 Parsortix® PC1 system.
This platform is a physical method for detecting circulating tumor cells from a blood sample, suitable for subsequent user-validated downstream analyses. It incorporates single-use cell separation cassettes, allowing blood to pass through until reaching a critical gap where circulating tumor cells are captured. Citation: The authors have obtained permission to use the figure from BioRender.com (Supplementary material)[210].
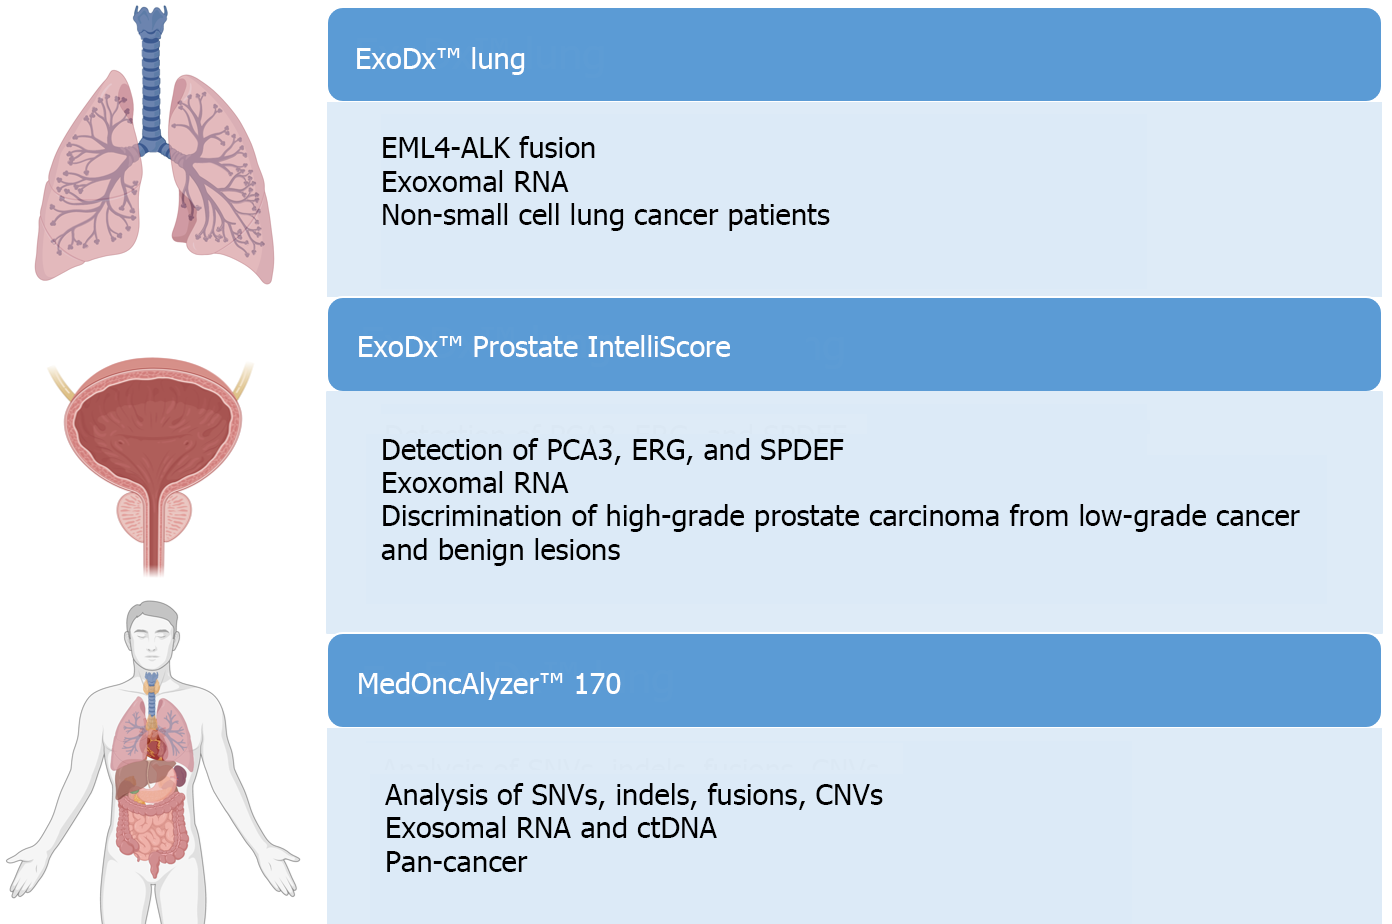
Figure 7 Primary platforms approved for the analysis of extracellular vesicles in liquid biopsy.
SNV: Single nucleotide variant; CNV: Copy number variant; ctDNA: Circulating tumor DNA. Citation: The authors have obtained permission to use the figure from BioRender.com (Supplementary material)[210].
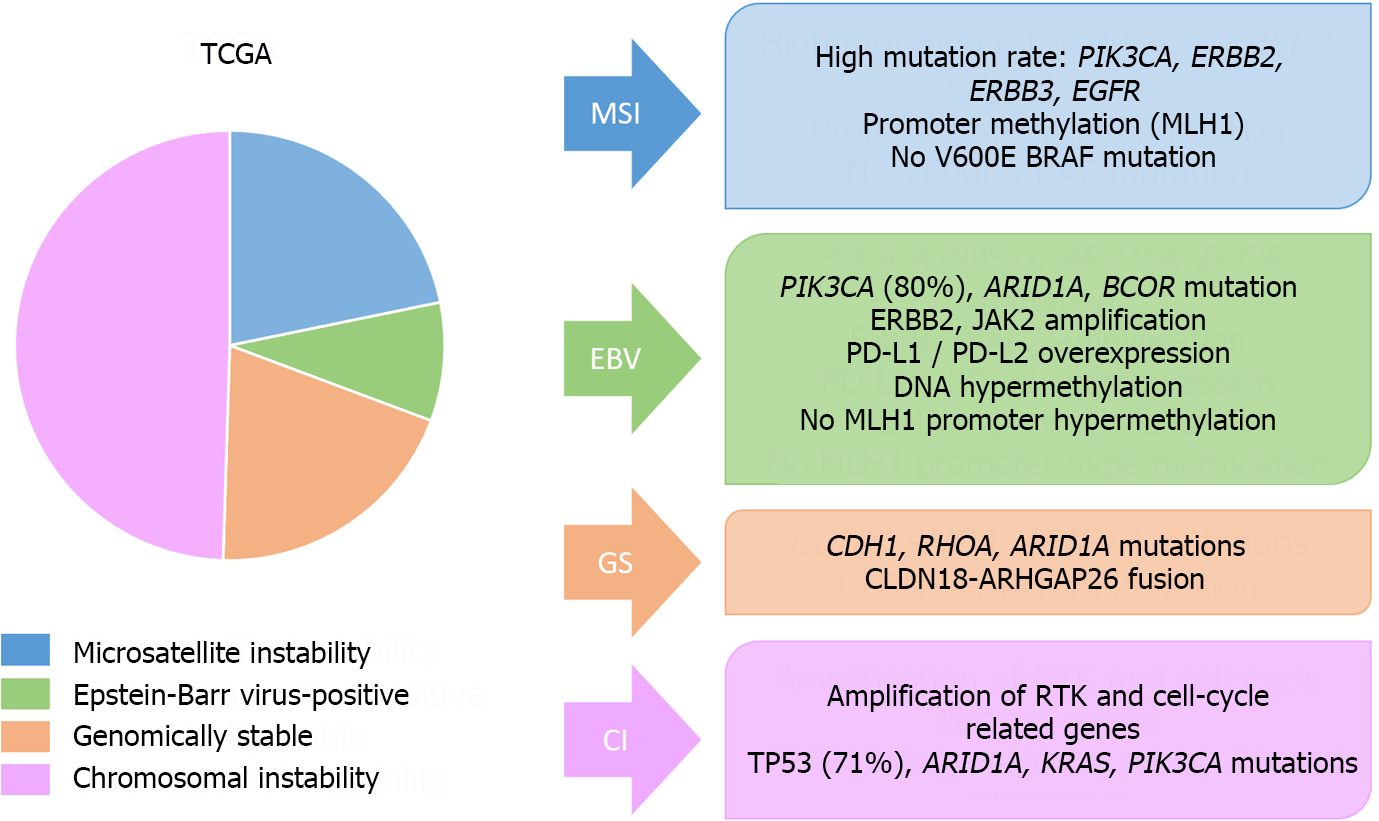
Figure 8 Molecular classifications of gastric cancer.
Main molecular features of The Cancer Genome Atlas classification. TCGA: The Cancer Genome Atlas; MSI: Microsatellite instability; EBV: Epstein-Barr virus; GS: Genomically stable; CI: Chromosomal instability.
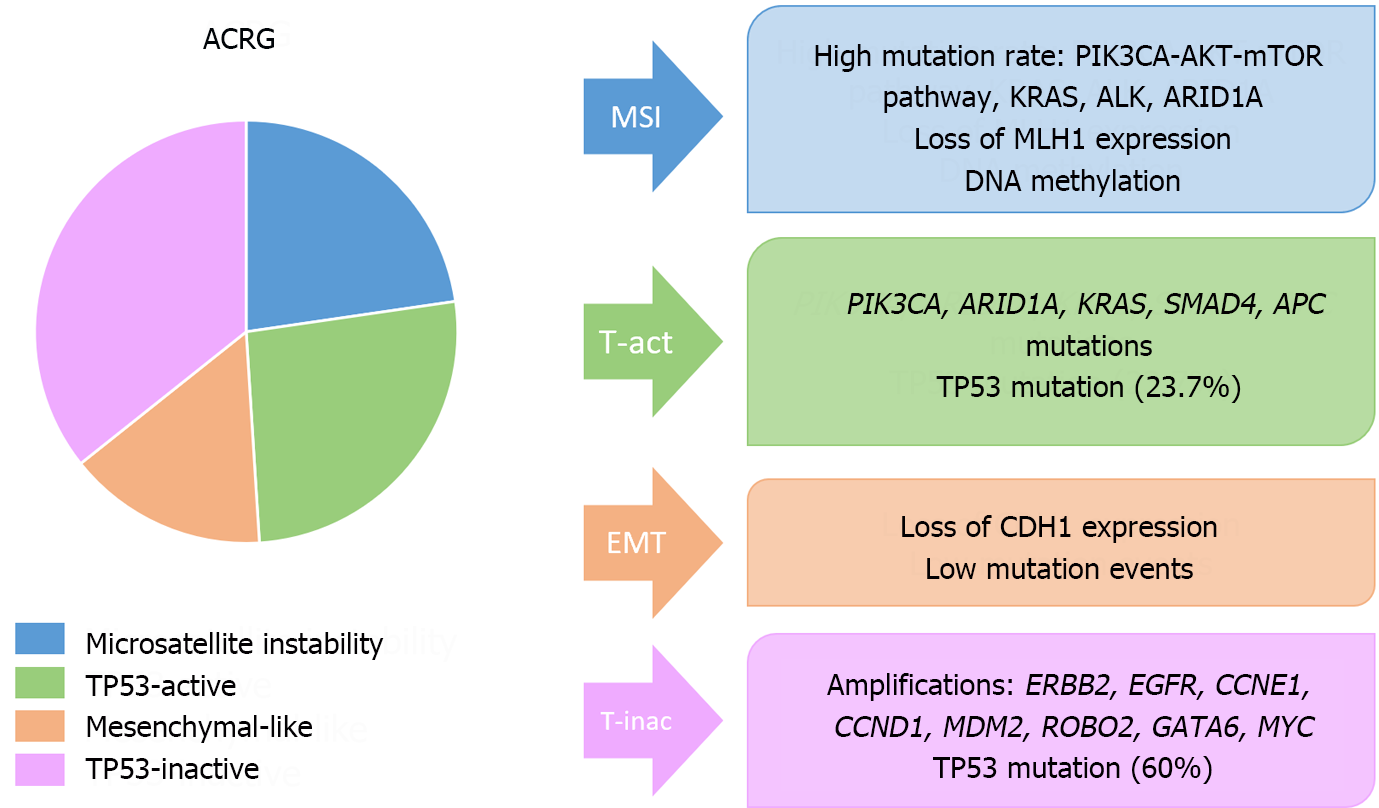
Figure 9 Molecular classifications of gastric cancer.
Main molecular features of the Asian Cancer Research Group classification. MSI: Microsatellite instability; ACRG: The Asian Cancer Research Group; EMT: Epithelial-mesenchymal transition.
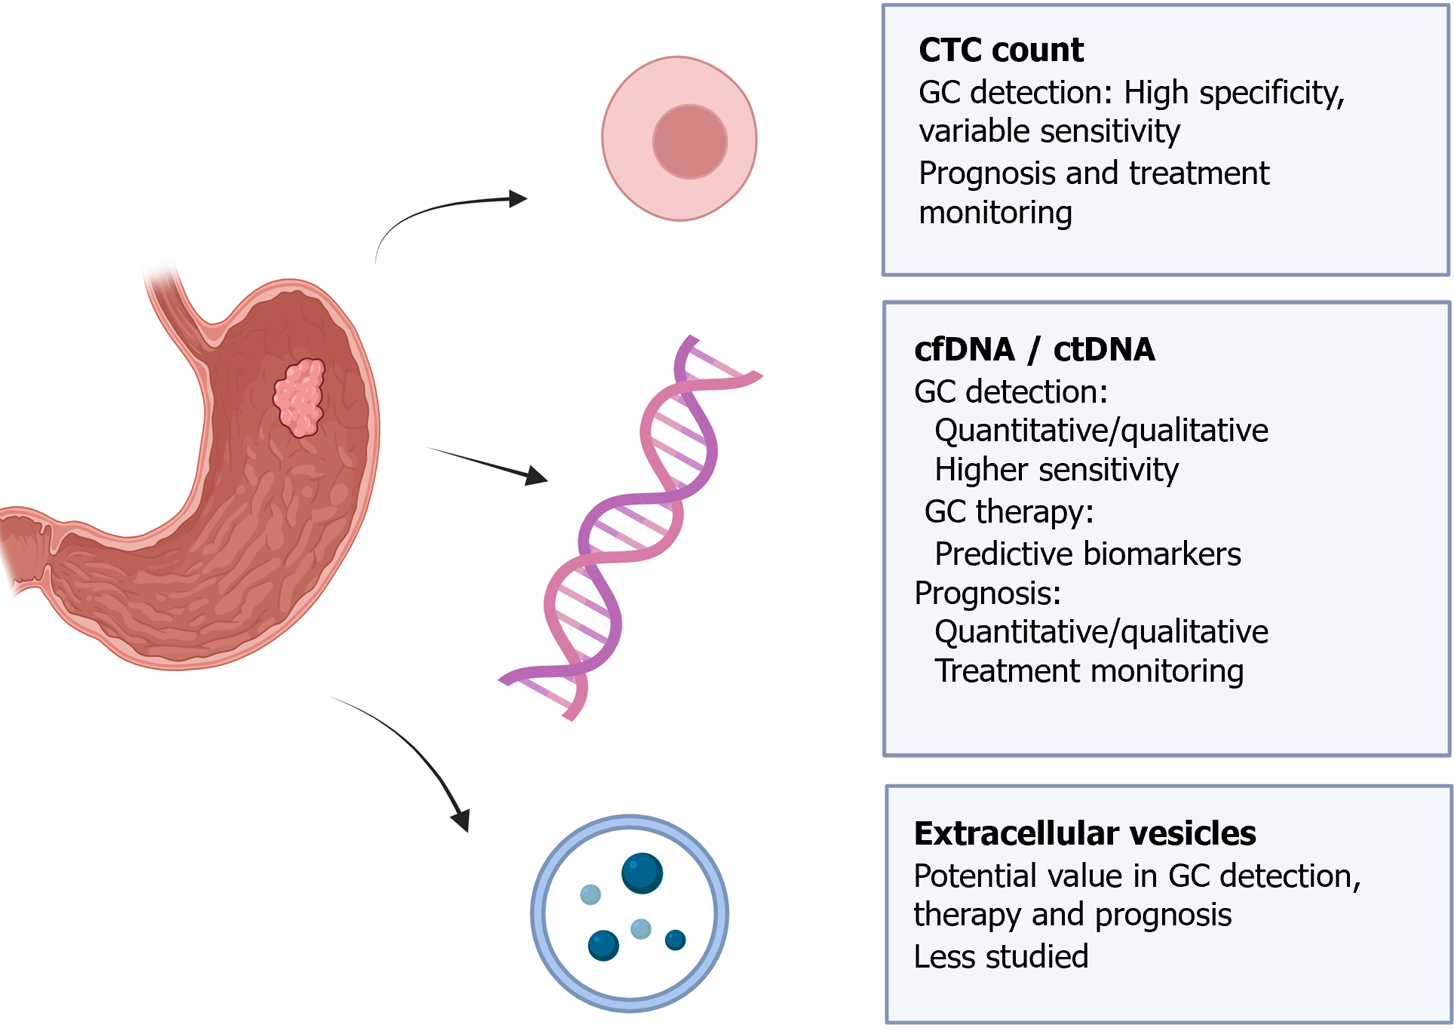
Figure 10 Key applications of analyzing circulating tumor cells, cell-free DNA/circulating tumor DNA, and extracellular vesicles in gastric cancer.
CTC: Circulating tumor cell; cfDNA/ctDNA: Cell-free DNA/circulating tumor DNA. Citation: The authors have obtained permission to use the figure from BioRender.com (Supplementary material)[210].
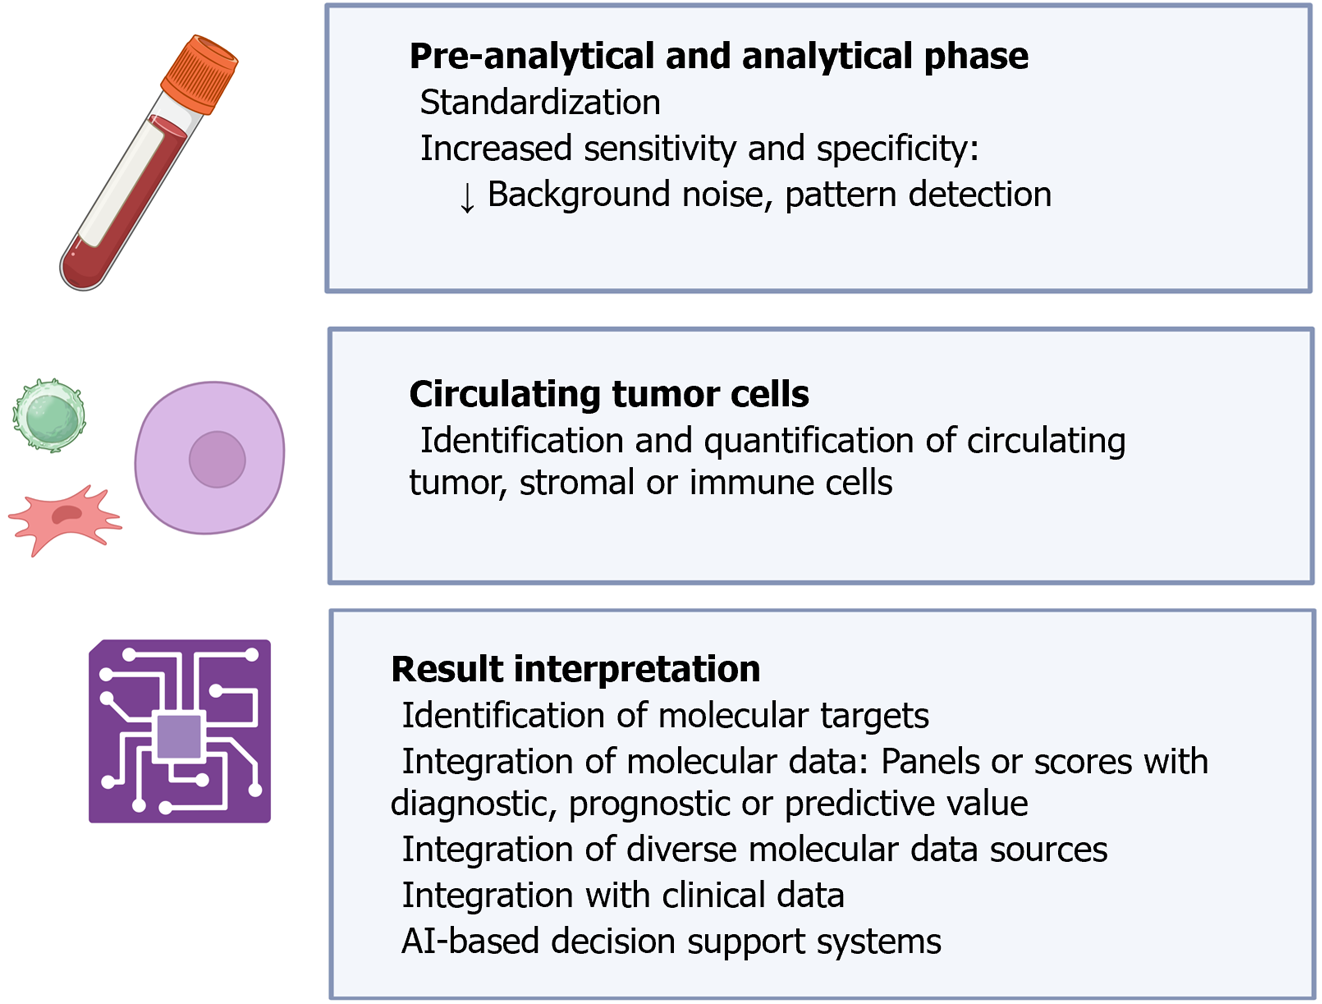
Figure 11 Main applications of artificial intelligence techniques in liquid biopsy.
Citation: The authors have obtained permission to use the figure from BioRender.com (Supplementary material)[210].
- Citation: Díaz del Arco C, Fernández Aceñero MJ, Ortega Medina L. Liquid biopsy for gastric cancer: Techniques, applications, and future directions. World J Gastroenterol 2024; 30(12): 1680-1705
- URL: https://www.wjgnet.com/1007-9327/full/v30/i12/1680.htm
- DOI: https://dx.doi.org/10.3748/wjg.v30.i12.1680


