Copyright
©The Author(s) 2024.
World J Gastroenterol. Mar 21, 2024; 30(11): 1572-1587
Published online Mar 21, 2024. doi: 10.3748/wjg.v30.i11.1572
Published online Mar 21, 2024. doi: 10.3748/wjg.v30.i11.1572
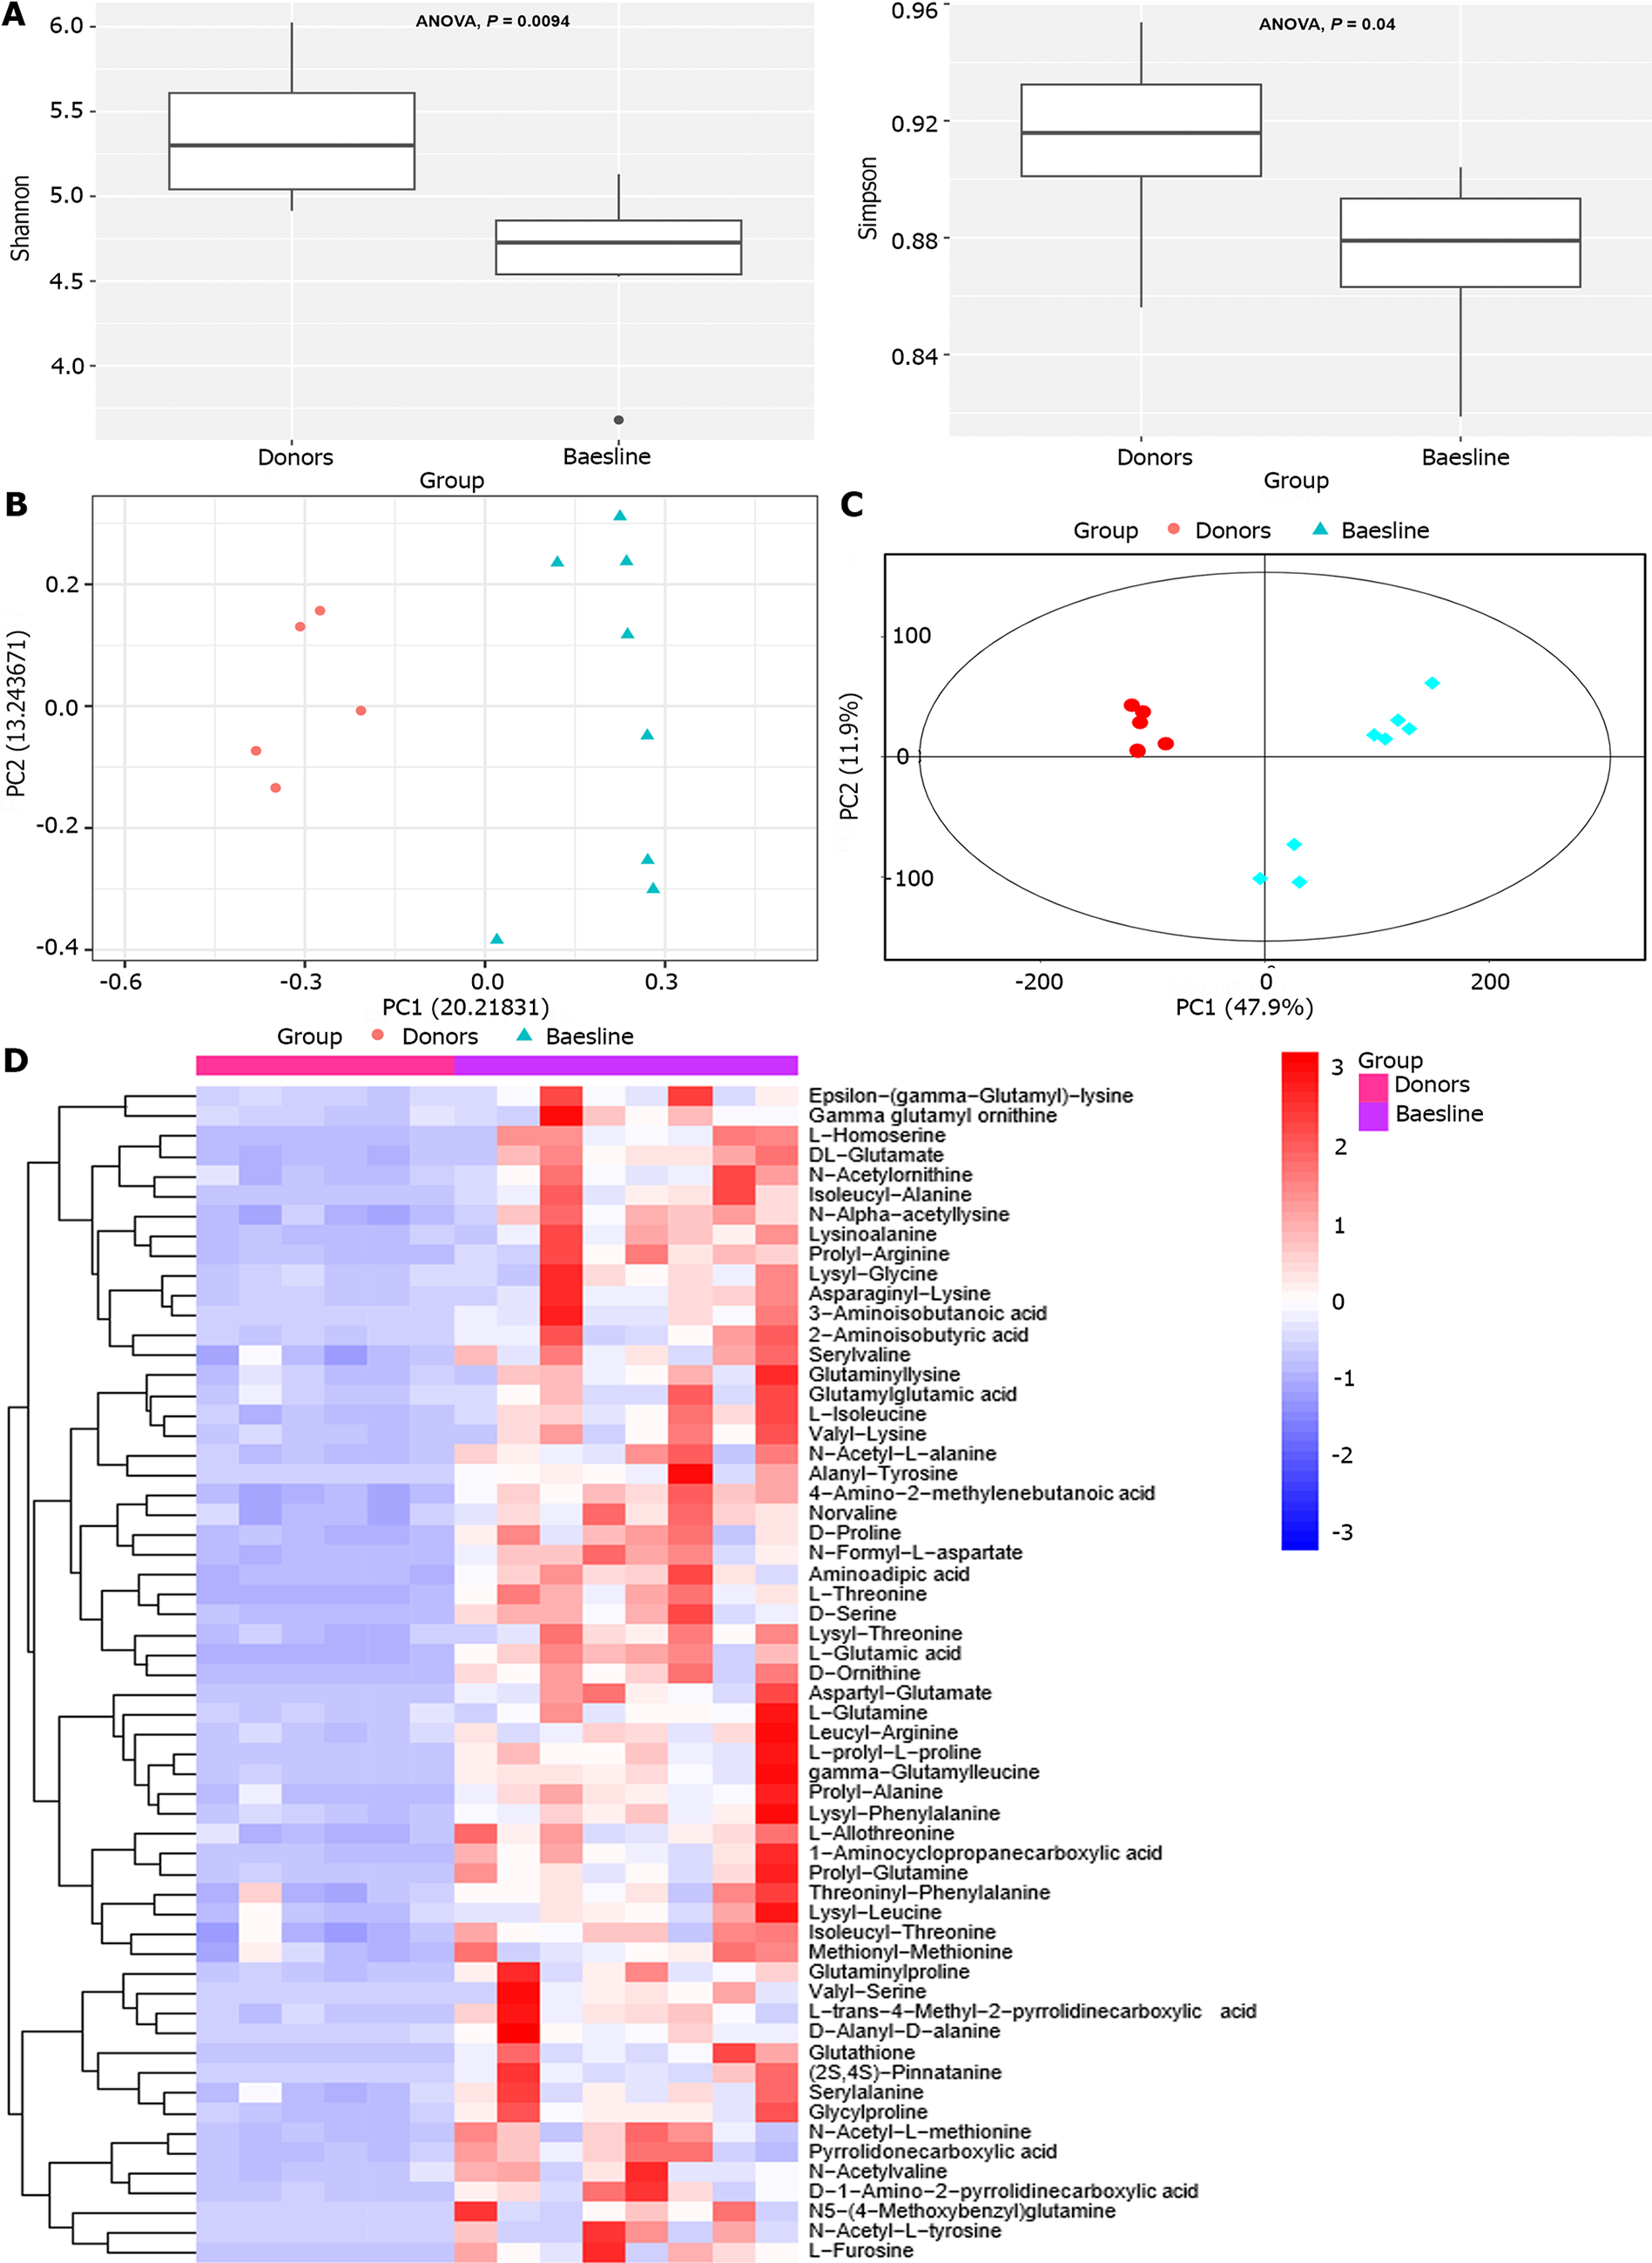
Figure 1 Mildly active Crohn’s disease patients differed from the donors in alpha and beta diversity and metabolites.
A: Baseline Crohn’s disease (CD) patients exhibited significantly lower gut microbiome Shannon’s and Simpson’s index than the donors; B: Comparison of beta diversity of the microbial communities between baseline CD patients and donors. The Jaccard distances from principal coordinate analyses of abundance are depicted as donors (red) and baseline CD patients (blue). The donors’ samples were more tightly clustered than the baseline samples; C: The PCA score plot clearly discriminated between donors (red) and baseline CD patients (blue), where donors’ samples were more tightly clustered than baseline CD patients’ samples; D: The heat map depicts the intensity of amino acid in the feces of CD patients and donors.
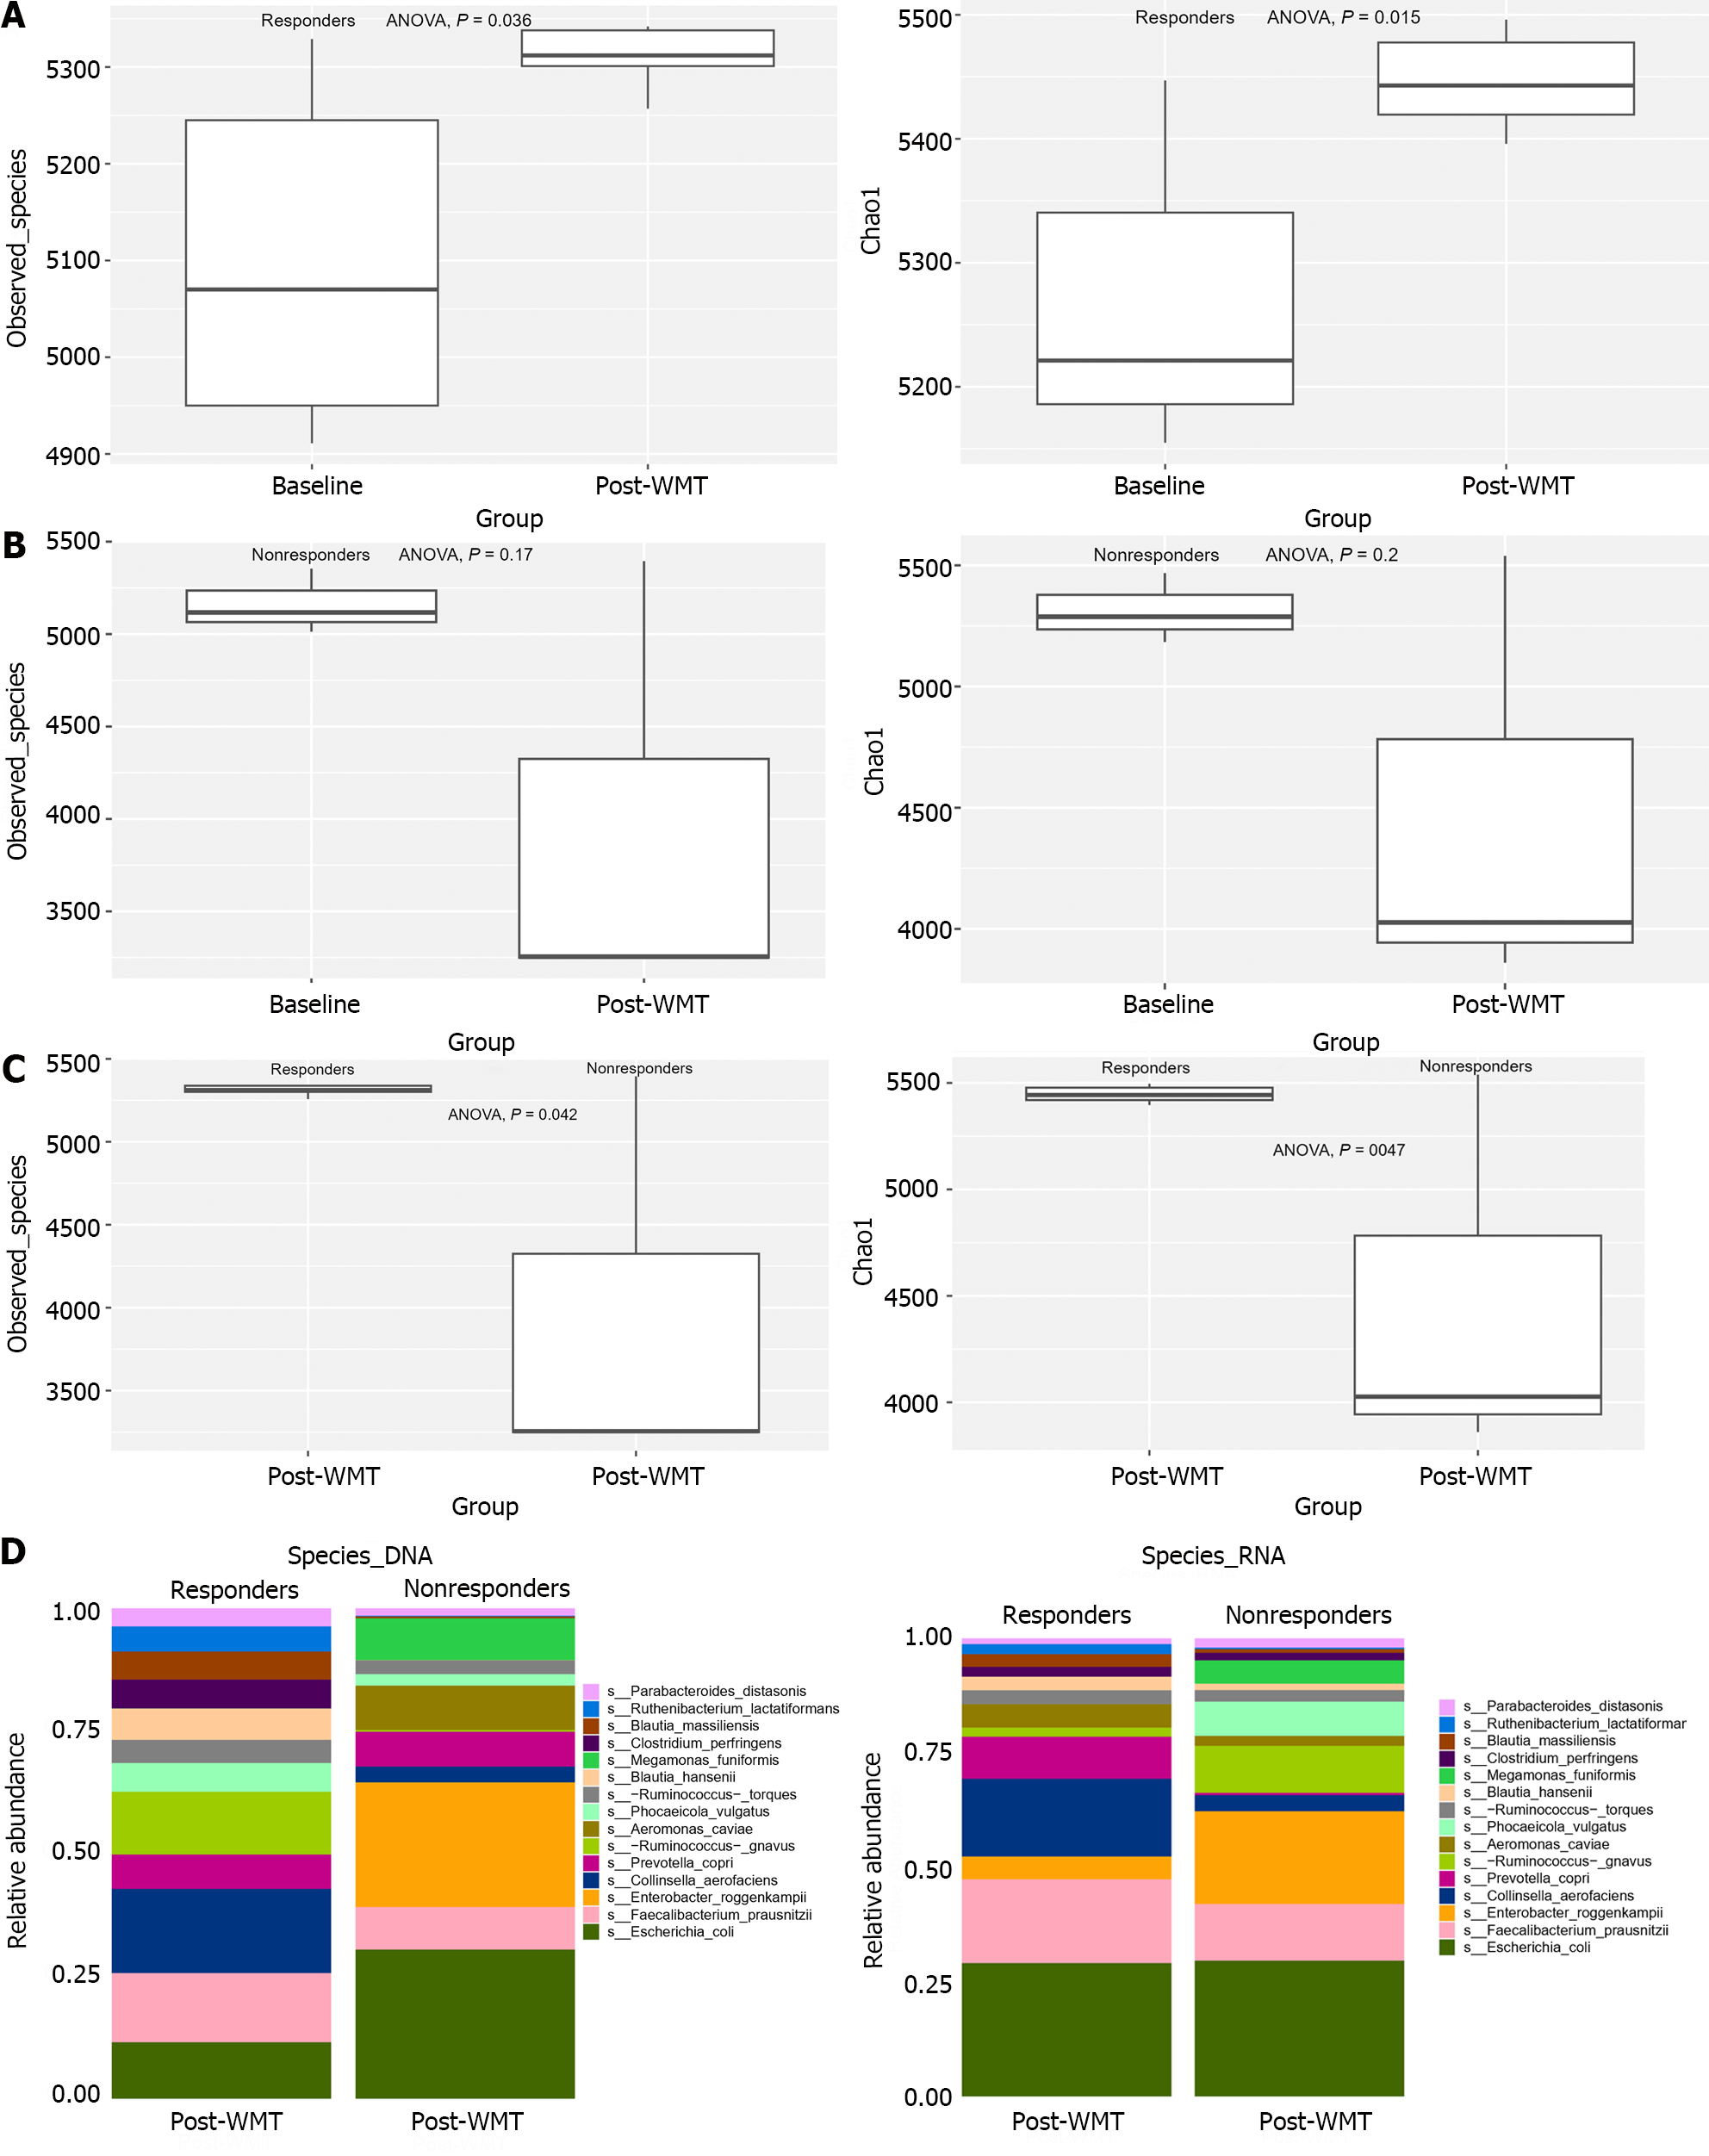
Figure 2 Patients’ clinical symptoms were correlated with the composition of the gut microbiota and alpha diversity.
A: The observed species and chao1 index of the gut microbiota were significantly increased in the responders after transplantation; B: The observed species and chao1 index of the gut microbiota of the non-responders did not change significantly before and after washed microbiota transplantation (WMT); C: The observed species and chao1 index significantly larger in the responders than non-responders post-transplantation; D: Similar differences in species-rich changes at both DNA and RNA levels were observed between the responders and non-responders after WMT treatment. WMT: Washed microbiota transplantation.
Figure 3 Changes in microbiome and metabolome before and after WMT in responders.
A: The transfer of Faecalibacterium prausnitzii from the donor to the responders can be detected at both the DNA and RNA levels; B: Demonstration of several fecal metabolites that were significantly higher than those of the donors before the washed microbiota transplantation (WMT) and declined after the WMT; C: Heat map of the selected metabolite intensities between the responder group before and after WMT treatment and the donor trio; D: A plot of the difference in linear discriminant analysis effect size of the species level at the DNA level in the responders before and after the WMT revealed statistically significant differences (P < 0.05); E: The species changes at the RNA level before and after WMT in the responders; F: Correlation heatmap analysis of the differential metabolites in differential species (RNA levels) before and after WMT in the responder group. aP < 0.05, bP < 0.01. WMT: Washed microbiota transplantation.
- Citation: Chen SJ, Zhang DY, Wu X, Zhang FM, Cui BT, Huang YH, Zhang ZL, Wang R, Bai FH. Washed microbiota transplantation for Crohn’s disease: A metagenomic, metatranscriptomic, and metabolomic-based study. World J Gastroenterol 2024; 30(11): 1572-1587
- URL: https://www.wjgnet.com/1007-9327/full/v30/i11/1572.htm
- DOI: https://dx.doi.org/10.3748/wjg.v30.i11.1572


