Copyright
©The Author(s) 2024.
World J Gastroenterol. Mar 21, 2024; 30(11): 1556-1571
Published online Mar 21, 2024. doi: 10.3748/wjg.v30.i11.1556
Published online Mar 21, 2024. doi: 10.3748/wjg.v30.i11.1556
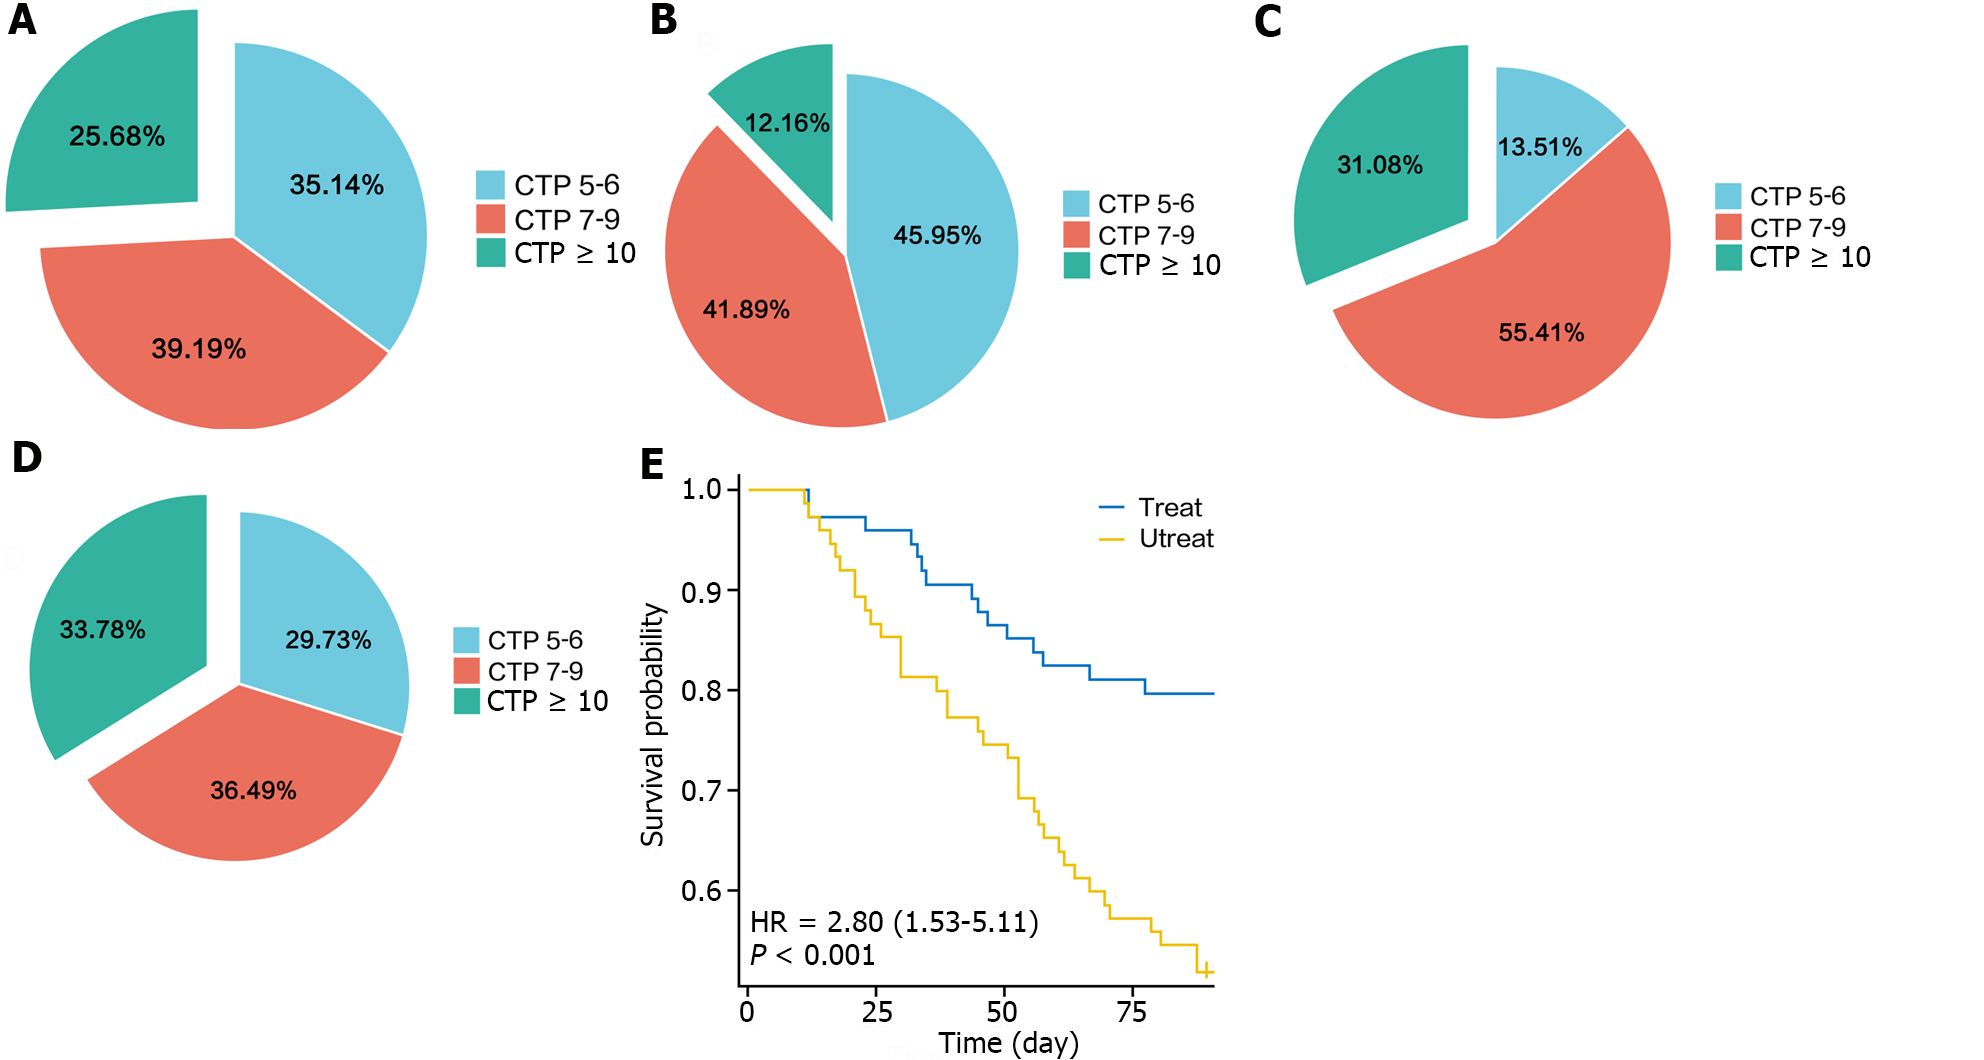
Figure 1 Proportions of Child-Turcotte-Pugh grades A, B, and C before and after treatment in the intervention and nonintervention groups and Kaplan-Meier survival curves.
A: The proportion of Child-Turcotte-Pugh (CTP) grades A, B, and C before treatment in the intervention group; B: The proportions of patients with CTP grades A, B, and C in the intervention group after treatment with Lactobacillus paracasei N1115; C: The proportions of patients with CTP grades A, B, and C in the nonintervention group before treatment; D: The proportions of patients with CTP grades A, B, and C in the nonintervention group after treatment; E: The probability of recurrence of ascites in the intervention and nonintervention groups. CTP: Child-Turcotte-Pugh.
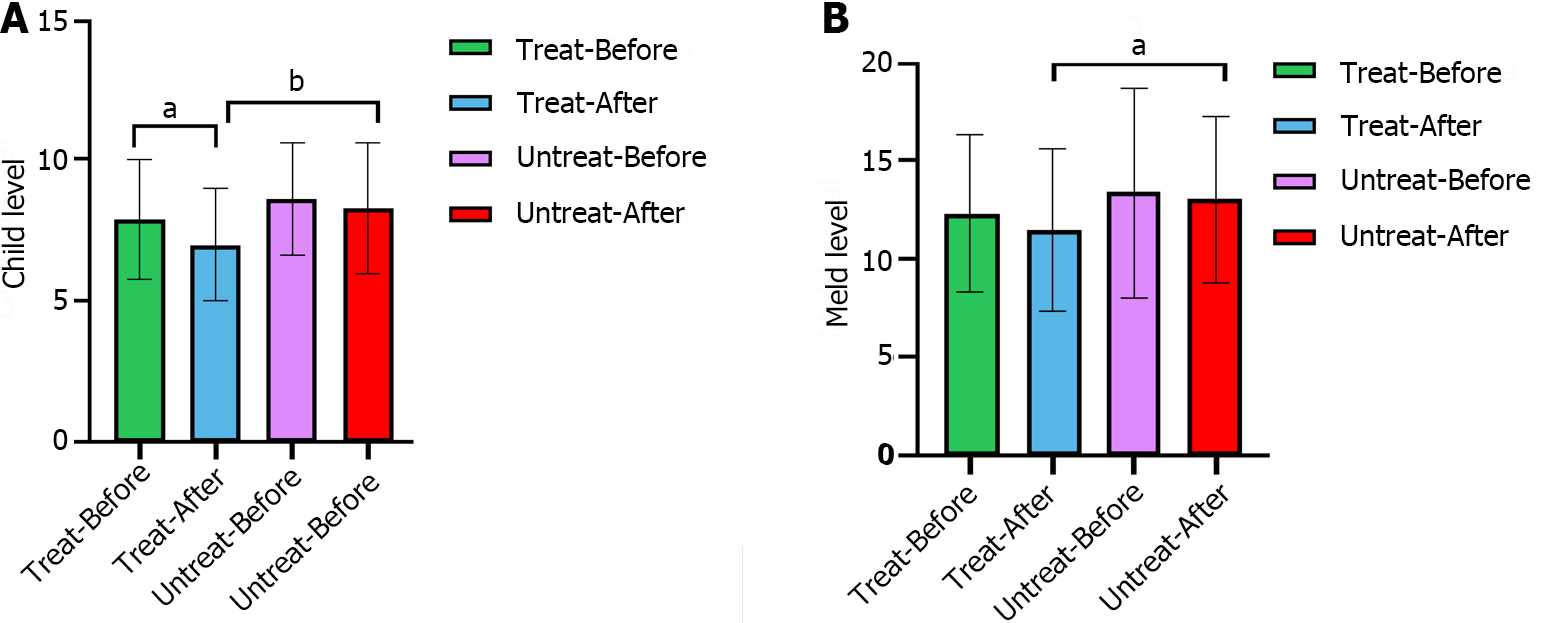
Figure 2 Comparison of liver function indices between the intervention and nonintervention groups before and after treatment.
A: A comparison of Child-Turcotte-Pugh grades between the two groups; B: A comparison of Model for End-Stage Liver Disease scores between the two groups. aP < 0.01, bP < 0.001.
Figure 3 Comparison of inflammatory indices between the intervention and nonintervention groups before and after treatment.
A: A comparison of C-reactive protein levels between the two groups; B: A comparison of endotoxin levels between the two groups; C: A comparison of the prognostic index between the two groups. aP < 0.001, bP < 0.01. CRP: C-reactive protein; PI: prognostic index.
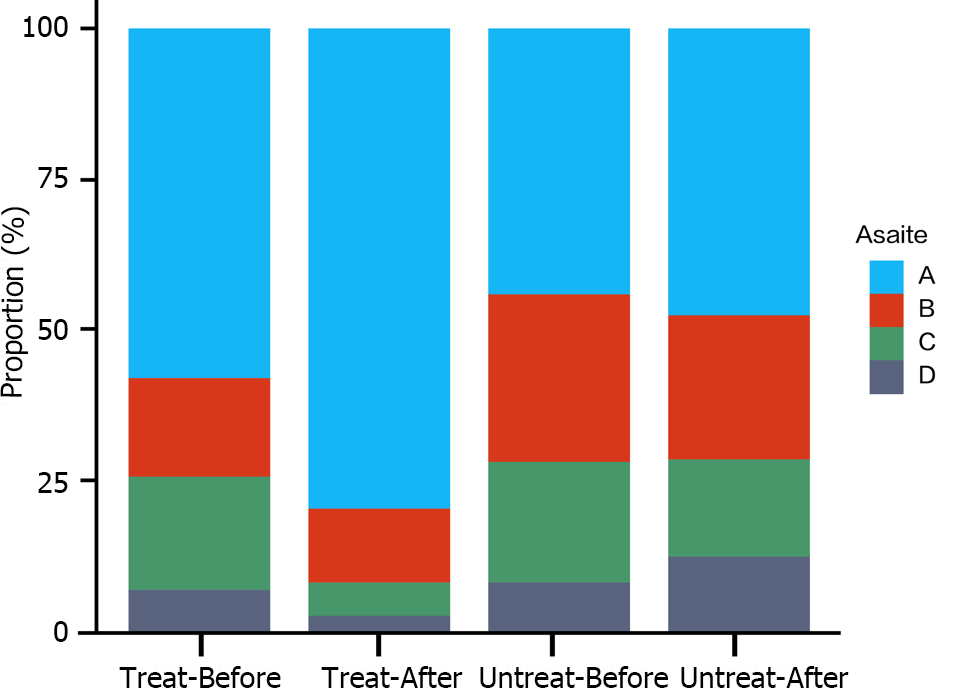
Figure 4 Occurrence of ascites before and after treatment in the intervention and non-intervention groups.
A: No ascites; B: Small ascites; C: Moderate ascites; D: Large ascites.
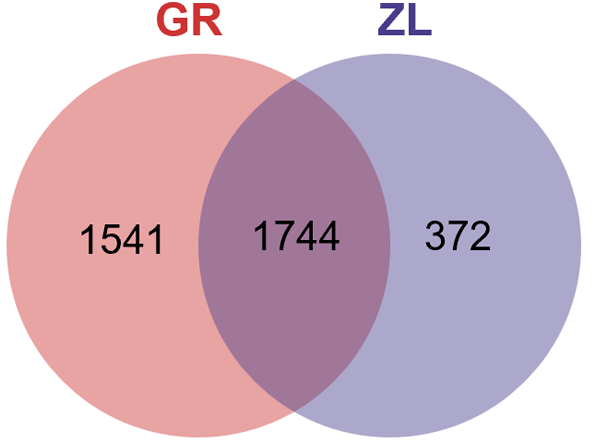
Figure 5 Venn analysis of the distribution of operational taxonomic units.
GR: Before treatment with Lactobacillus paracasei N1115 (LP N1115); ZL: 3 months after treatment with LP N1115.
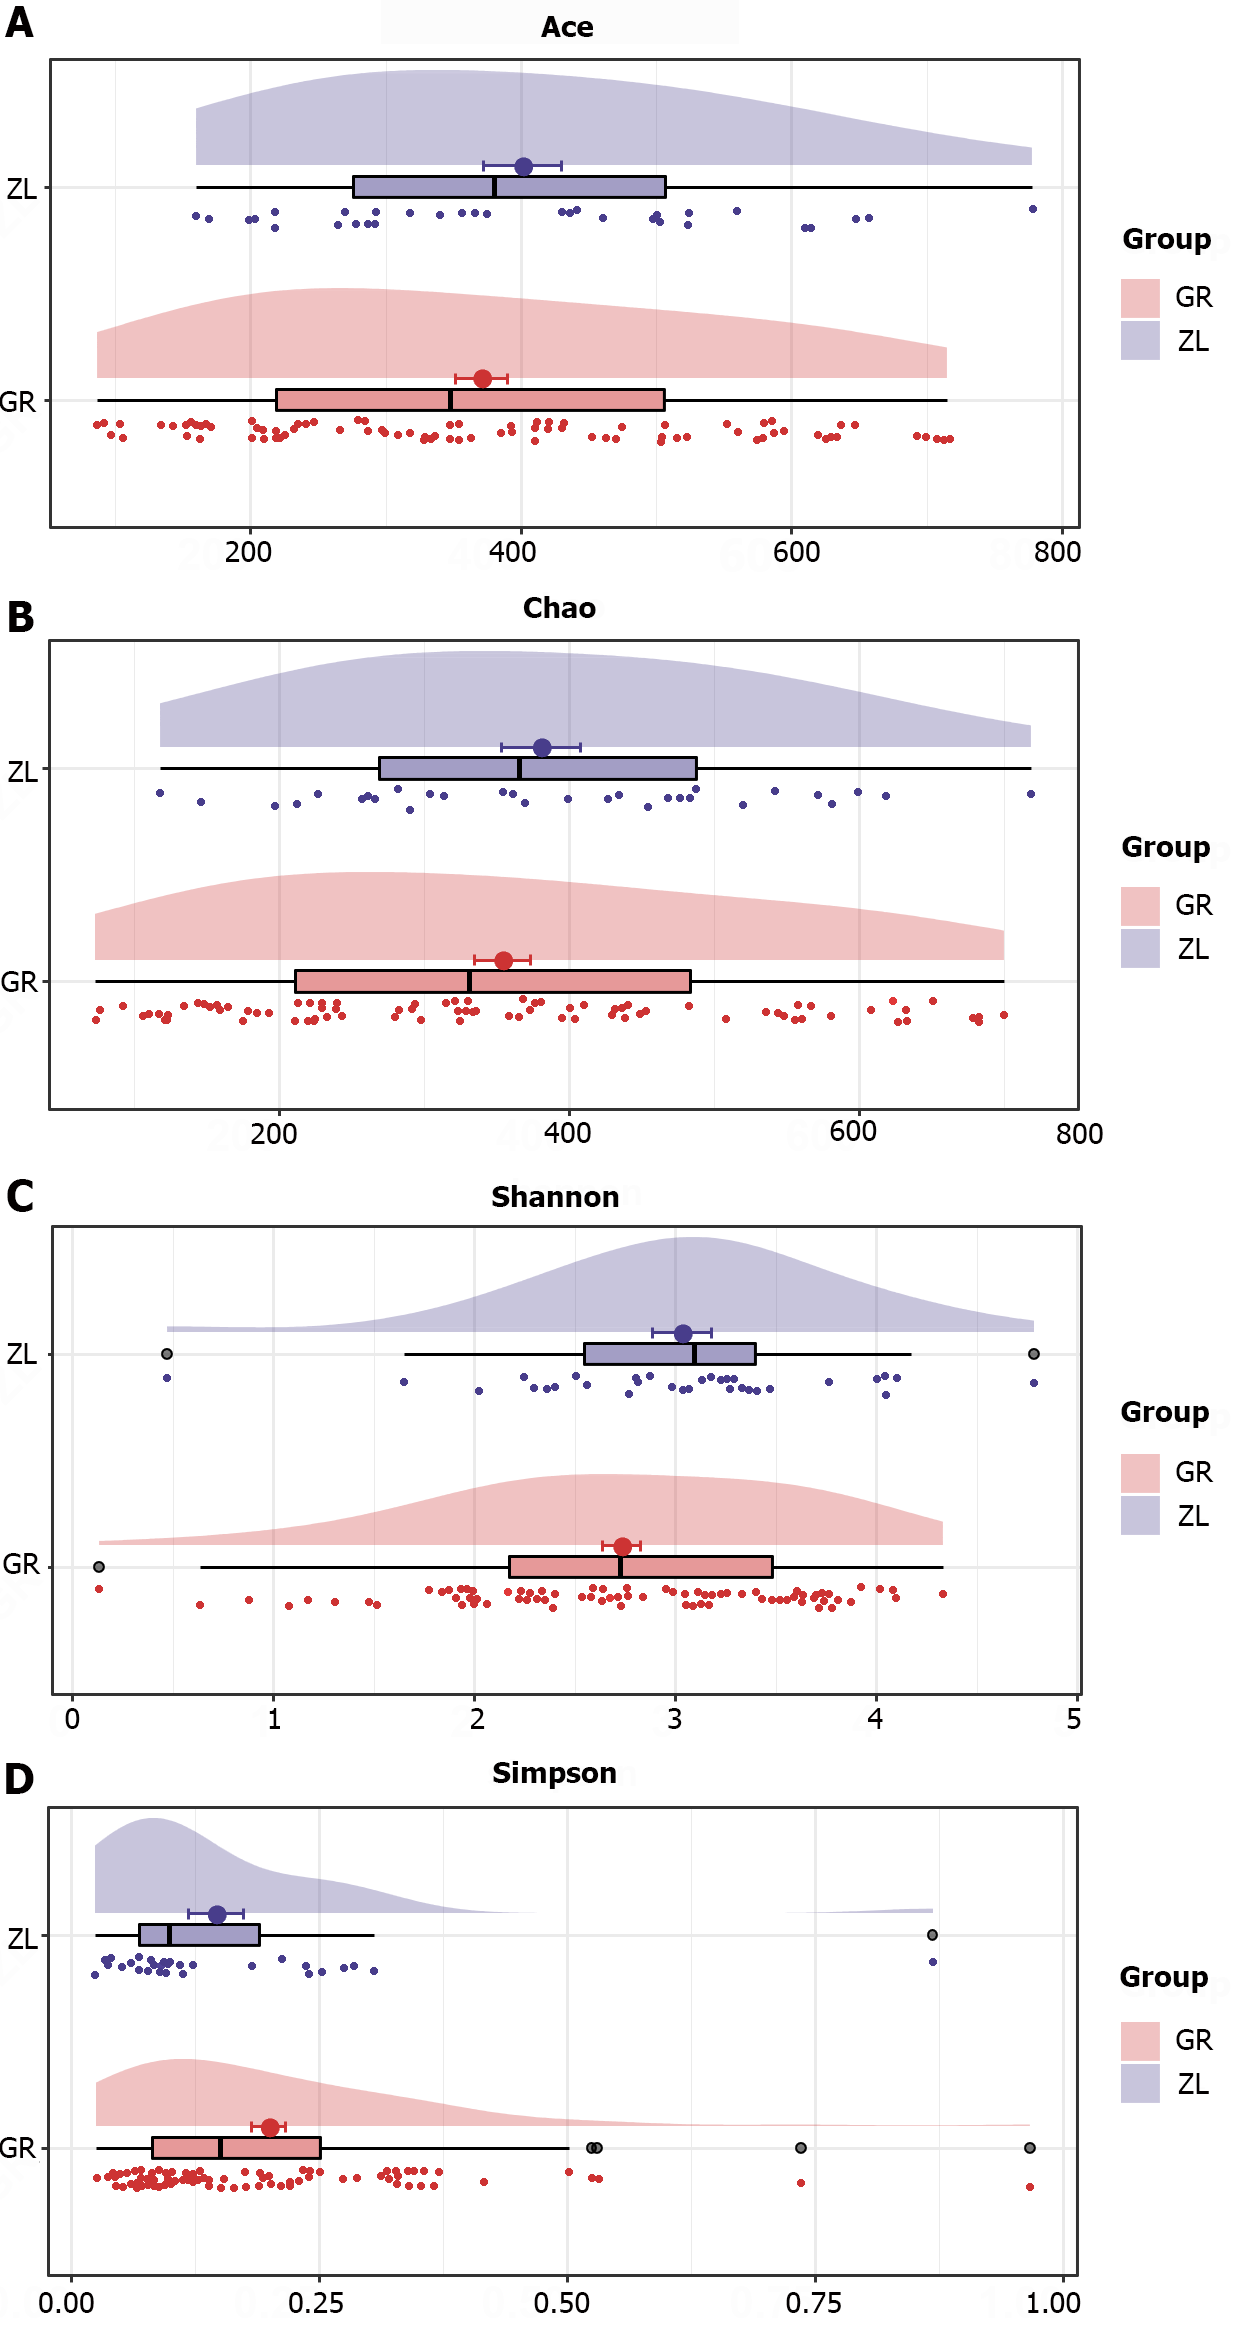
Figure 6 Comparison of gut microbiota abundance and diversity before and after intervention in patients.
A: Differences in the Ace index between groups; B: Differences in the Chao index between groups; C: Differences in the Shannon index between groups; D: Differences in the Simpson index between groups. GR: Before treatment with Lactobacillus paracasei N1115 (LP N1115); ZL: 3 months after treatment with LP N1115.
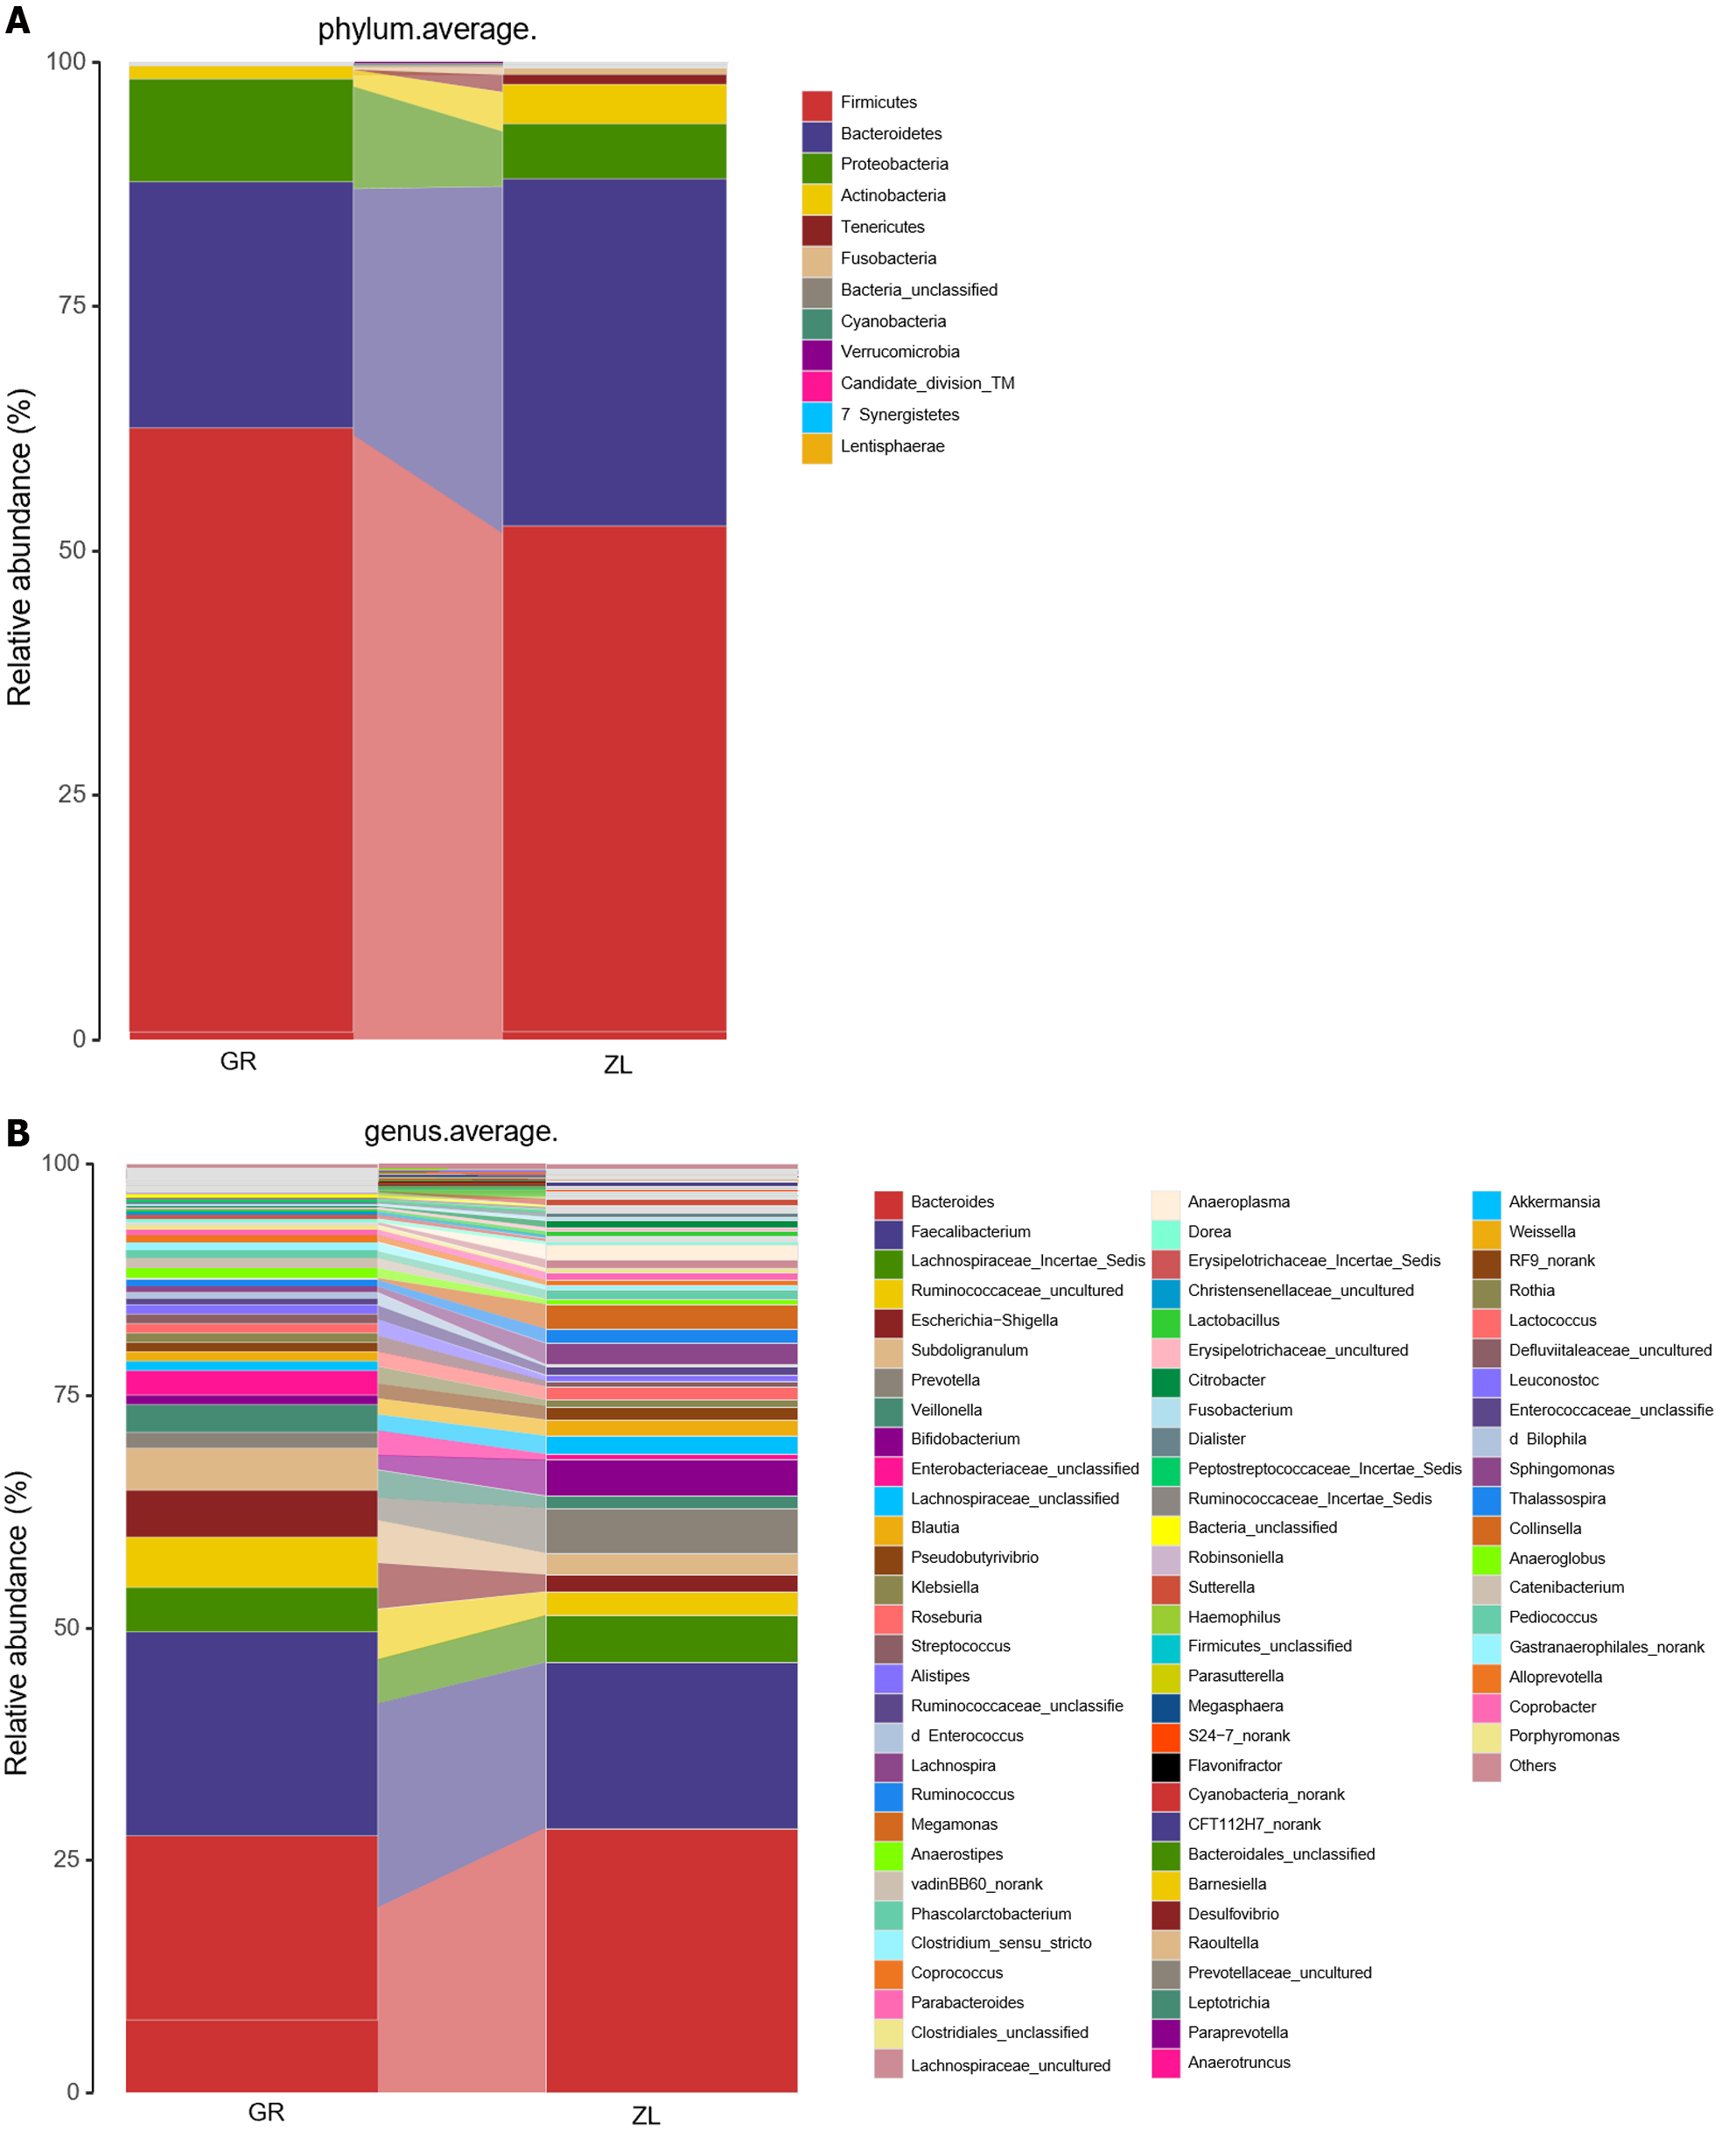
Figure 7 Plots of the relative abundance of the gut microbiota at the phylum and genus levels before and after treatment in all patients.
A: Plots of the relative abundance of the gut microbiota at the phylum levels before and after treatment in all patients; B: Plots of the relative abundance of gut microbiota at the genus levels before and after treatment in all patients. GR: Before treatment with Lactobacillus paracasei N1115 (LP N1115); ZL: 3 months after treatment with LP N1115.
Figure 8 Histogram of linear discriminant analysis effect size distribution; evolutionary subplots were analyzed.
A: Histogram of linear discriminant analysis effect size distribution; The evolutionary subplots were analyzed. TLEfse analyzed the LDA histogram; B: Histogram of linear discriminant analysis effect size distribution; The evolutionary subplots were analyzed. LEfse analyzed LDA evolutionary cladistics. GR: Before treatment with Lactobacillus paracasei N1115 (LP N1115); ZL: 3 months after treatment with LP N1115.
- Citation: Hu YC, Ding XC, Liu HJ, Ma WL, Feng XY, Ma LN. Effects of Lactobacillus paracasei N1115 on gut microbial imbalance and liver function in patients with hepatitis B-related cirrhosis. World J Gastroenterol 2024; 30(11): 1556-1571
- URL: https://www.wjgnet.com/1007-9327/full/v30/i11/1556.htm
- DOI: https://dx.doi.org/10.3748/wjg.v30.i11.1556


