Copyright
©The Author(s) 2024.
World J Gastroenterol. Mar 14, 2024; 30(10): 1420-1430
Published online Mar 14, 2024. doi: 10.3748/wjg.v30.i10.1420
Published online Mar 14, 2024. doi: 10.3748/wjg.v30.i10.1420
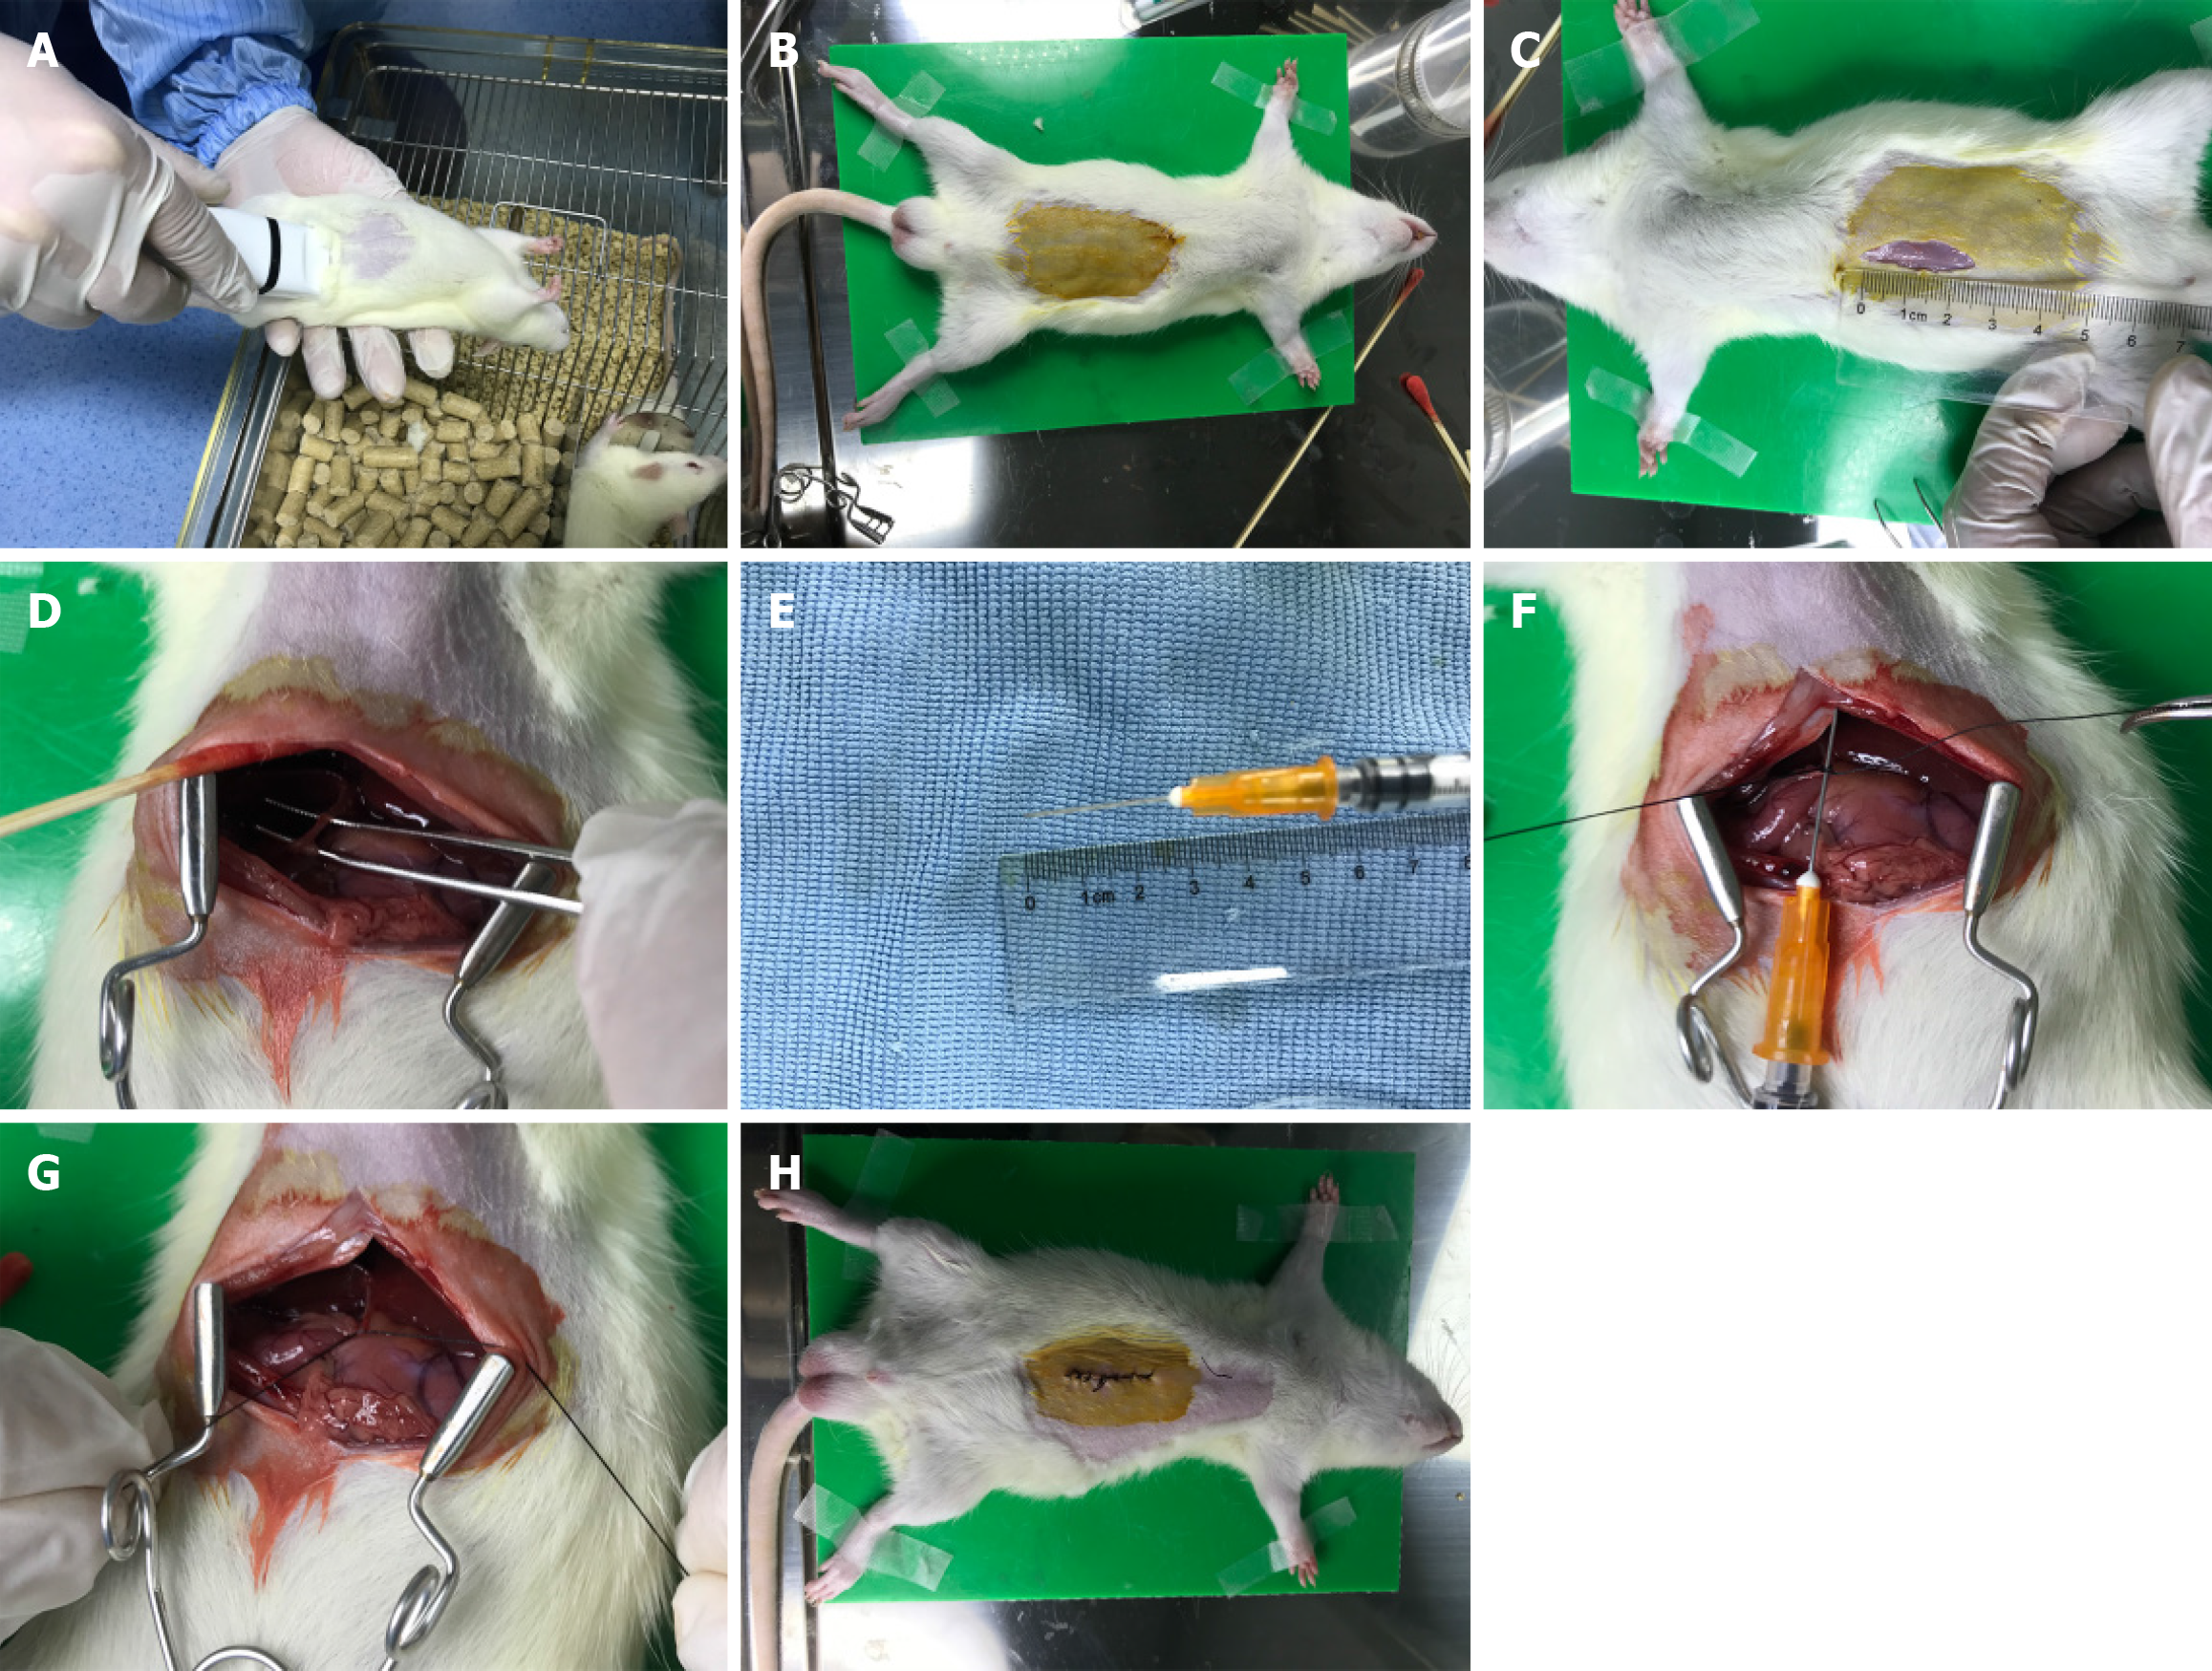
Figure 1 Surgical procedures of partial ligation of the bile duct of juvenile rats.
A: Anesthesia: 2.5% pentobarbital sodium (0.25 mL/100 g) was injected into the abdominal cavity; B: Positioning: After anesthesia, the rats were fixed with a supine position; C: Skin preparation: The hair was removed to expose about 5 cm × 3 cm of skin, followed by iodine disinfection; D: Bile duct isolation: The bile duct was located with forceps; E and F: Partial ligation: Place a 1 mL needle parallel to the bile duct and use 6-0 absorbable suture to ligate the bile duct and needle; G: Remove: The needle was removed after partial ligation; H: Closure of the incision: After ligation, and the incision was intermittently sutured.
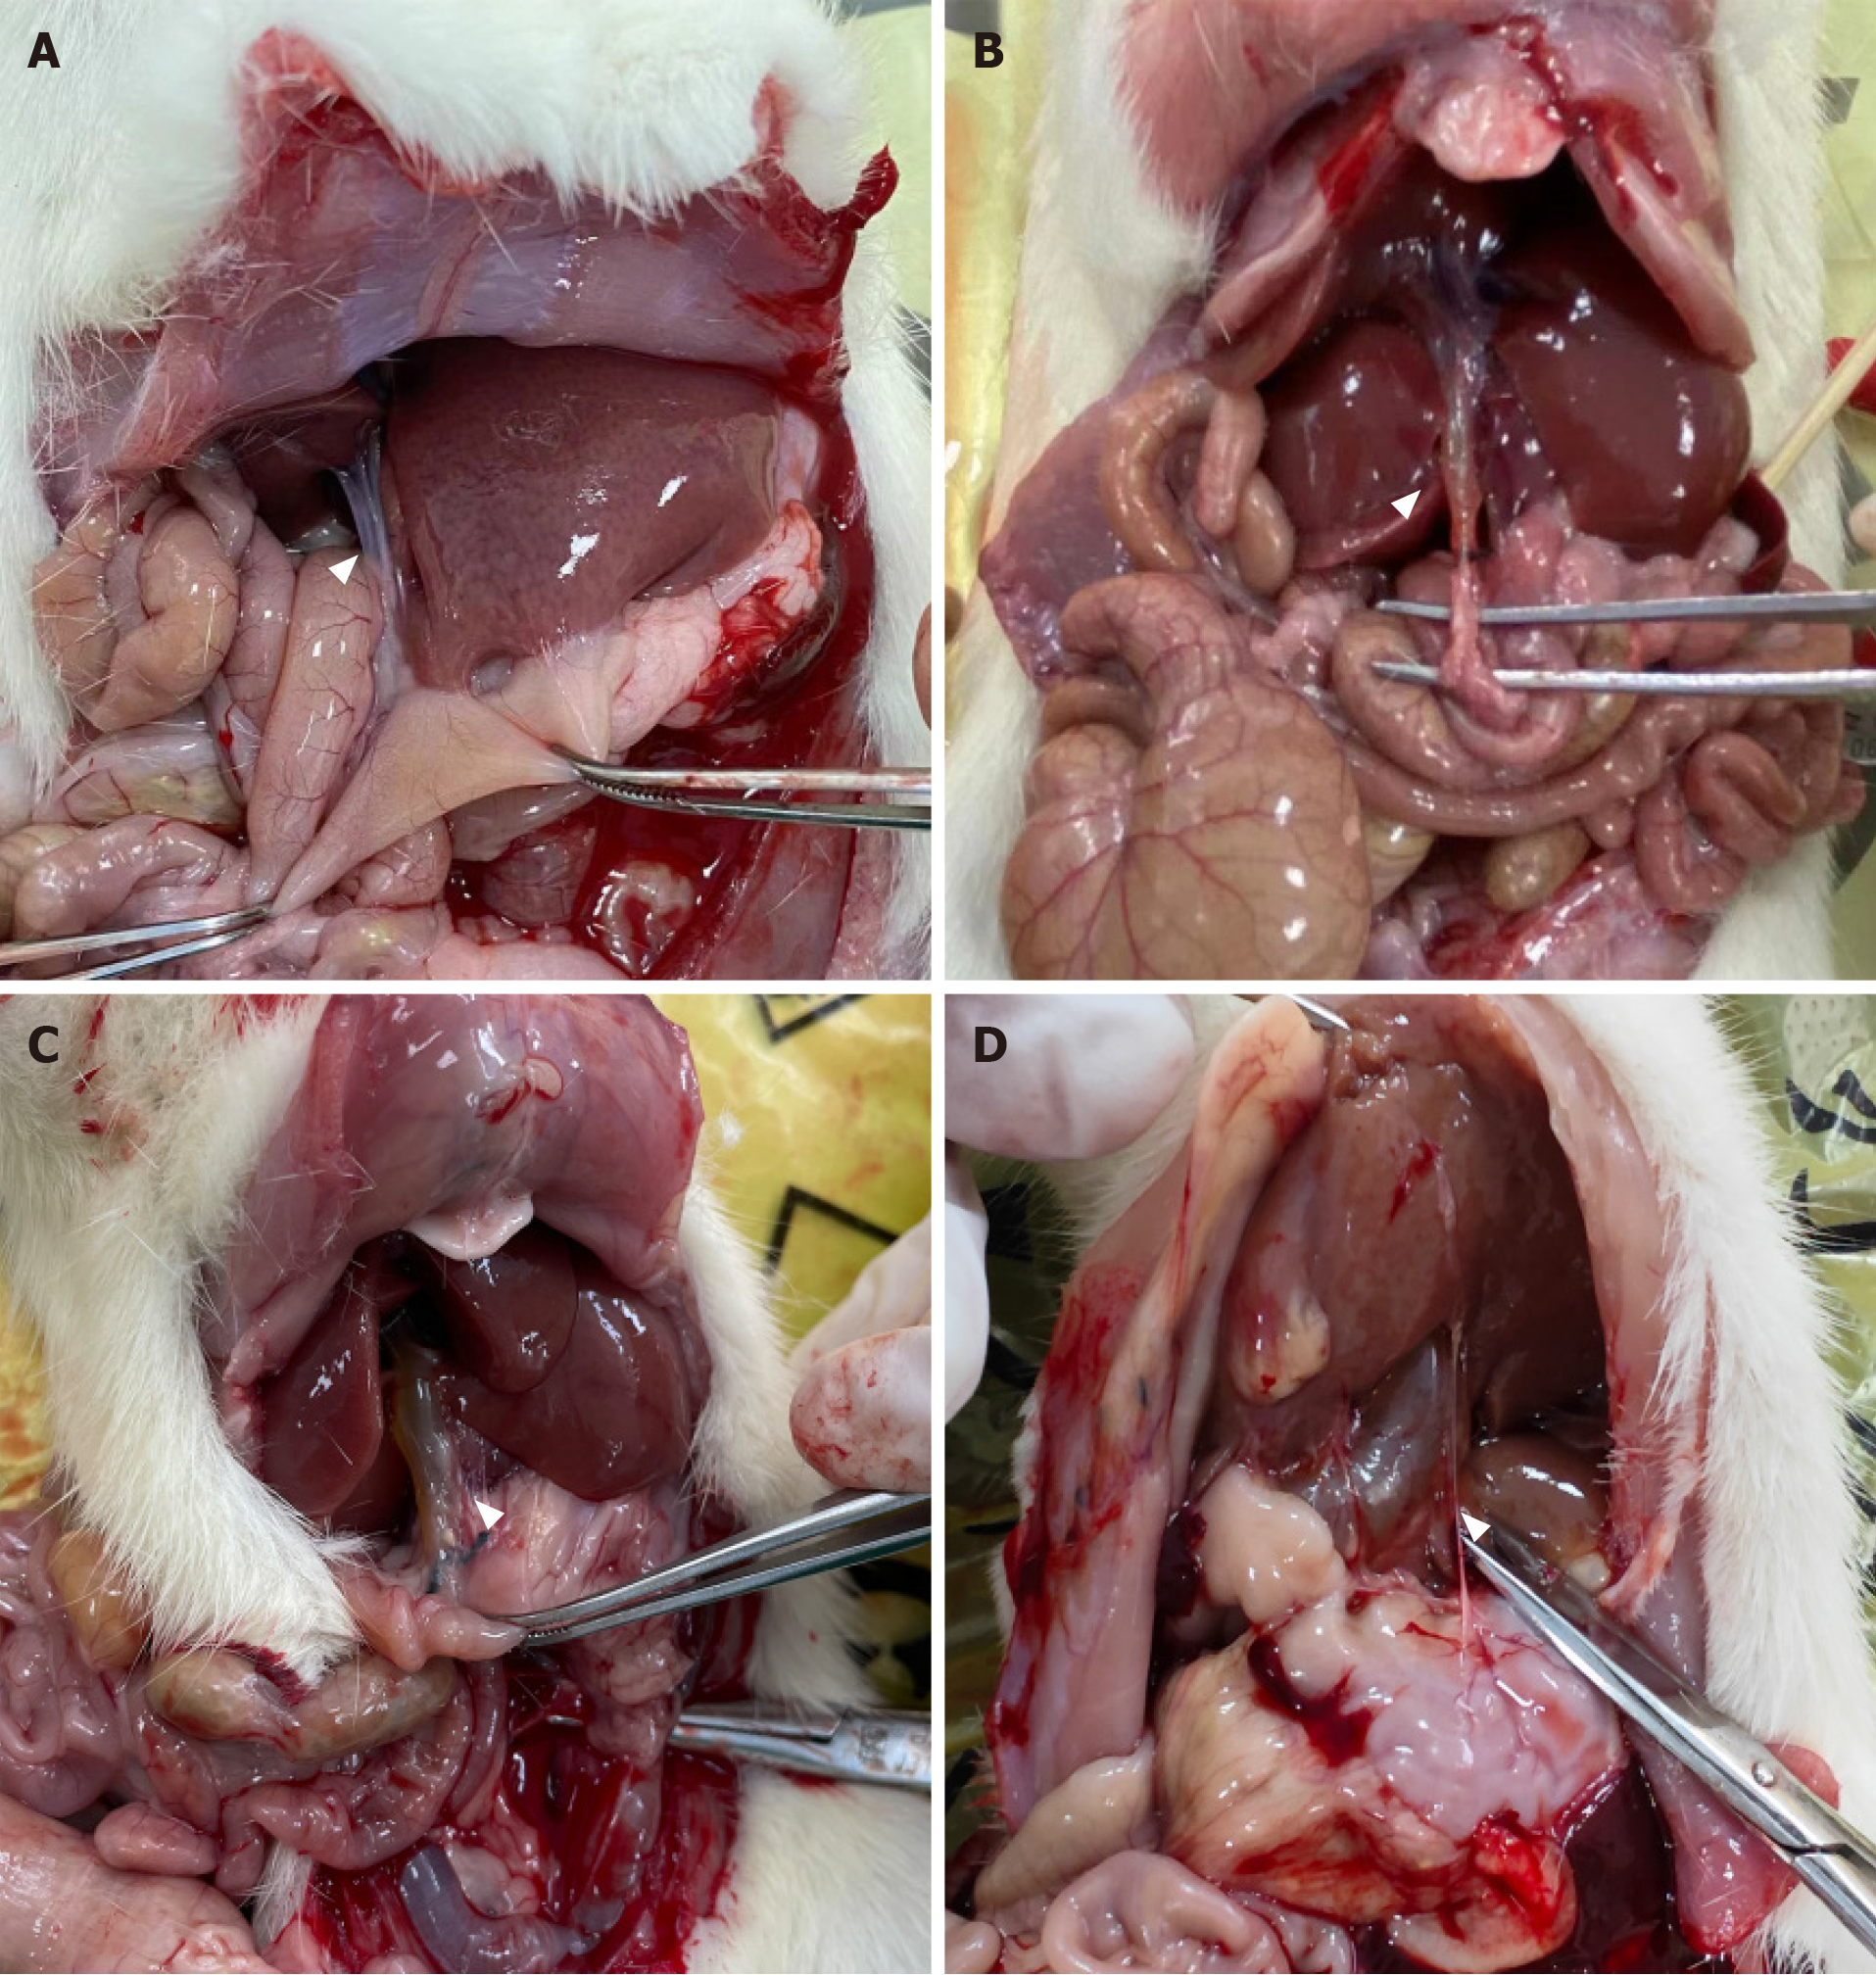
Figure 2 Representative pictures of dilated bile ducts.
A: No dilation of the bile duct; B: Mild dilation of the bile duct; C: Moderate dilation of the bile duct; D: Severe dilation of the bile duct.
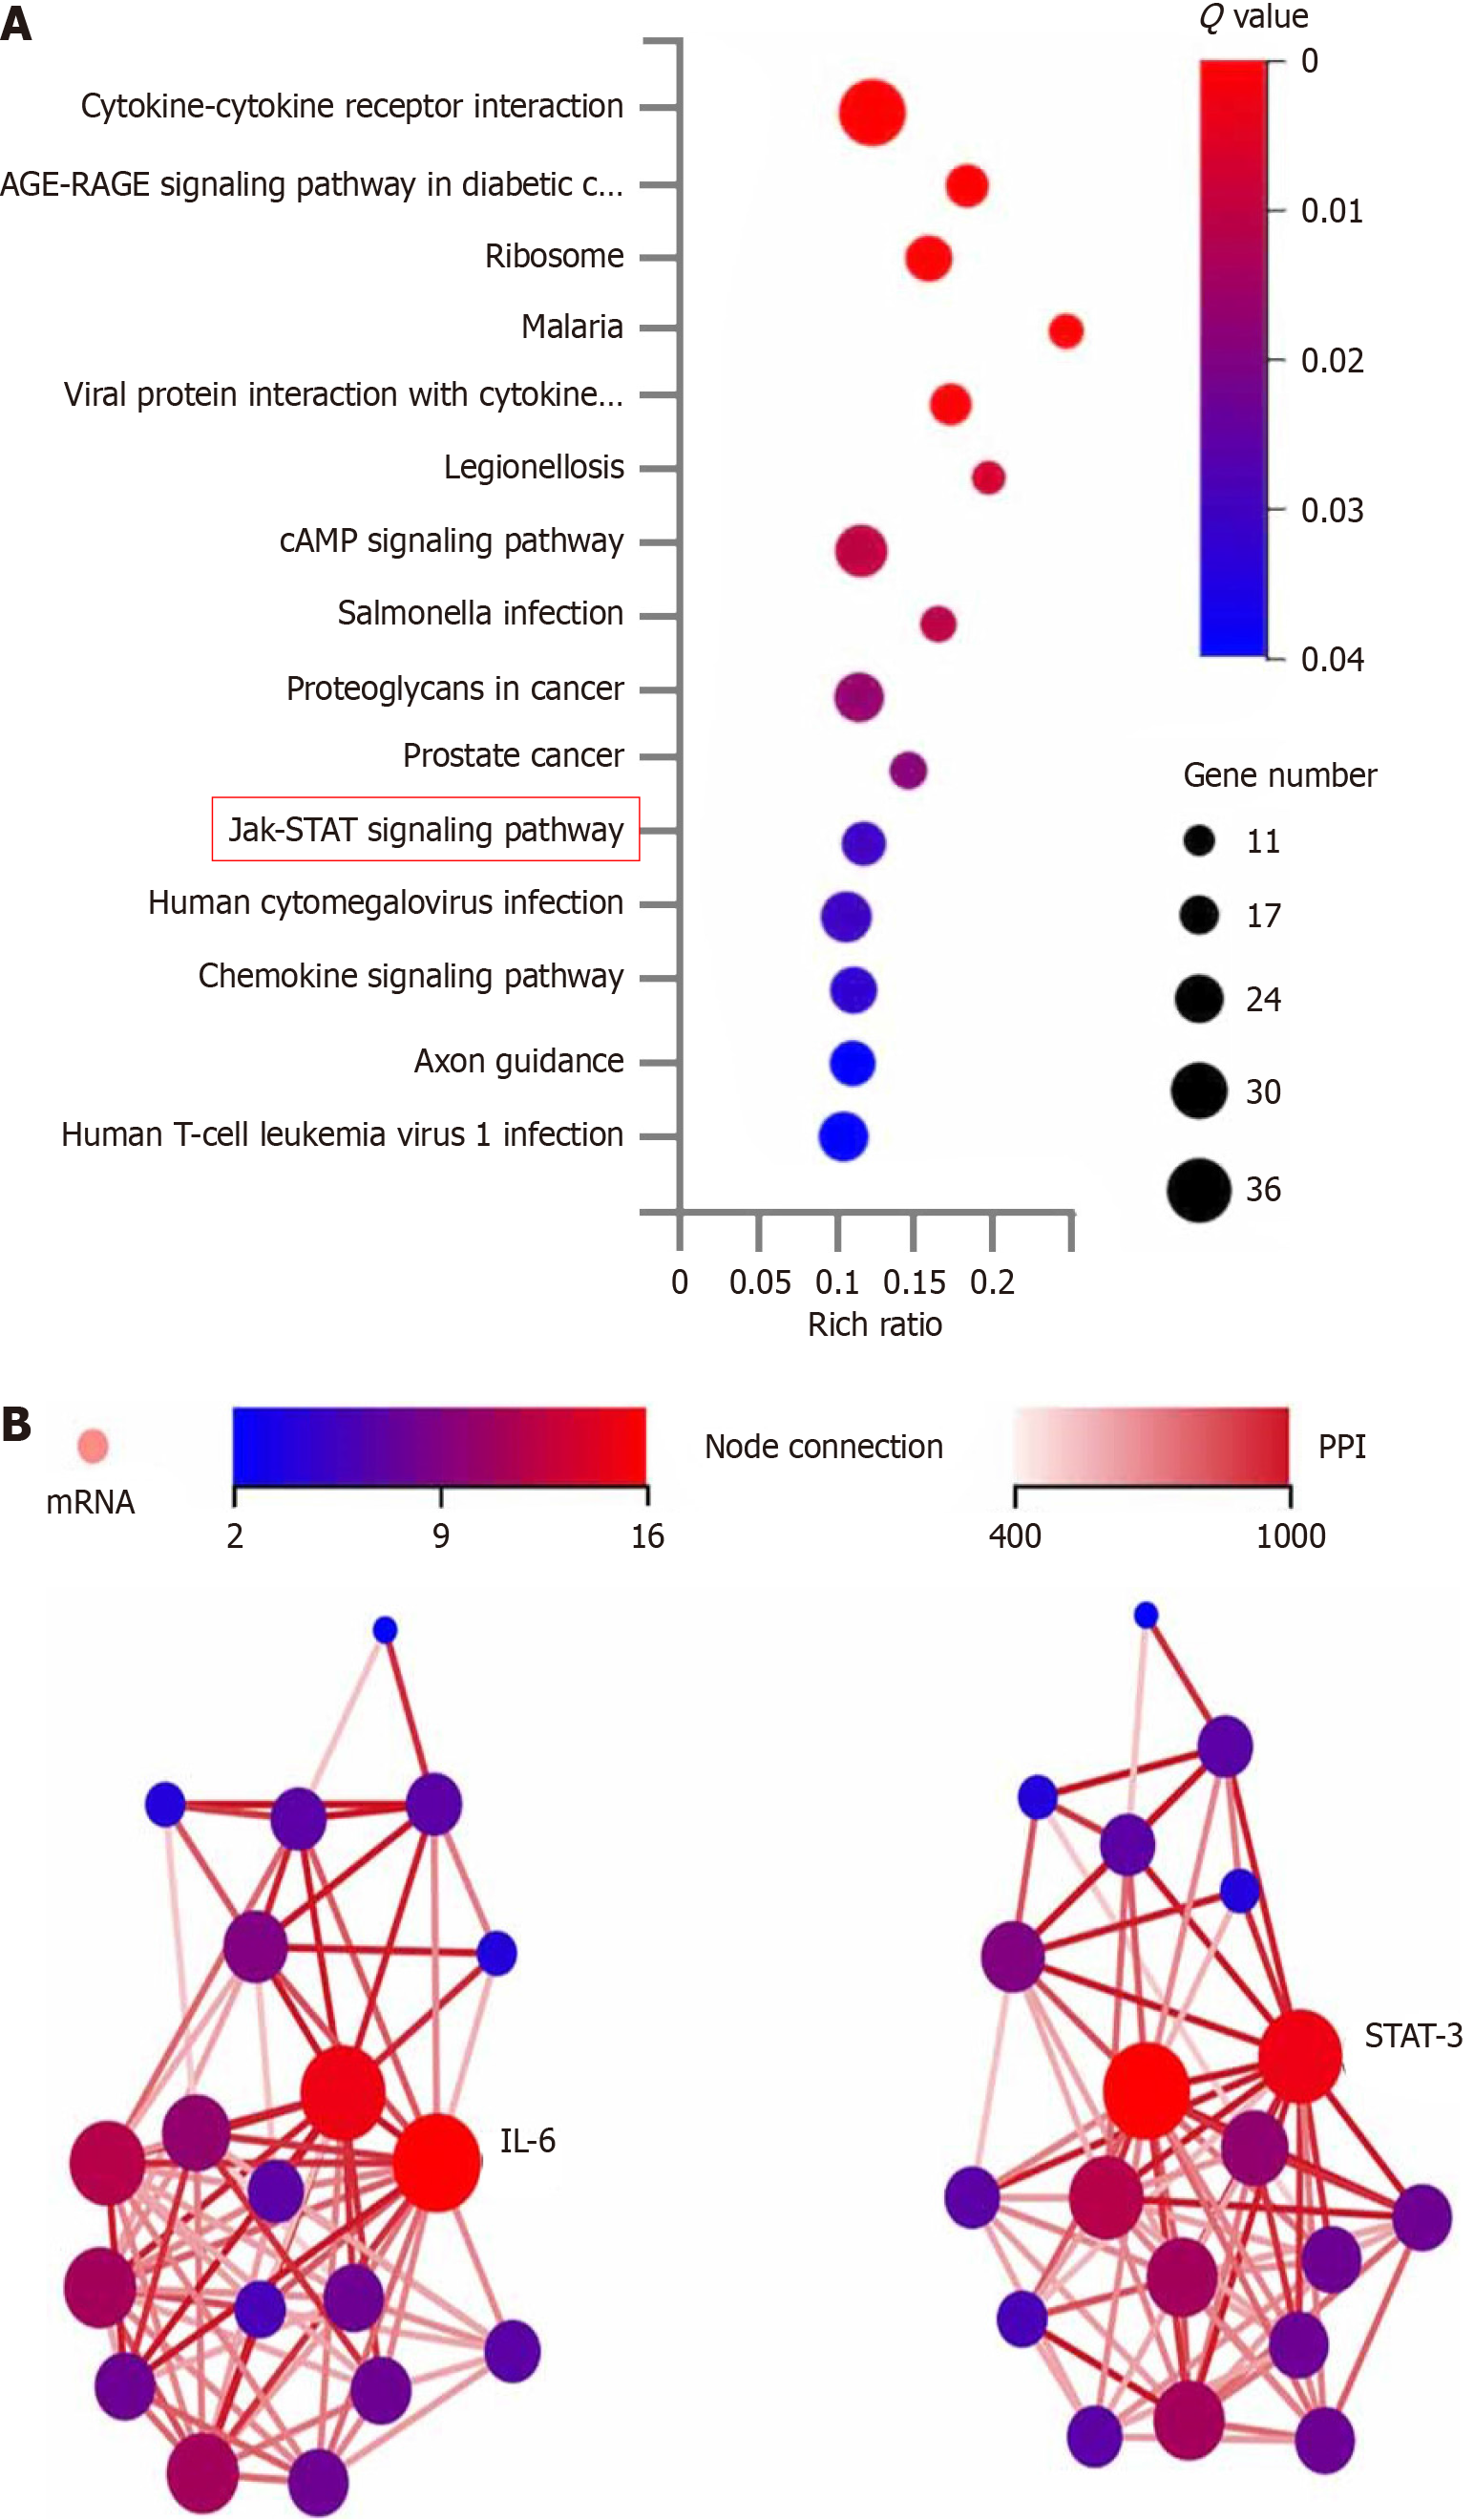
Figure 3 Analysis of differentially expressed genes in human tissues.
A: Enrichment analysis of the differentially expressed genes (DEGs) by KEGG pathway; B: Protein interaction network analysis of the 19 DEGs in the JAK-STAT signaling pathway. IL: Interleukin; PPI: Protein interaction; STAT3: Signal transducer and activator of transcription 3.
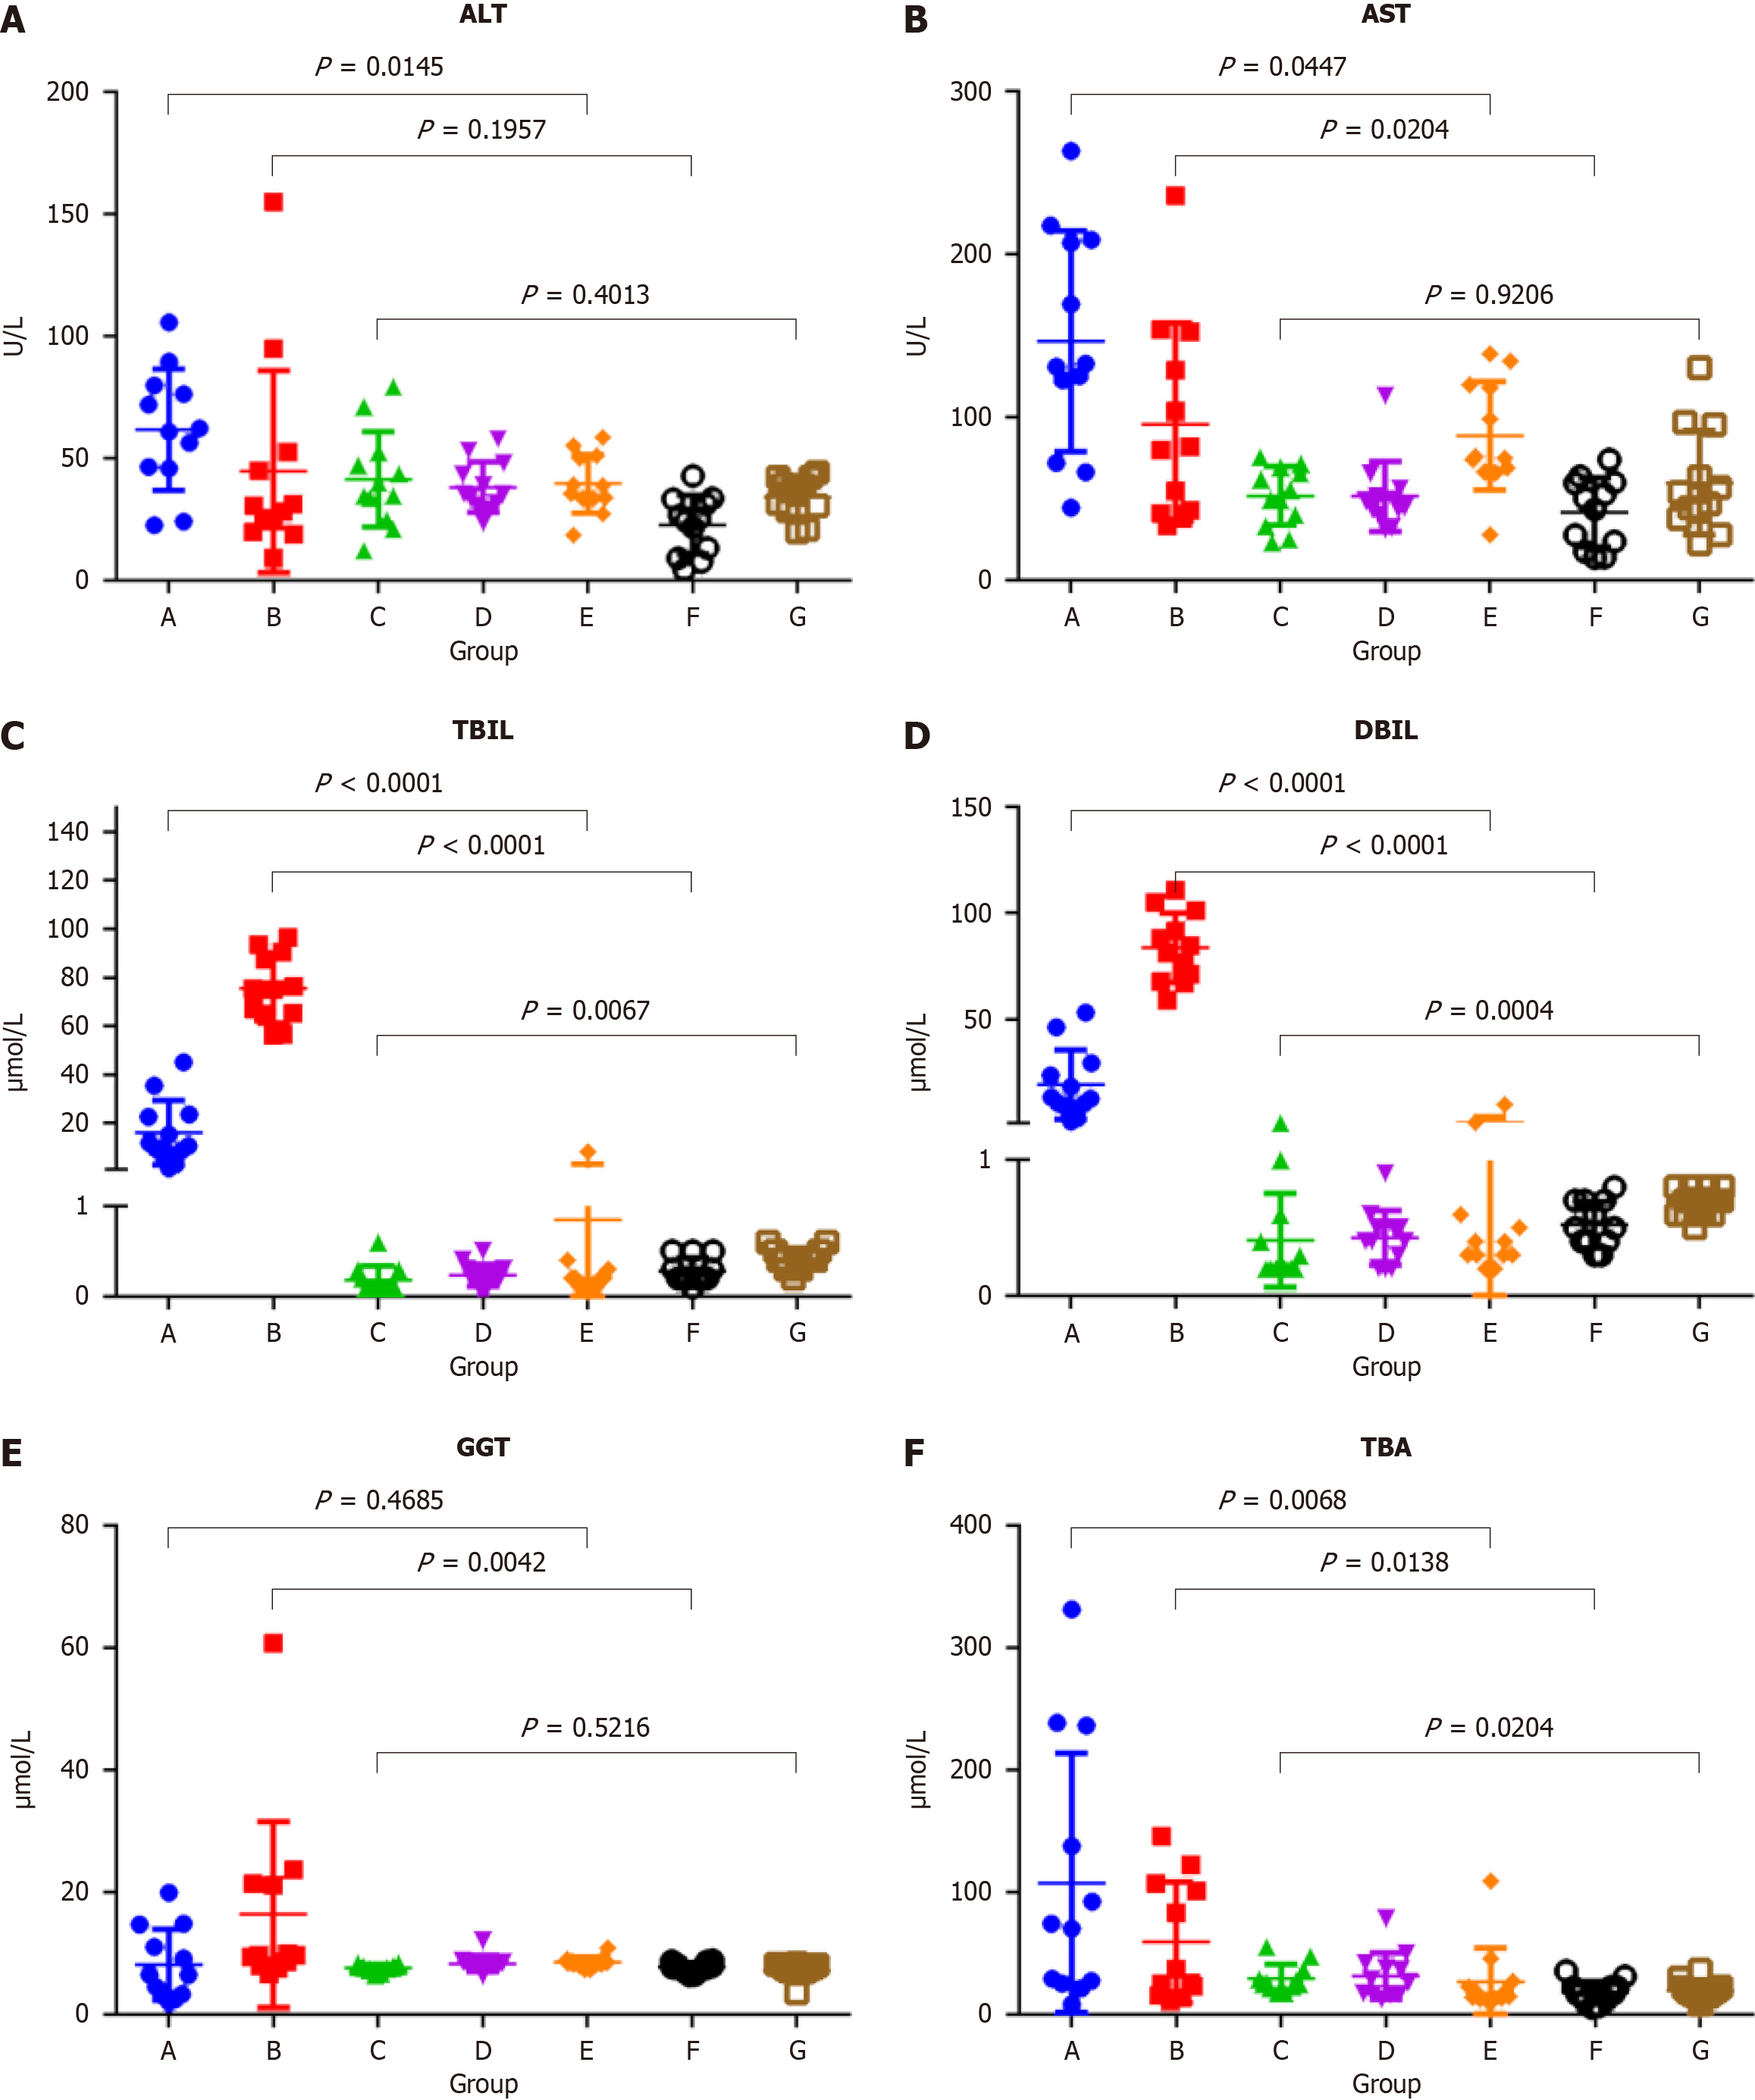
Figure 4 Comparison of biochemical indices levels in each group.
A: Alanine aminotransferase; B: Aspartate aminotransferase; C: Total bilirubin; D: Direct bilirubin; E: Gamma-glutamyltransferase; F: Total bile acids. ALT: Alanine aminotransferase; AST: Aspartate aminotransferase; TBIL: Total bilirubin; DBIL: Direct bilirubin; GGT: Gamma-glutamyltransferase; TBA: Total bile acids.
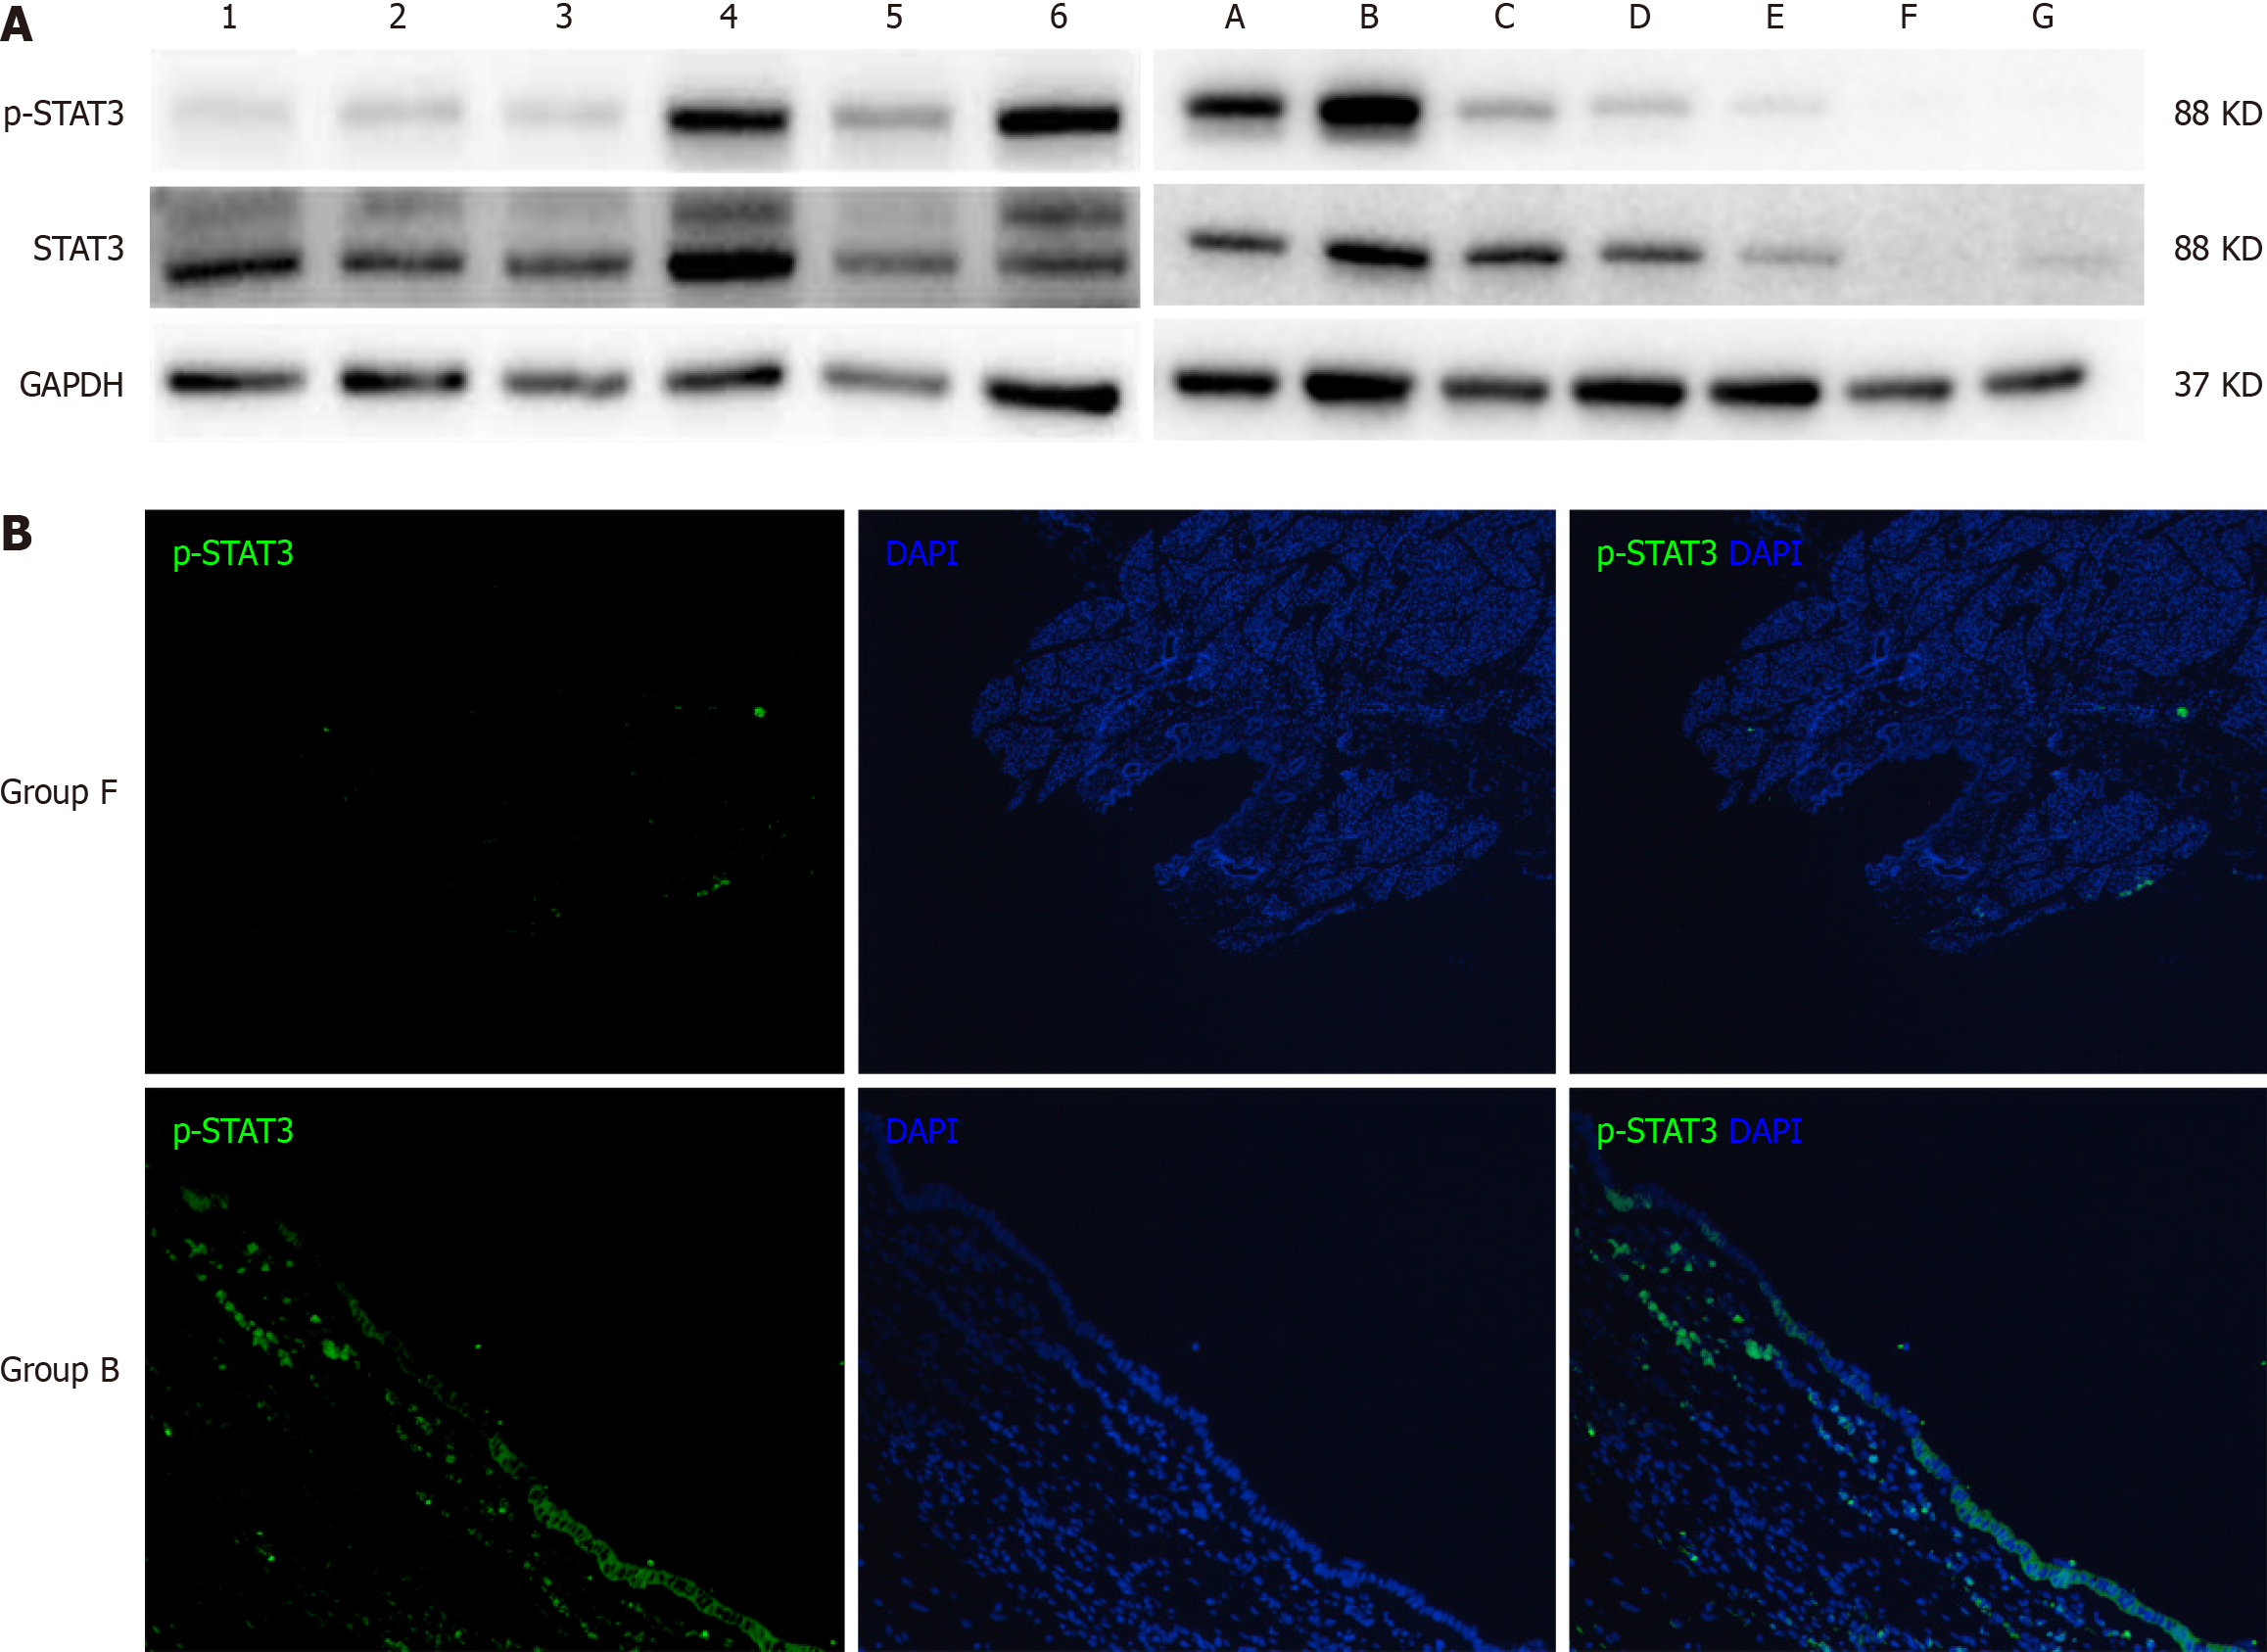
Figure 5 Western blot and immunofluorescence histochemical analyses for human and rats’ tissues.
A: The western blot results for human bile duct tissues were on the left, numbers 1, 2, and 3 represent fusiform choledochal cysts (CCs), while numbers 4, 5, and 6 represent cystic CCs. The western blot results for rat bile duct tissues were on the right, representative picture of each group (group A-group G) was shown; B: The representative picture of the expression of phosphorylated signal transducer and activator of transcription 3 protein in group B and group F. STAT3: Signal transducer and activator of transcription 3.
- Citation: Zhang SH, Zhang YB, Cai DT, Pan T, Chen K, Jin Y, Luo WJ, Huang ZW, Chen QJ, Gao ZG. Preliminary exploration of animal models of congenital choledochal cysts. World J Gastroenterol 2024; 30(10): 1420-1430
- URL: https://www.wjgnet.com/1007-9327/full/v30/i10/1420.htm
- DOI: https://dx.doi.org/10.3748/wjg.v30.i10.1420


