Copyright
©The Author(s) 2024.
World J Gastroenterol. Mar 14, 2024; 30(10): 1405-1419
Published online Mar 14, 2024. doi: 10.3748/wjg.v30.i10.1405
Published online Mar 14, 2024. doi: 10.3748/wjg.v30.i10.1405
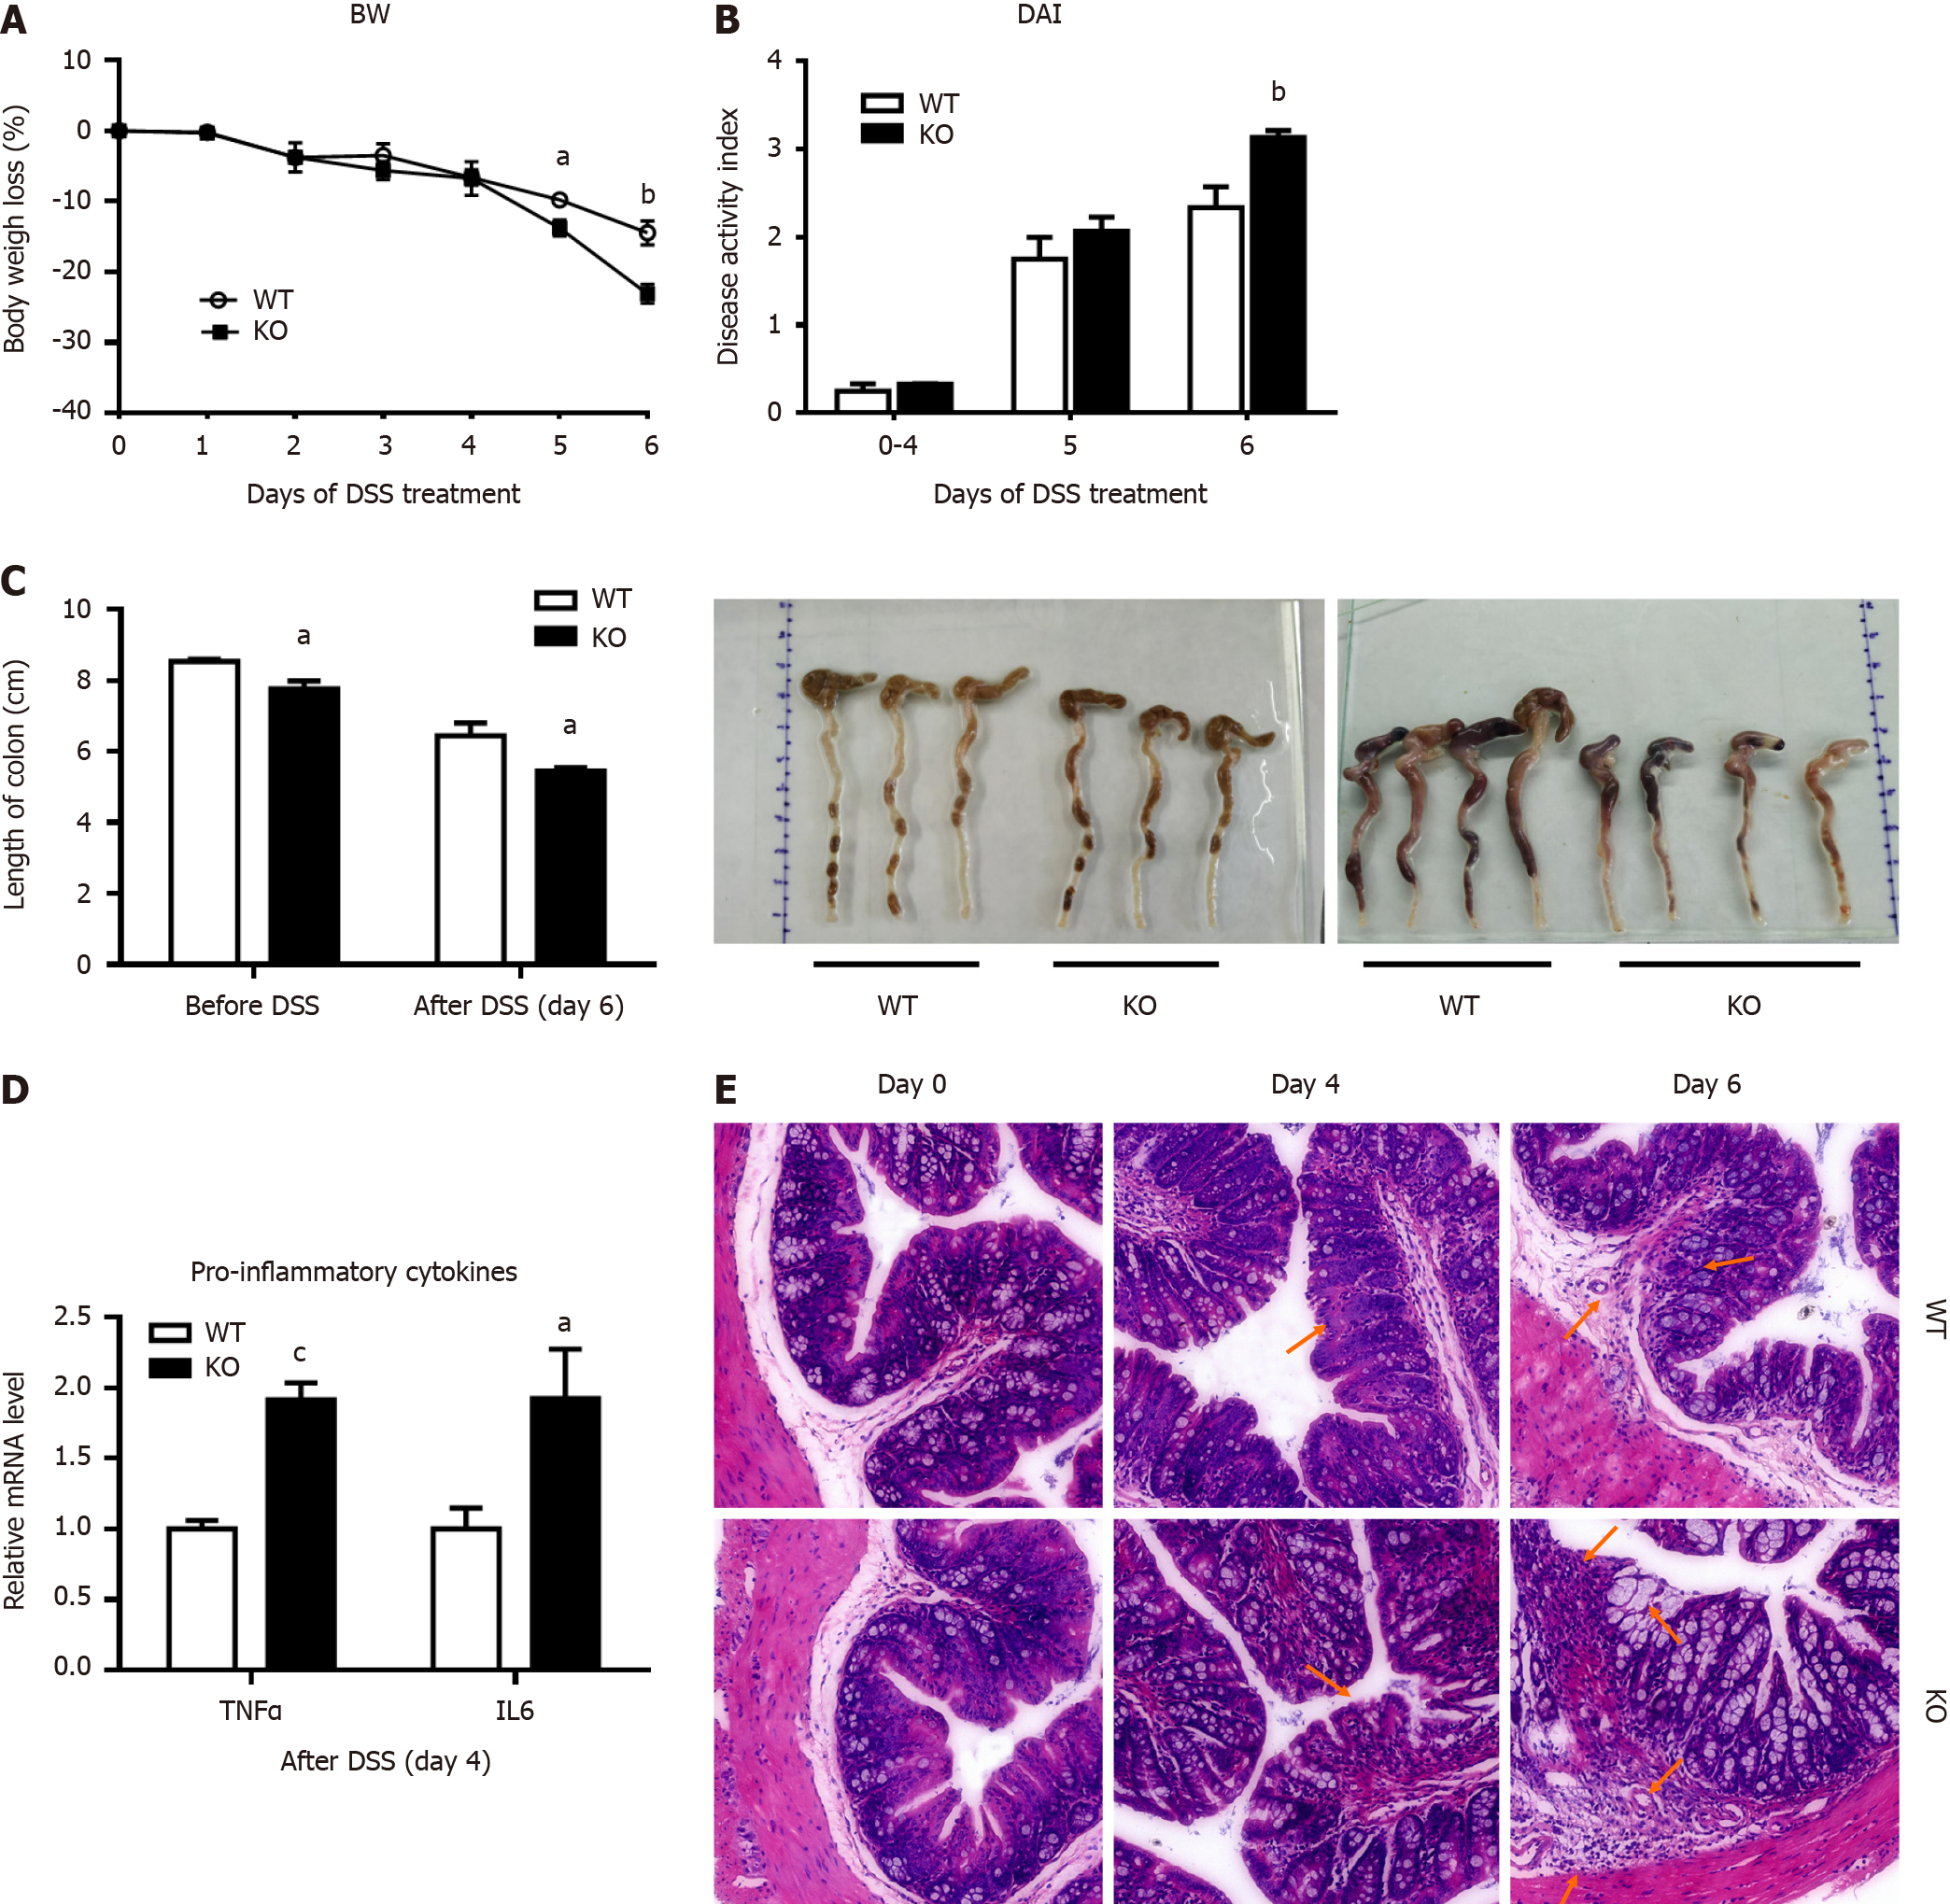
Figure 1 Alkaline sphingomyelinase deficiency exacerbates dextran sulfate sodium-induced colitis in mice.
The mice were treated with 3% dextran sulfate sodium (DSS) in drinking water for 6 d. A: Body weight (BW) was measured, and the percentage of BW loss was calculated (n = 6 per group); B: The disease activity index (DAI) was calculated according to the stool bleeding score, BW loss, stool consistency, and disease signs (n = 4 per group); C: After 6 d of DSS treatment, the colon was removed, and the length of the colon was measured (before DSS, n = 3 per group; after DSS, n = 4 per group); D: The mRNA levels of tumor necrosis factor (TNF)-alpha and interleukin (IL)-6 in colonic mucosal tissue were analyzed (n = 4 per group); E: Histopathological characterization of the colon was performed. Arrows: Decreased goblet cells; dysplastic glands; dilated congested blood vessels; destroyed mucosal layer; severe damage to the intestinal epithelium; intensive inflammatory cell infiltration to the submucosa and muscularis. aP < 0.05, bP < 0.01, cP < 0.005 compared with wild-type (WT). KO: Gene knockout.
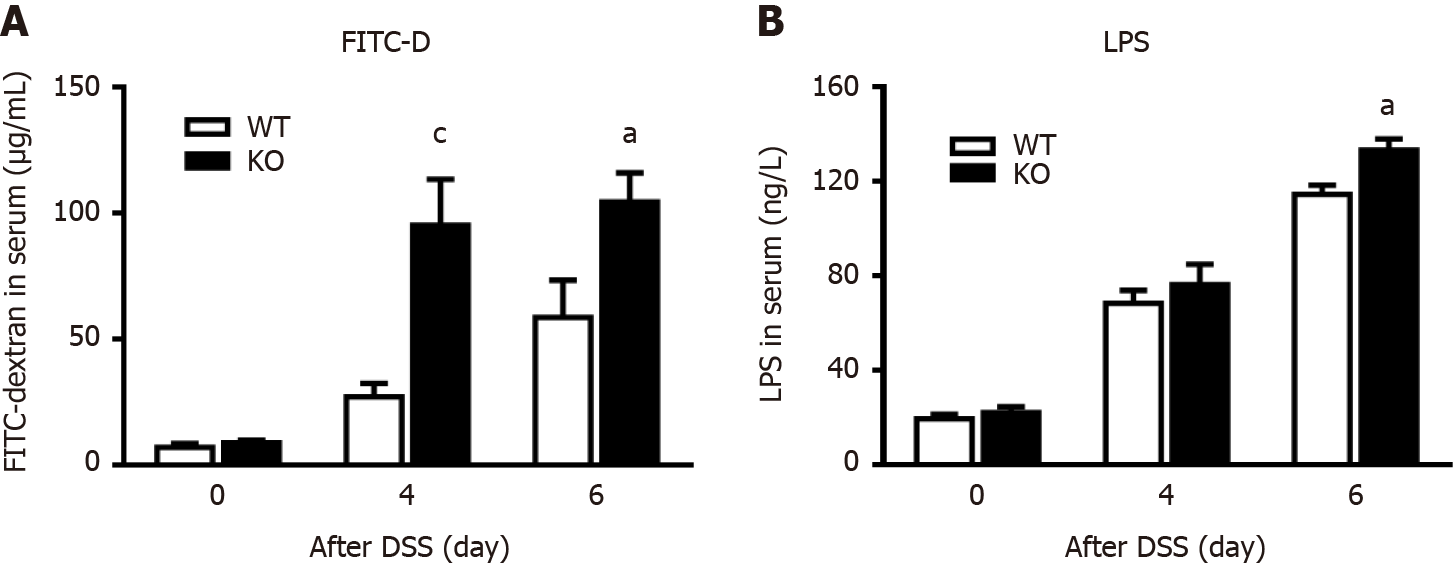
Figure 2 Alkaline sphingomyelinase deficiency increases intestinal permeability in dextran sulfate sodium-induced colitis.
The mice were treated with 3% dextran sulfate sodium (DSS) water, and blood was collected on days 0, 4, and 6. A: The mice were administered 4 kDa fluorescein isothiocyanate dextran (FITC-D) by gavage 4 h before blood sampling, after which the fluorescence intensity of FITC-D in serum was measured (n = 5-9 per group); B: Serum lipopolysaccharide (LPS) concentrations were detected on days 0, 4, and 6 after DSS treatment (n = 3 per group). aP < 0.05, cP < 0.005 compared with wild-type (WT) mice. KO: Gene knockout.
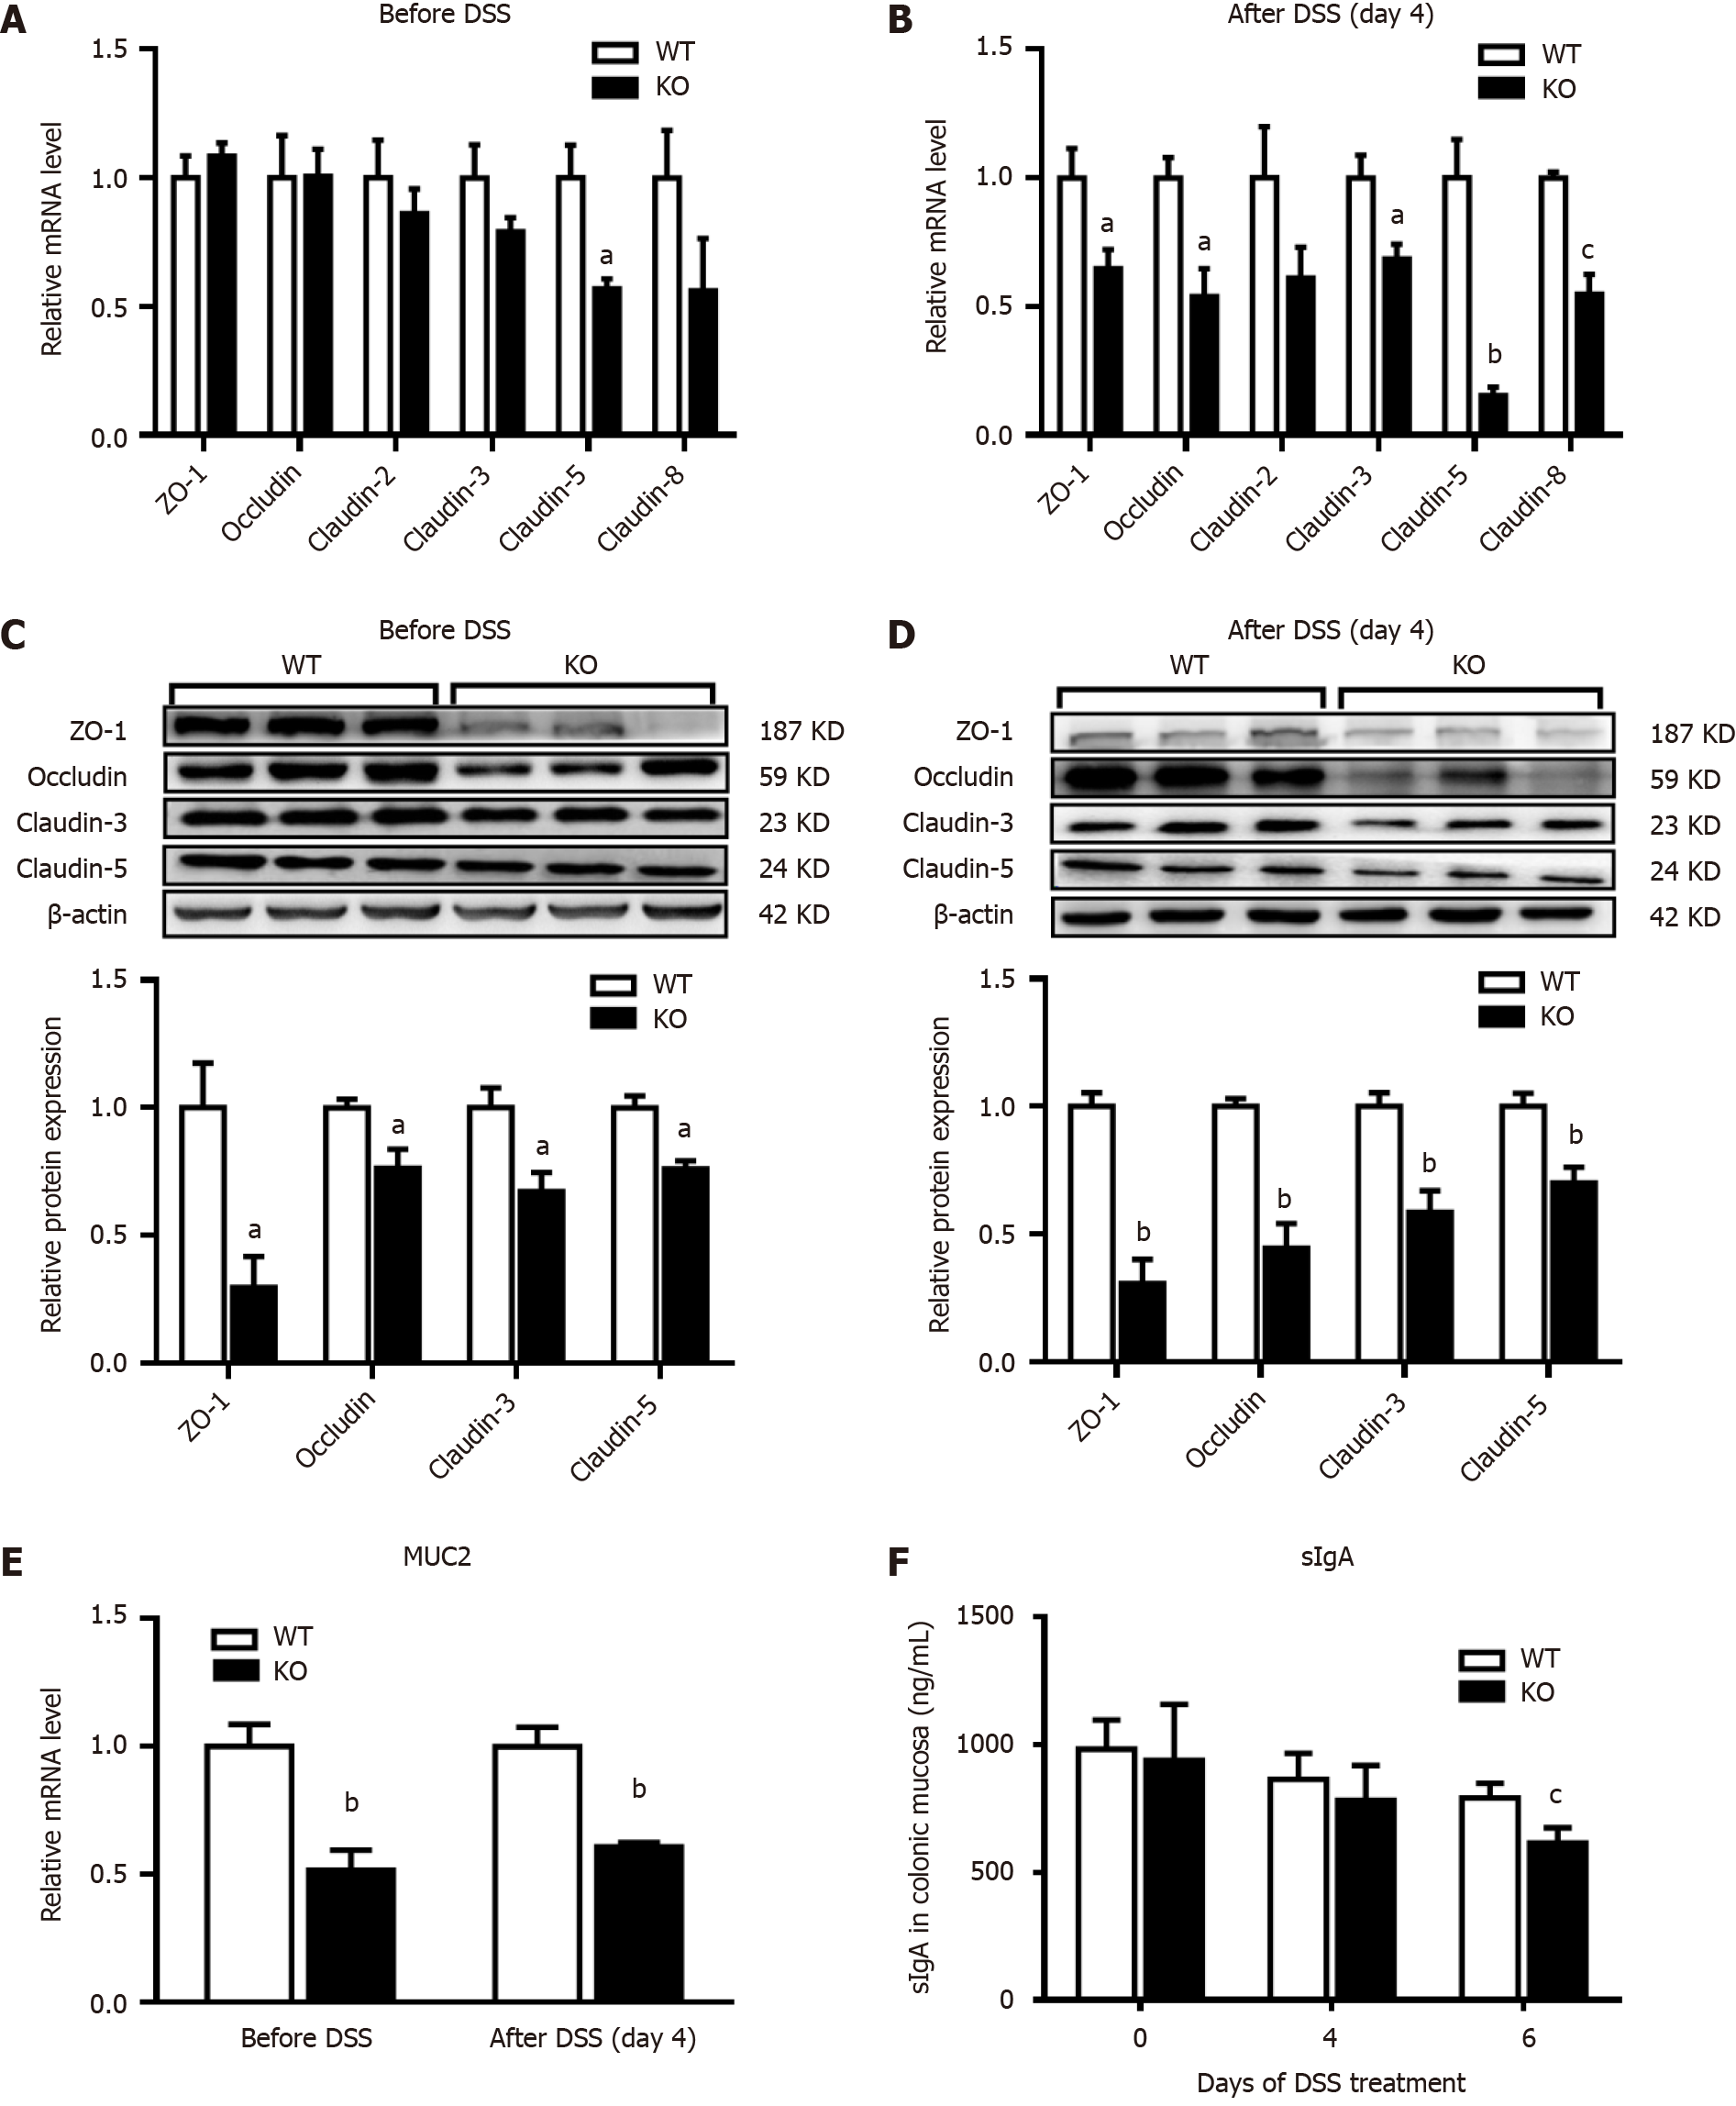
Figure 3 Changes in intestinal mucosal barrier proteins in mice after dextran sulfate sodium induction.
The mice were given normal drinking water before dextran sulfate sodium (DSS) treatment, and then the mice were given 3% DSS water for 4 d. Quantitative real-time reverse transcription-polymerase chain reaction and western blot analysis of intestinal barrier proteins were performed on homogenates of colonic mucosa tissues. A and B: The relative mRNA levels were determined relative to those in the wild-type (WT) group; C and D: The densities of the bands were determined relative to those in the WT group; E: Mucin 2 (MUC2) mRNA levels were examined in the homogenates of colonic mucosa tissues; F: The animals were euthanized on days 0, 4, and 6 after receiving DSS water. The levels of secretory immunoglobulin A (sIgA) in the homogenates of colonic mucosa tissues were examined by enzyme-linked immunosorbent assay. n = 3 per group. aP < 0.05, bP < 0.01, cP < 0.005 compared with WT mice. KO: Gene knockout; ZO-1: Zonula occludens-1.
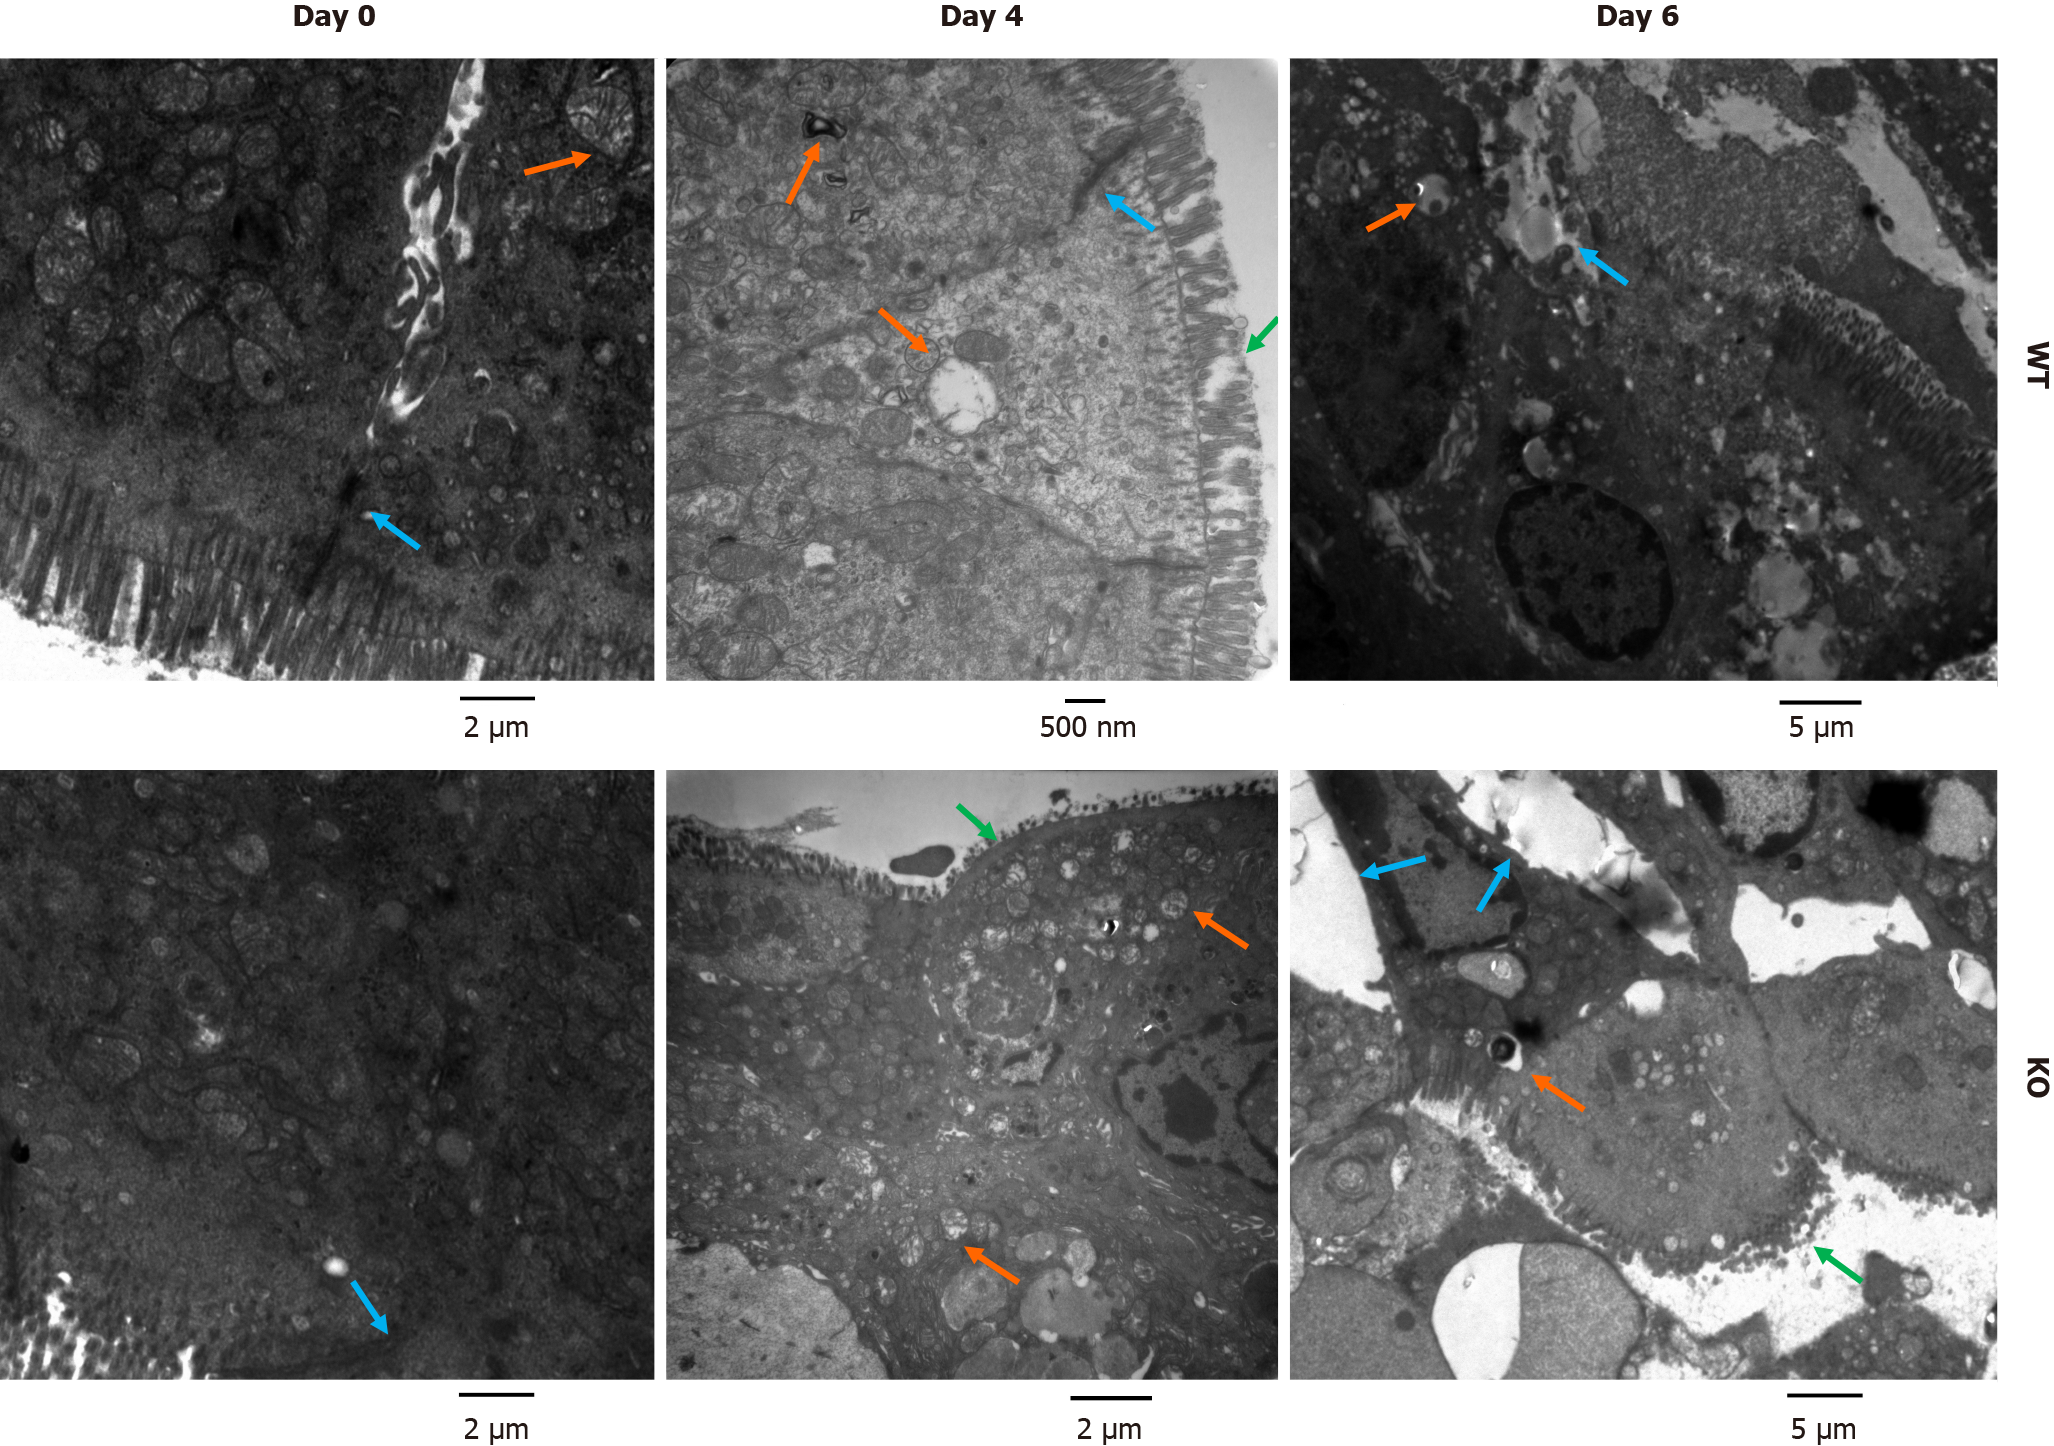
Figure 4 Ultrastructure of colonic mucosal epithelial cells in mice after dextran sulfate sodium induction.
Mice were treated with 3% dextran sulfate sodium (DSS) water. Colon sections (0.5 cm) were removed on days 0, 4, and 6 after DSS treatment and fixed in 2% glutaraldehyde. The microvilli, cell structure, organelles and cell junctions of intestinal mucosal epithelial cells were examined by electron microscopy. Before DSS induction, the junctions between epithelial cells in wild-type (WT) and gene knockout (KO) mice were normal. After DSS induction, WT mice exhibited a loss of microvilli, pyknotic nuclei and impaired tight junctions. In KO mice, severe colonic epithelial damage was observed, and the intestinal epithelial cells exhibited damaged microvilli, widening of intercellular spaces, nuclear pyknosis, and mitochondrial swelling and degeneration (green arrows show damaged microvilli, orange arrows show mitochondrial swelling, and blue arrows show the intercellular space).
Figure 5 Changes in antioxidant enzyme activity in the serum of mice after dextran sulfate sodium induction.
The mice were given normal drinking water before dextran sulfate sodium (DSS) treatment, and the mice were then given 3% DSS water for 4 d. The concentration of malondialdehyde (MDA) and the activities of superoxide (SOD) and glutathione peroxidase (GSH-Px) were determined before and after DSS induction for 4 d. A: Serum MDA levels; B: GSH-Px activity; C: SOD activity. n = 4 per group. aP < 0.05, bP < 0.01 compared with wild-type (WT) mice. KO: Gene knockout.
Figure 6 Changes in the expression of colonic nuclear factor erythroid 2-related factor 2 and antioxidant enzymes after dextran sulfate sodium induction.
The mice were given normal drinking water before dextran sulfate sodium (DSS) treatment, and the mice were then given 3% DSS water for 4 d. A and B: Western blot analysis of nuclear factor erythroid 2-related factor 2 (Nrf2) was performed on homogenates of colonic mucosa tissues before and after DSS induction; C: Quantitative real-time reverse transcription-polymerase chain reaction was used to measure the mRNA levels of Nrf2 and its target antioxidant genes in colonic mucosa tissues. n = 4 per group. aP < 0.05, bP < 0.01 compared with wild-type (WT) mice. GCLc: Glutamate-cysteine ligase catalytic subunit; GSH-Px: Glutathione peroxidase; HO-1: Heme oxygenase-1; KO: Gene knockout; SOD: Superoxide.
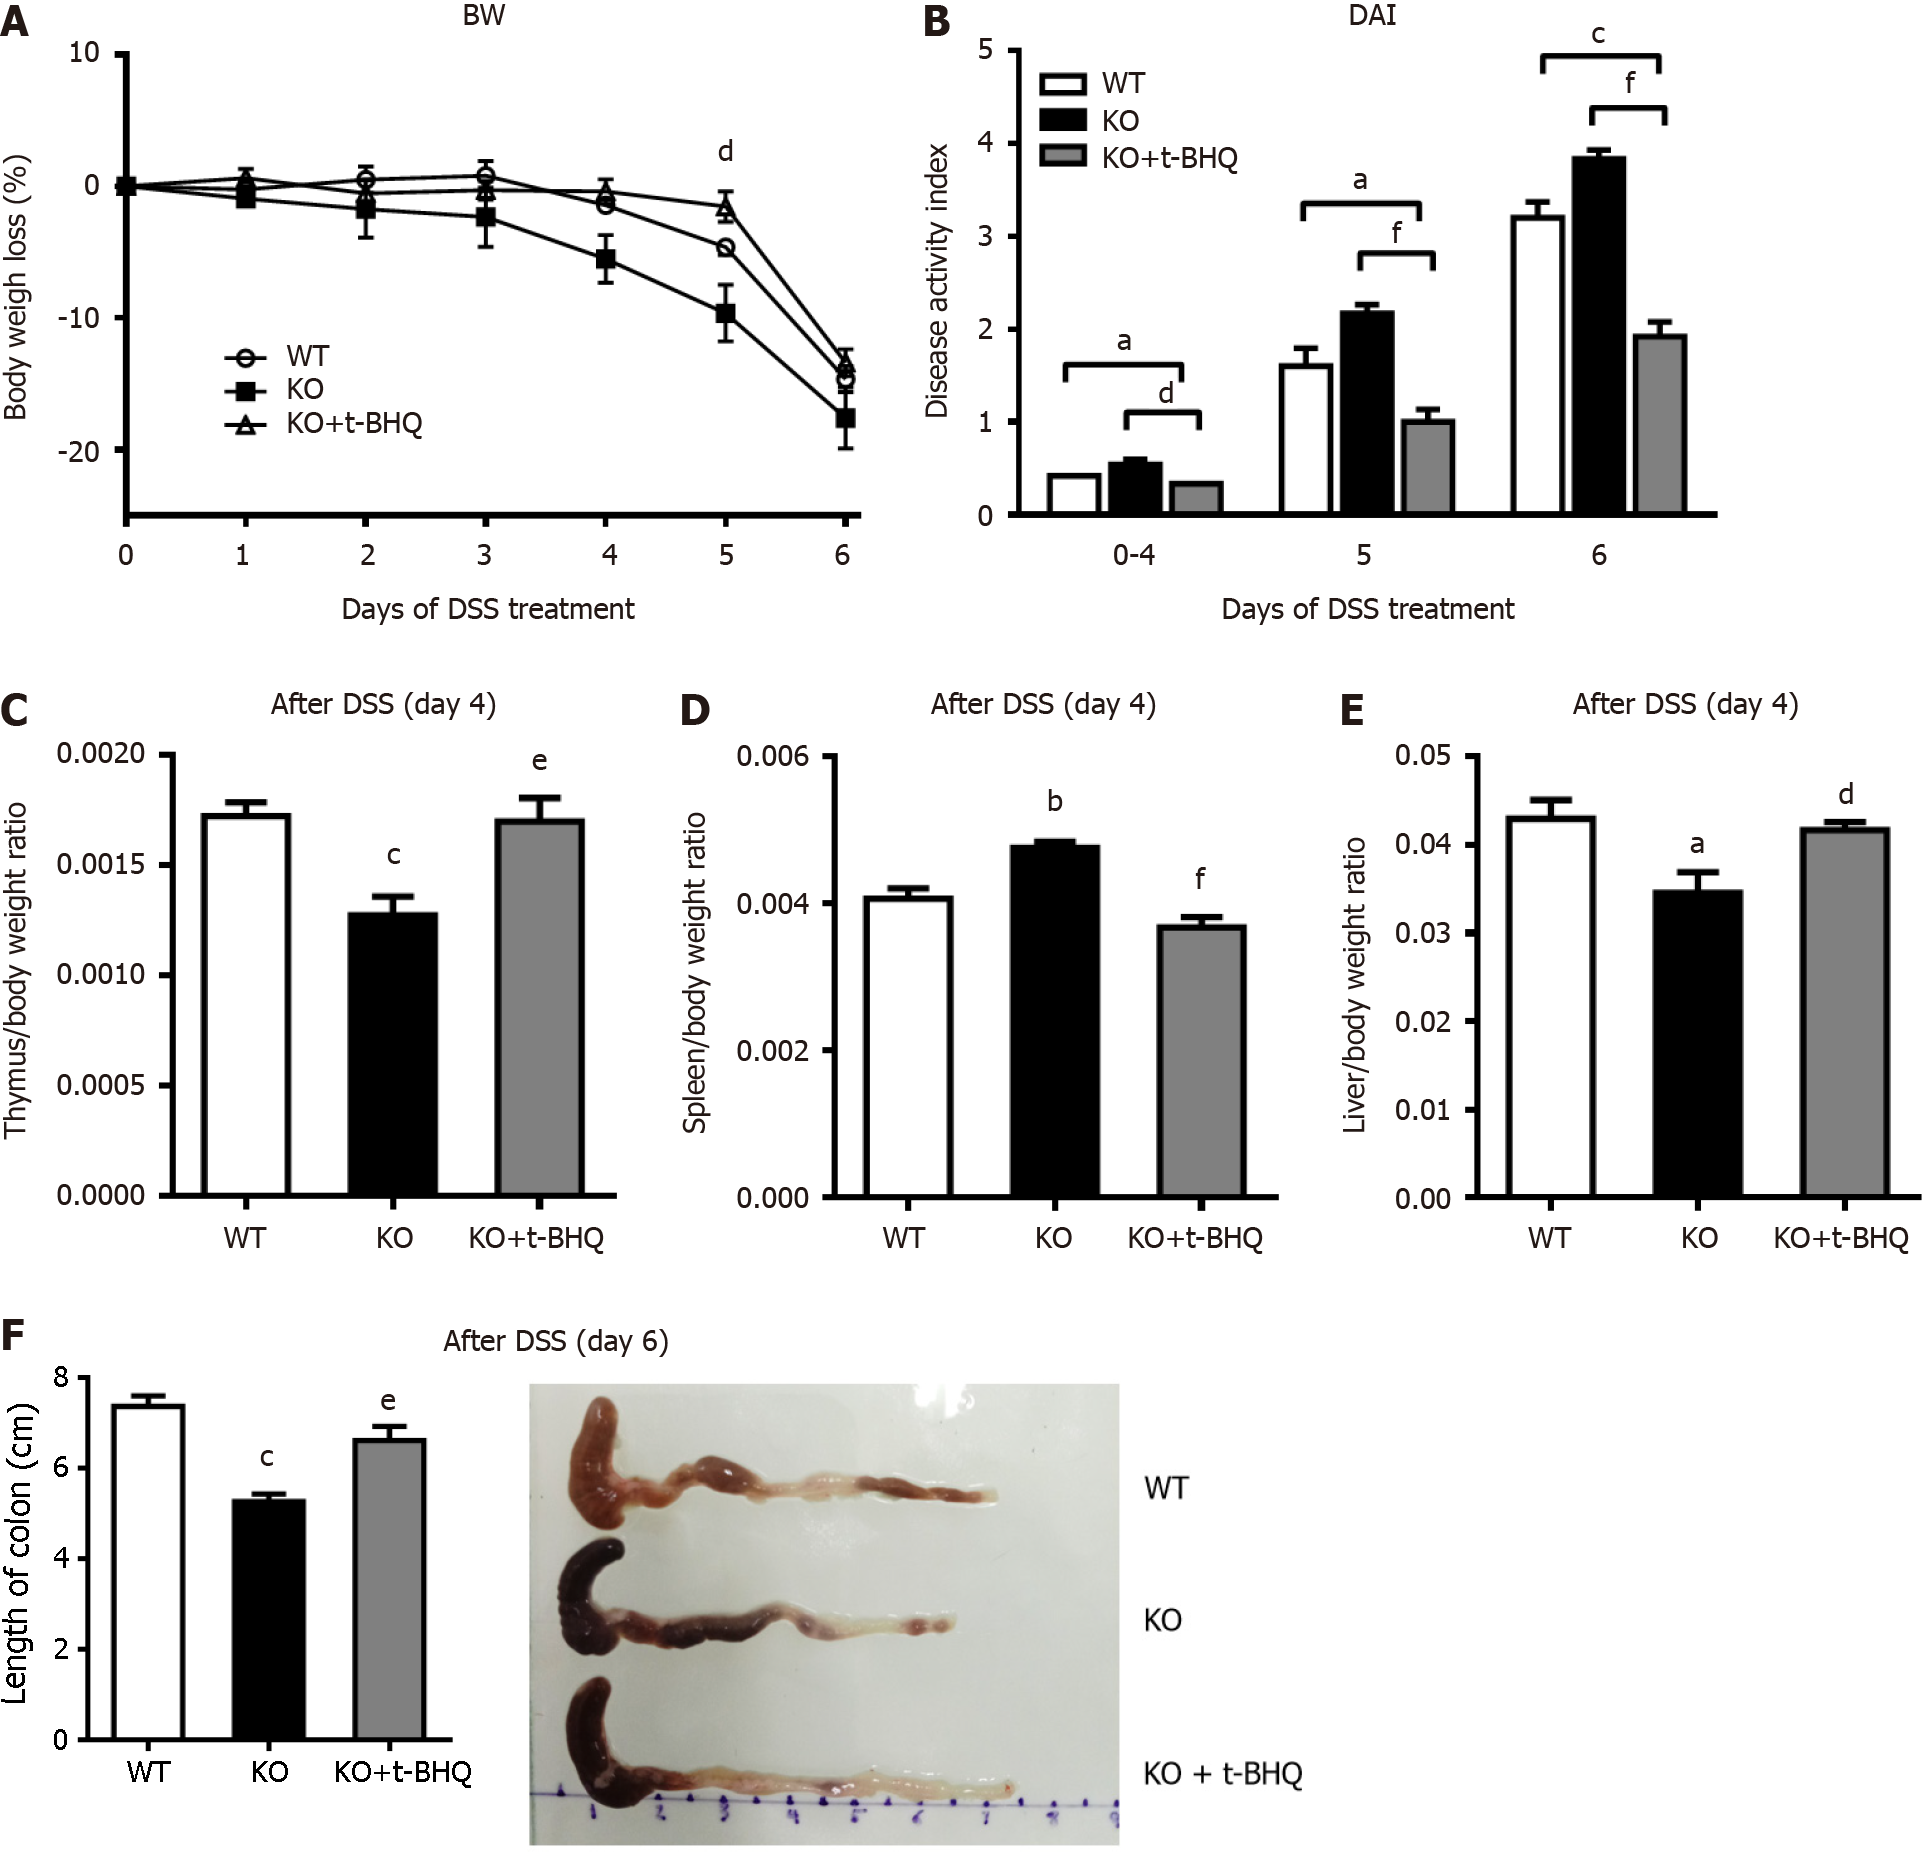
Figure 7 Changes in the incidence of experimental colitis after intraperitoneal injection of tertiary butylhydroquinone in mice.
The mice were given 3% dextran sulfate sodium (DSS) drinking water for 6 d, and gene knockout (KO) mice in the tertiary butylhydroquinone (t-BHQ) group were intraperitoneally injected with 50 mg/kg t-BHQ every day. A: Body weight (BW) loss; B: The disease activity index (DAI), calculated according to BW loss, active state, stool consistency, and blood in the stool; C-E: On day 6 of DSS treatment, the mice were killed, the organs were removed and weighed, the ratios of organ weight to BW were calculated; F: The colon lengths were measured. n = 4 or 5 per group. aP < 0.05, bP < 0.01, cP < 0.005, compared to wild-type (WT) mice. dP < 0.05, eP < 0.01, fP < 0.005, compared to KO mice.
- Citation: Tian Y, Li X, Wang X, Pei ST, Pan HX, Cheng YQ, Li YC, Cao WT, Petersen JDD, Zhang P. Alkaline sphingomyelinase deficiency impairs intestinal mucosal barrier integrity and reduces antioxidant capacity in dextran sulfate sodium-induced colitis. World J Gastroenterol 2024; 30(10): 1405-1419
- URL: https://www.wjgnet.com/1007-9327/full/v30/i10/1405.htm
- DOI: https://dx.doi.org/10.3748/wjg.v30.i10.1405


