Copyright
©The Author(s) 2024.
World J Gastroenterol. Mar 14, 2024; 30(10): 1393-1404
Published online Mar 14, 2024. doi: 10.3748/wjg.v30.i10.1393
Published online Mar 14, 2024. doi: 10.3748/wjg.v30.i10.1393
Figure 1 Study flow chart, showing the method used to develop and verify the Exercise and Diet Adherence Scale.
EDAS: Exercise and Diet Adherence Scale.
Figure 2 Receiver operating characteristics analysis.
A: Receiver operating characteristics (ROC) analysis of the relationship between total Exercise and Diet Adherence Scale (EDAS) score and daily exercise; B: ROC analysis of the relationship between total EDAS score and daily calorie reduction. AUROC: Areas under the receiver operating characteristics curves.
Figure 3 Efficacy of total score in judging daily exercise and daily calorie reduction.
Figure 4 Relationships between Exercise and Diet Adherence Scale grouping and various indicators of non-alcoholic fatty liver disease.
A: 3 months; B: 6 months. ALT: Alanine aminotransferase; TBIL: Total bilirubin; GLU: Glucose; TC: Total cholesterol; AC: Abdominal circumference; CAP: Controlled attenuation parameter; LSM: Liver stiffness measurement.
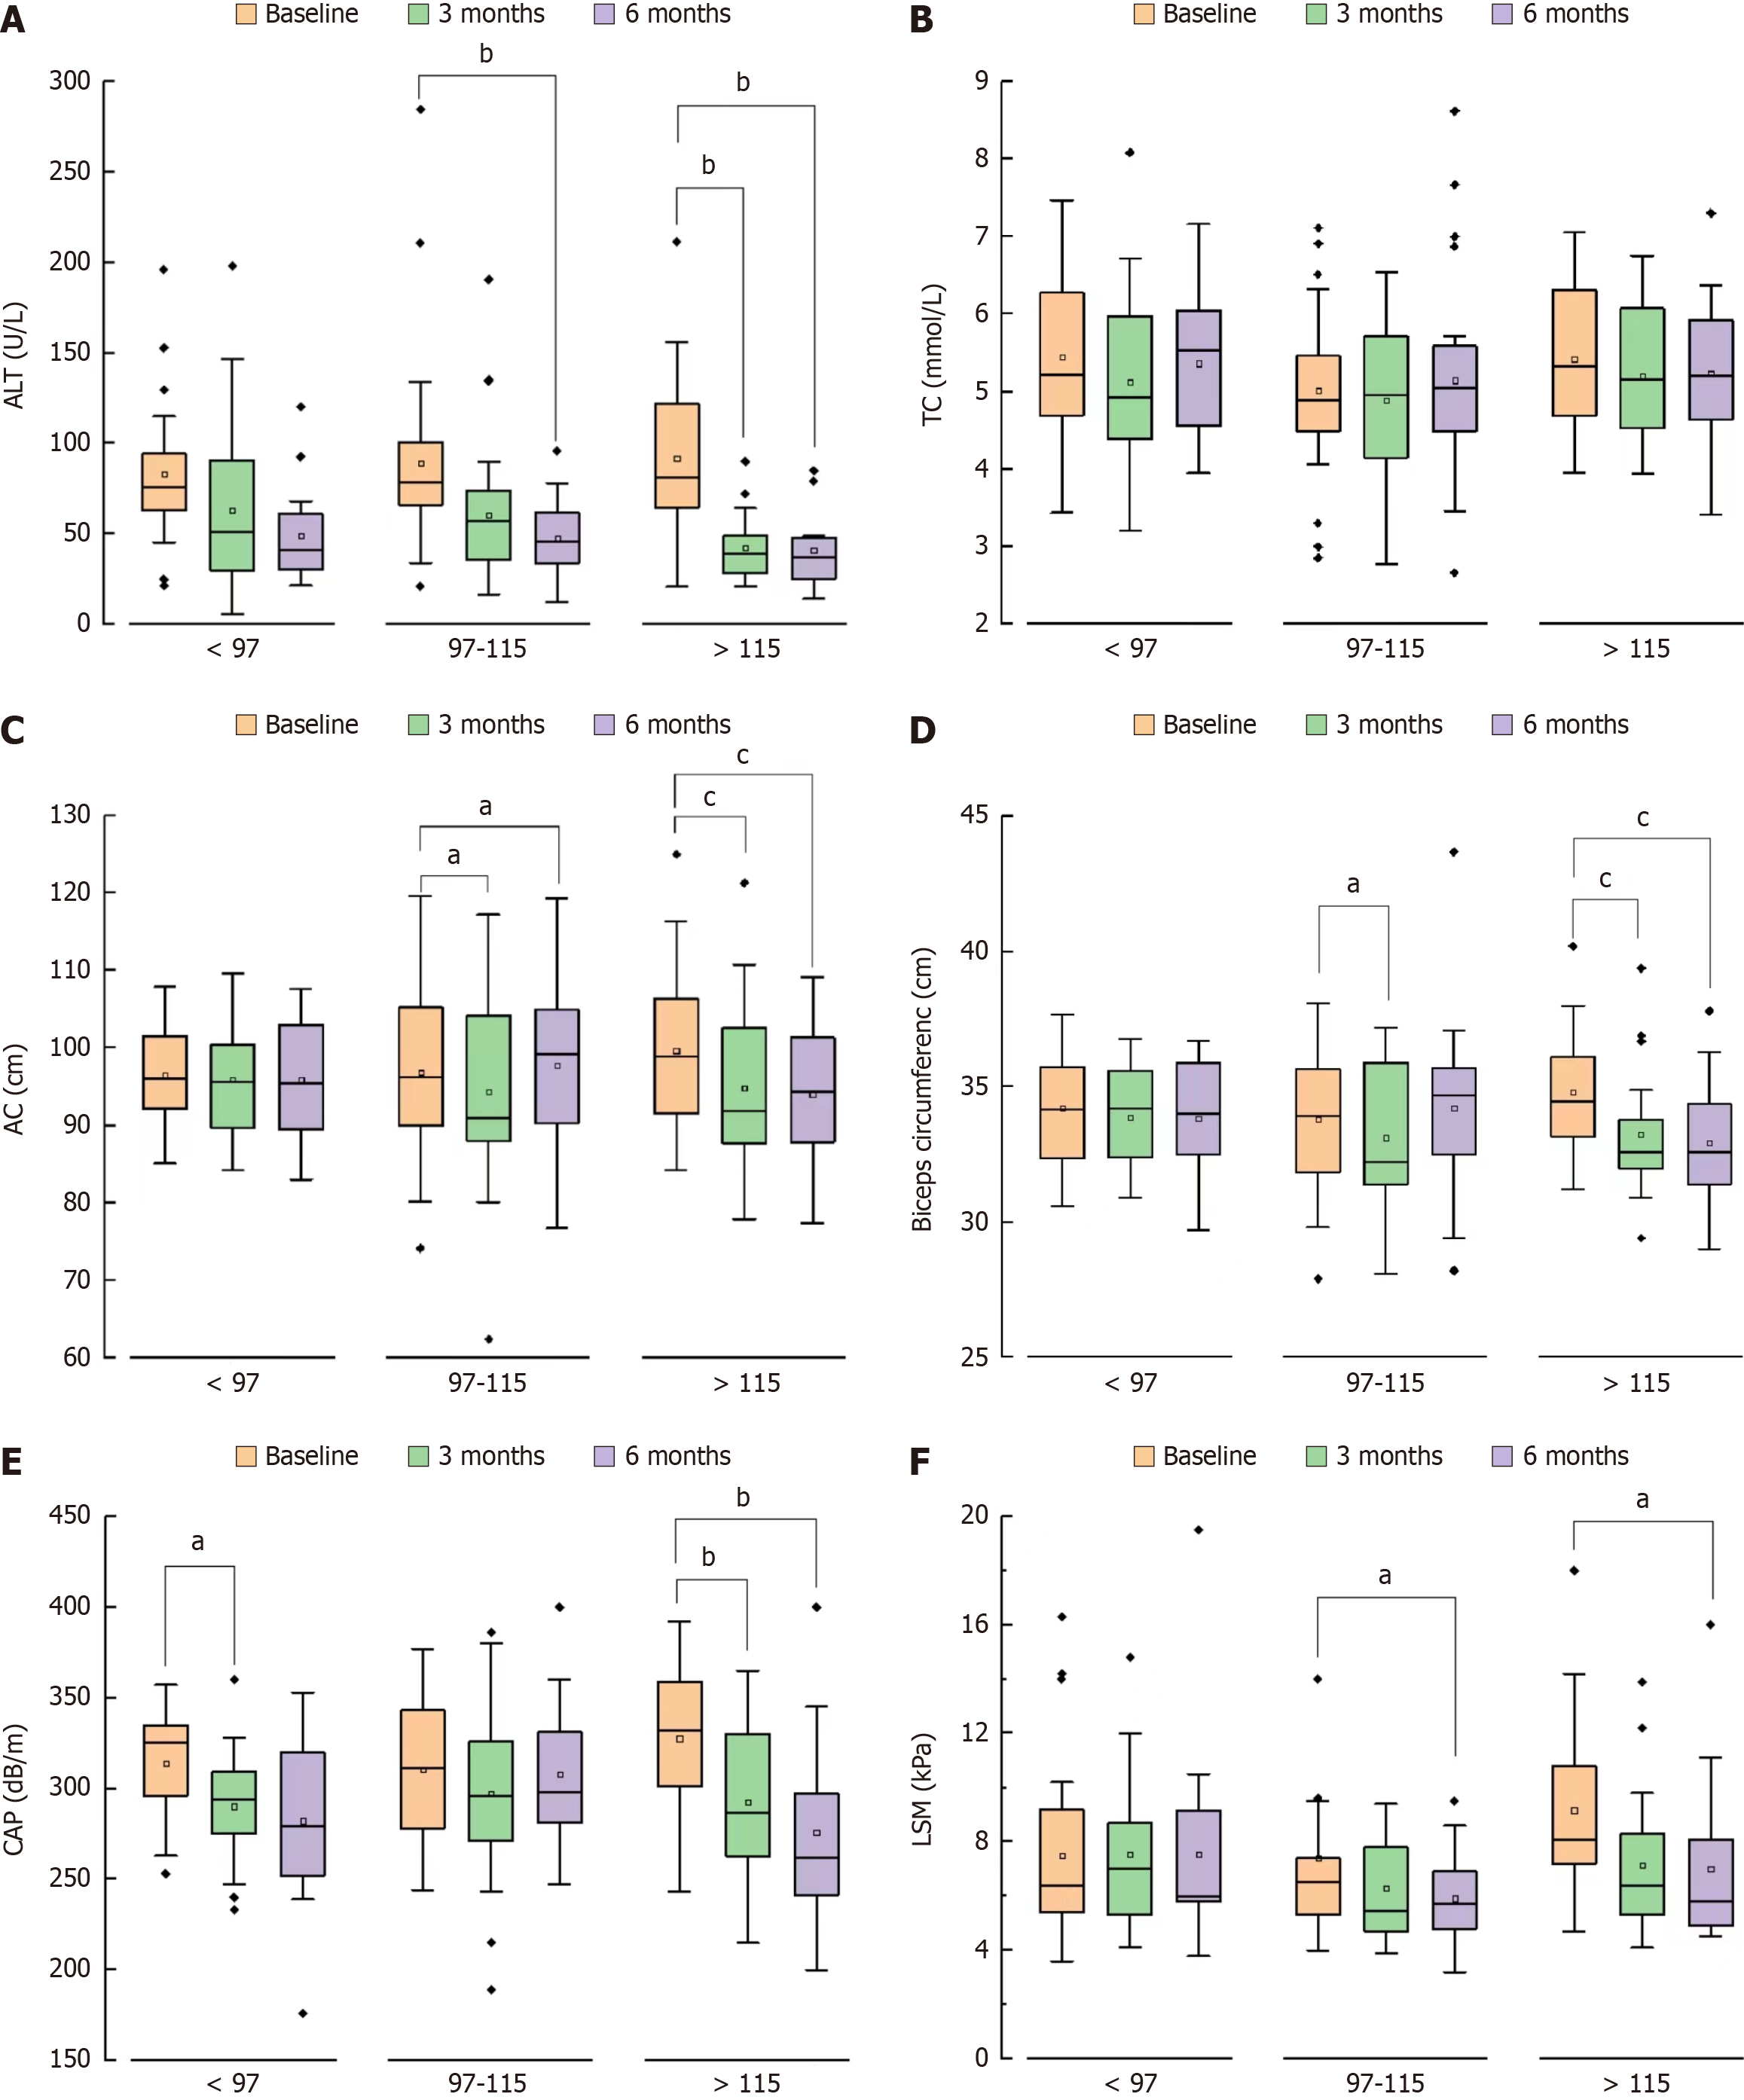
Figure 5 Effects of lifestyle interventions on body composition and biochemical indices of patients grouped by Exercise and Diet Adherence Scale scores.
A: Alanine aminotransferase; B: Total cholesterol; C: Abdominal circumference; D: Biceps circumference; E: Controlled attenuation parameter; F: Liver stiffness measurement. ALT: Alanine aminotransferase; TBIL: Total bilirubin; GLU: Glucose; TC: Total cholesterol; CAP: Controlled attenuation parameter; LSM: Liver stiffness measurement.
Figure 6 Associations of Exercise and Diet Adherence Scale scores with adherence with lifestyle interventions and associated clinical guidelines.
EDAS: Exercise and Diet Adherence Scale.
- Citation: Zeng MH, Shi QY, Xu L, Mi YQ. Establishment and validation of an adherence prediction system for lifestyle interventions in non-alcoholic fatty liver disease. World J Gastroenterol 2024; 30(10): 1393-1404
- URL: https://www.wjgnet.com/1007-9327/full/v30/i10/1393.htm
- DOI: https://dx.doi.org/10.3748/wjg.v30.i10.1393


