Copyright
©The Author(s) 2024.
World J Gastroenterol. Mar 14, 2024; 30(10): 1377-1392
Published online Mar 14, 2024. doi: 10.3748/wjg.v30.i10.1377
Published online Mar 14, 2024. doi: 10.3748/wjg.v30.i10.1377
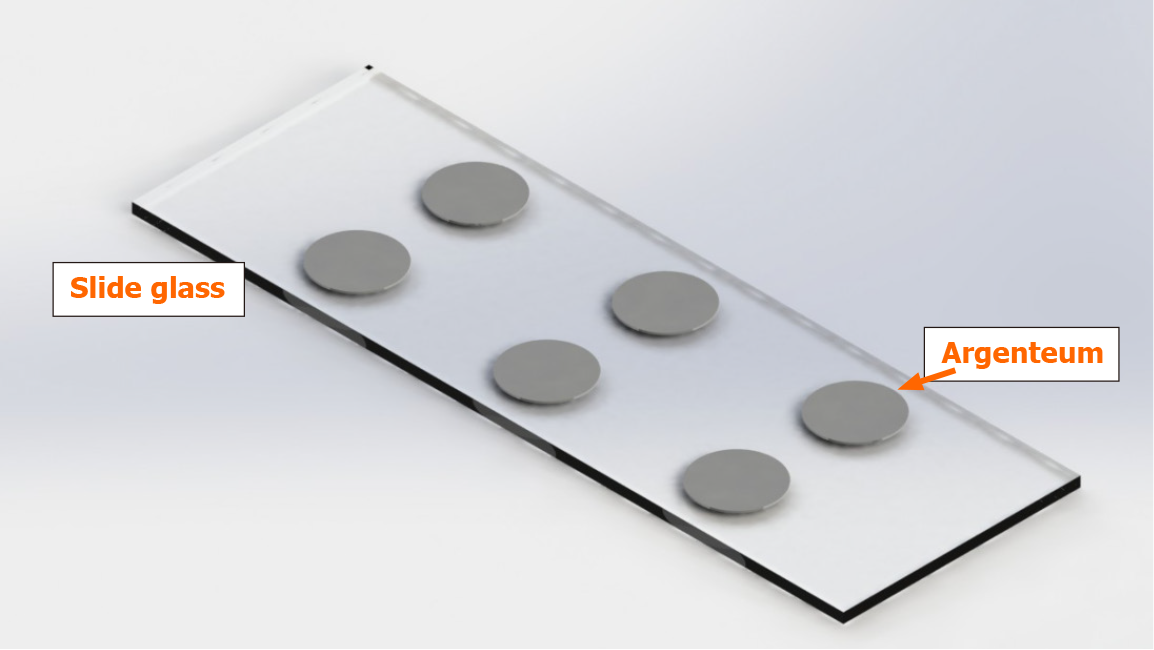
Figure 1 Argentum film on glass slides.
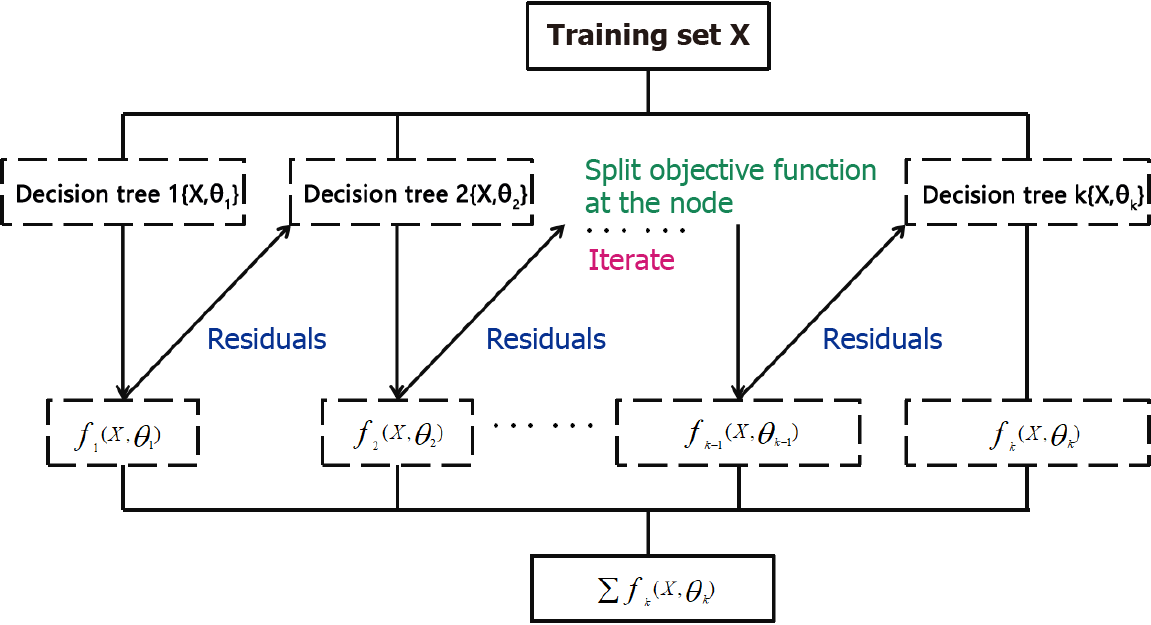
Figure 2 Schematic of XGBoost.
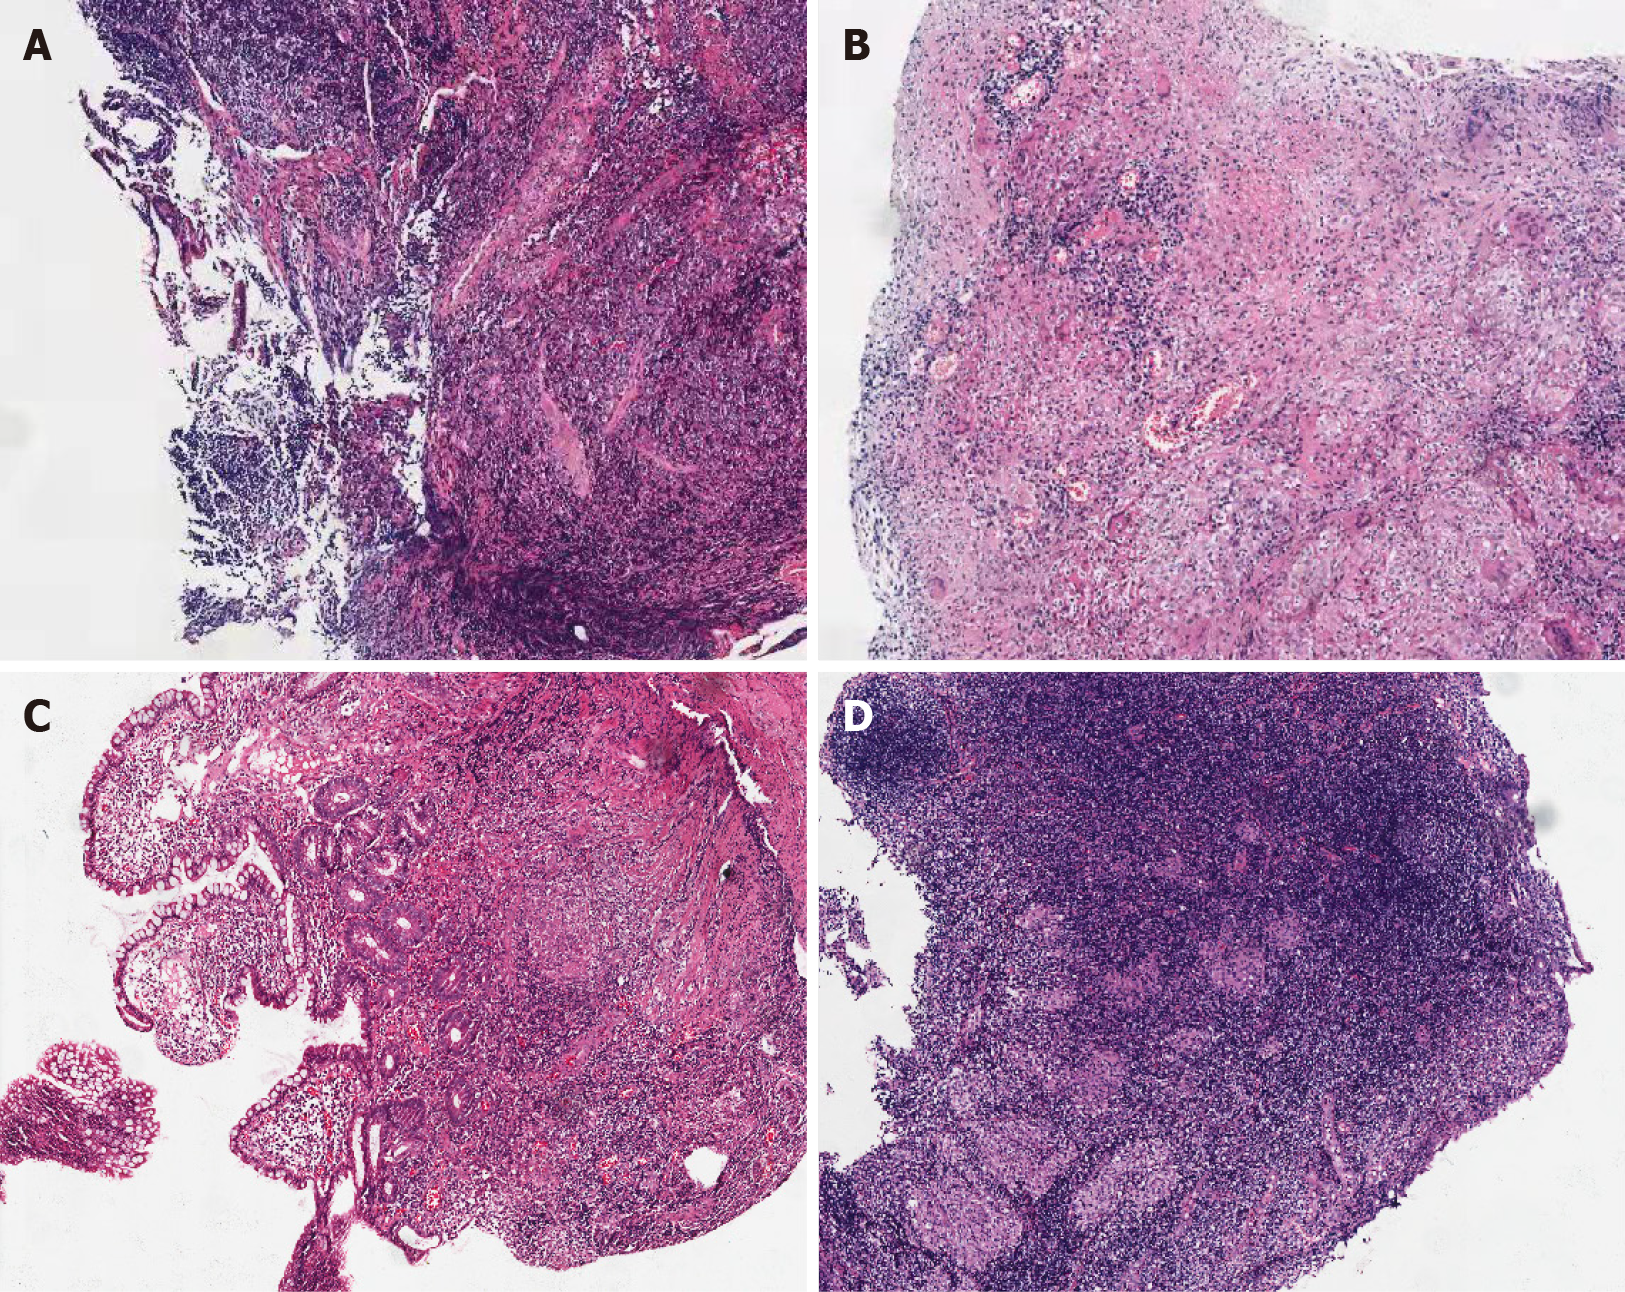
Figure 3 Pathological images of Crohn’s disease and intestinal tuberculosis.
A: Typical pathological images of Crohn’s disease (CD); B: Pathological images of typical intestinal tuberculosis (ITB); C: Atypical pathological images of CD; D: pathological images of atypical ITB.
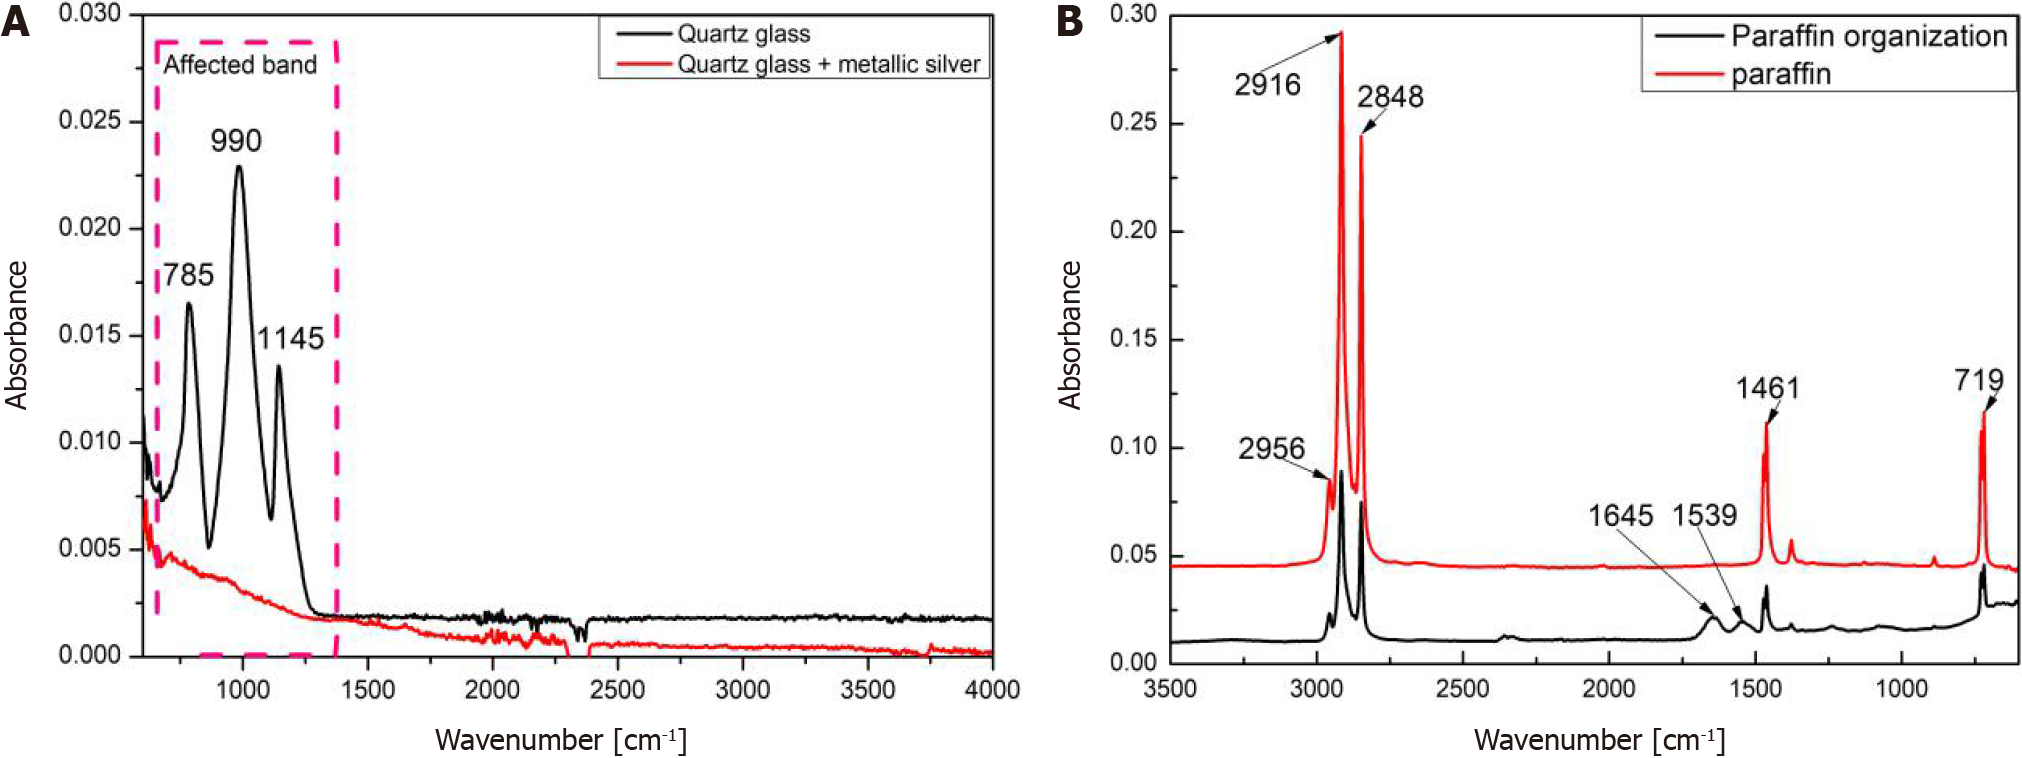
Figure 4 Background absorption spectra of quartz and paraffin.
A: Quartz; B: Paraffin.
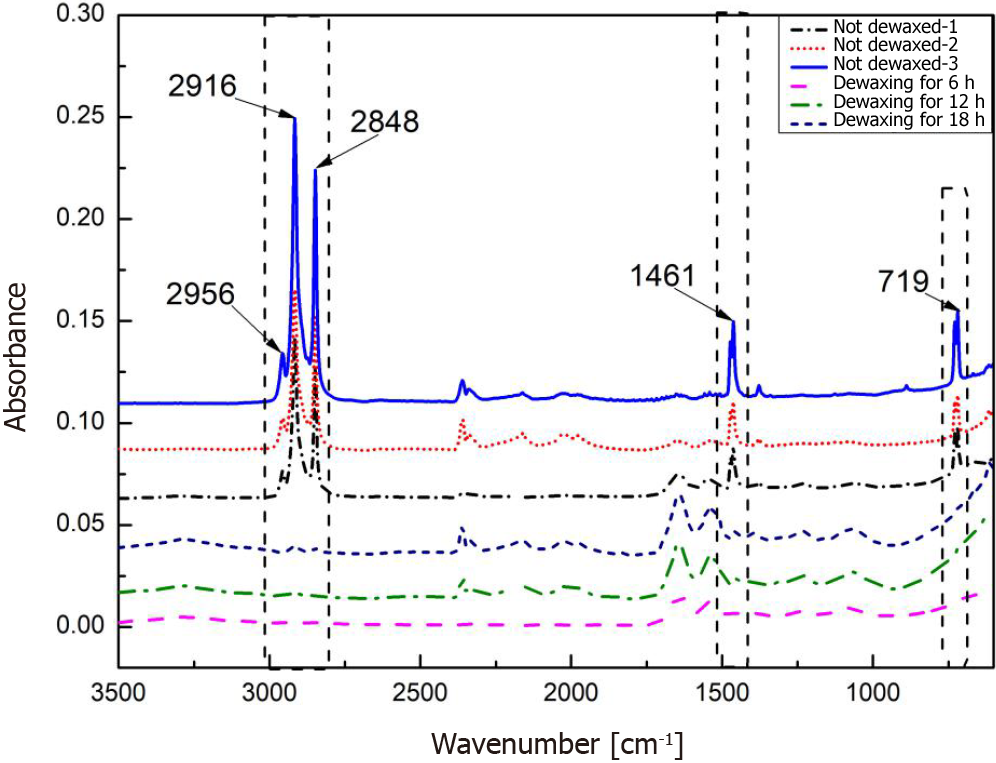
Figure 5 Absorption spectra of dewaxed and unwaxed tissue sections.
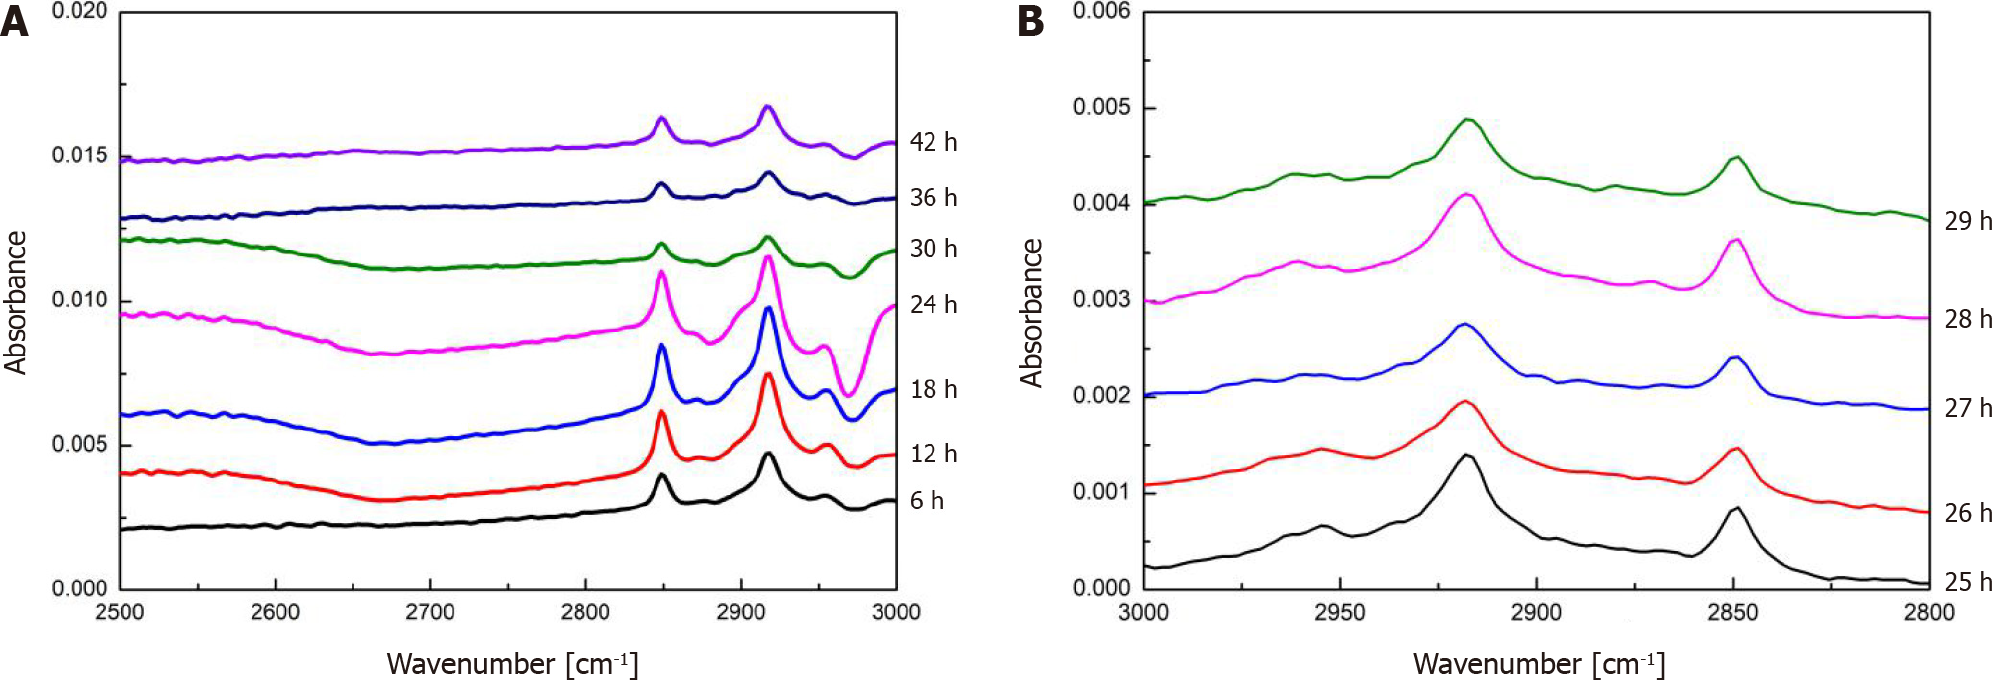
Figure 6 Optimization of dewaxing duration.
A: Absorption spectra of tissues during the dewaxing process for 6-42 h; B: Absorption spectra of tissues during the dewaxing process for 24-30 h.
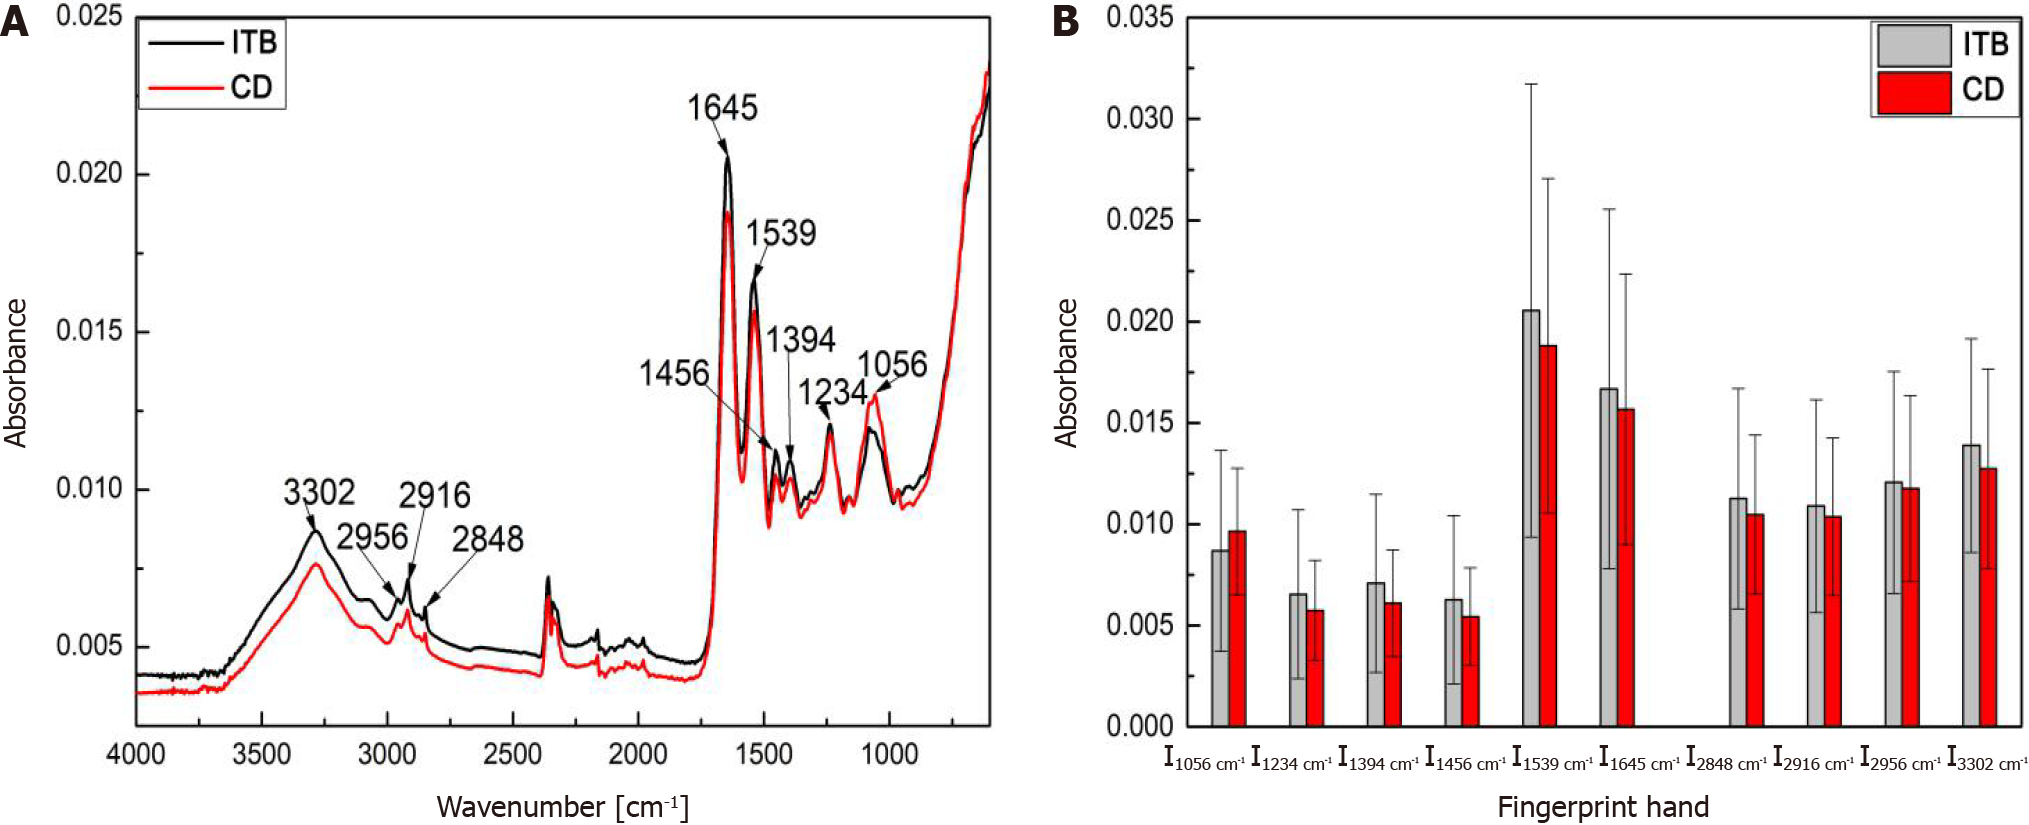
Figure 7 Fourier transform infrared spectrometers equipped with accessories for attenuated total reflectance spectral analysis of intestinal tuberculosis and Crohn’s disease.
A: Original spectrum; B: Spectral intensity of the characteristic bands. CD: Crohn’s disease; ITB: Intestinal tuberculosis.
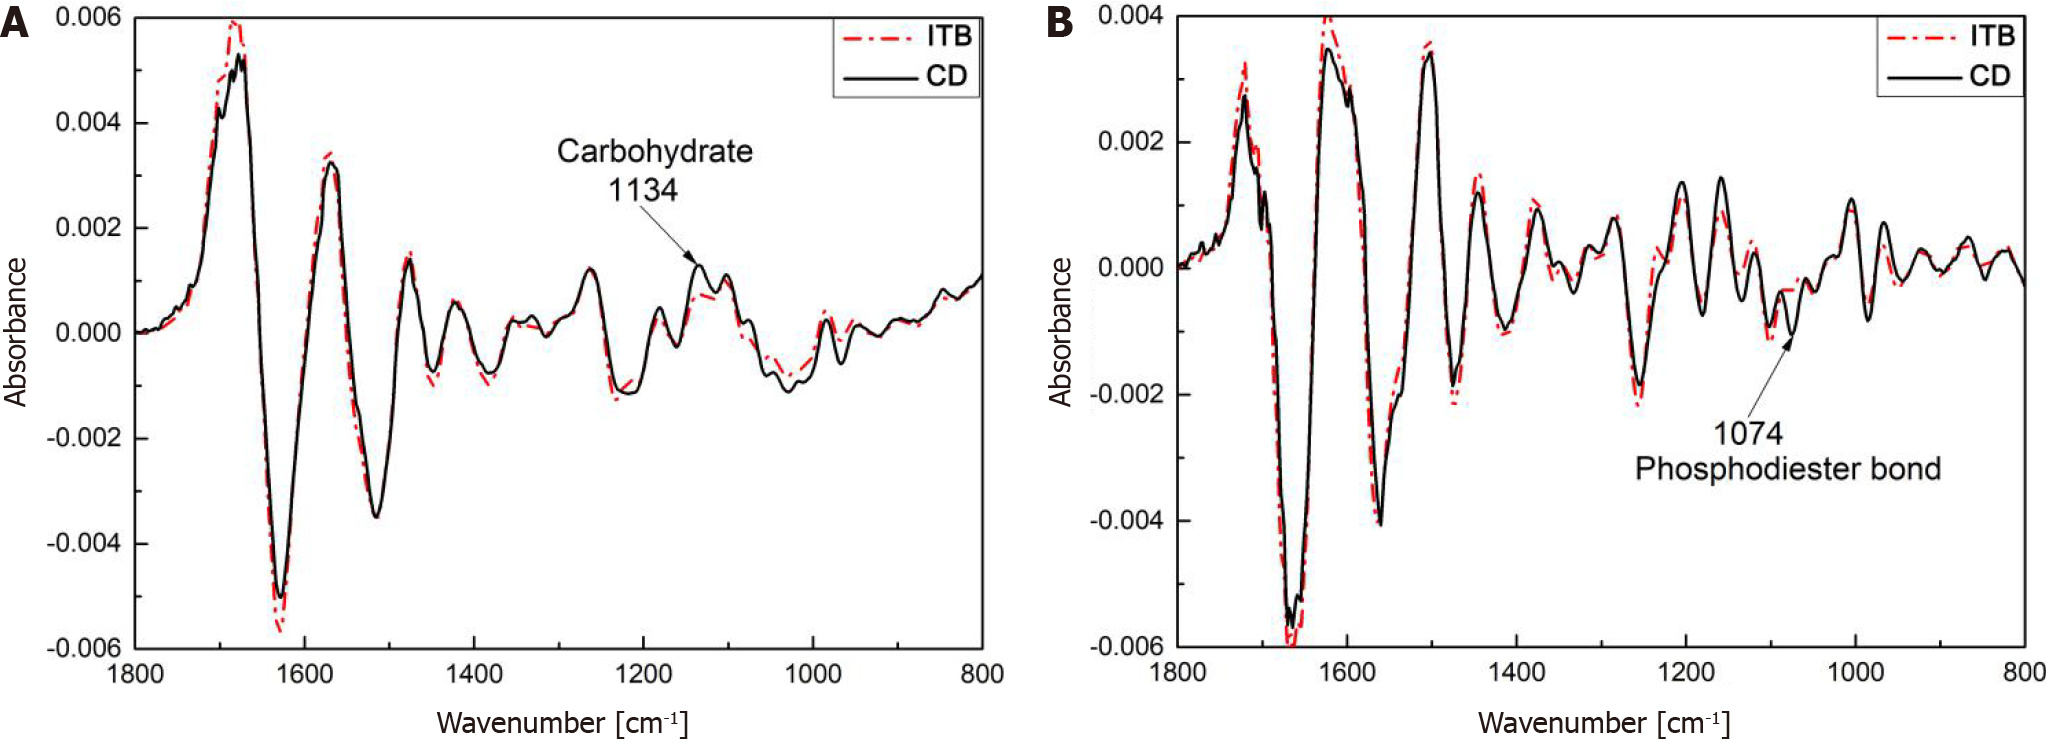
Figure 8 Derivative spectrum.
A: First-derivative spectra; B: Second-derivative spectra. CD: Crohn’s disease; ITB: Intestinal tuberculosis.
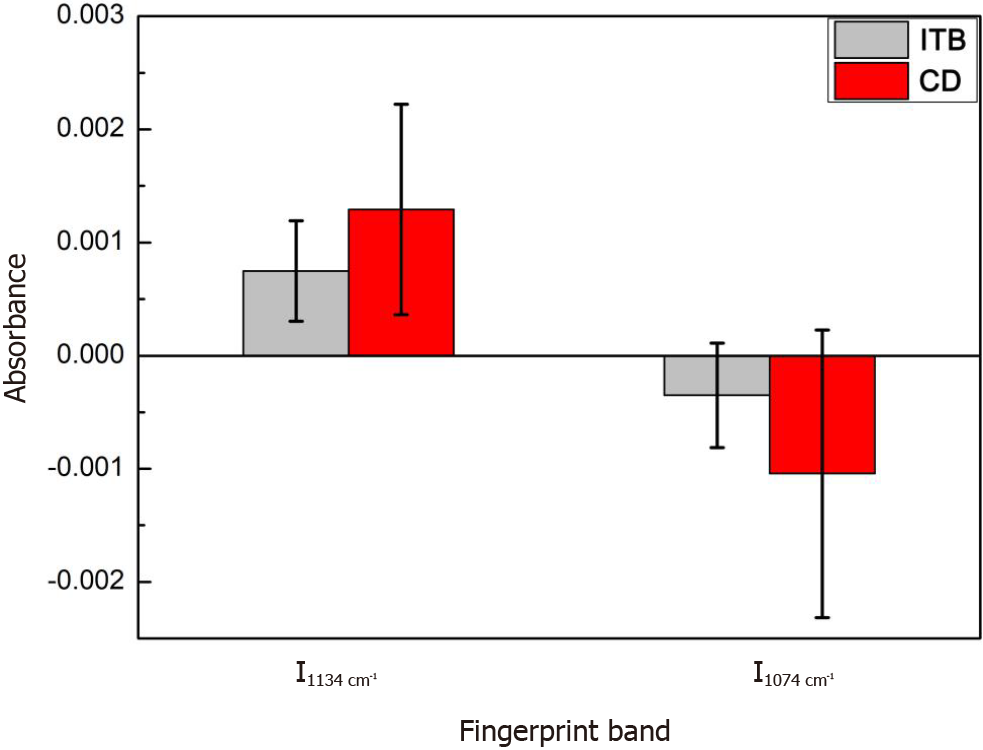
Figure 9 Derivative spectral characteristic intensity analysis.
CD: Crohn’s disease; ITB: Intestinal tuberculosis.
Figure 10 Schematic diagram of XGBoost used to identify intestinal tuberculosis and Crohn’s disease.
A: Original spectra; B: Derivative spectra; C: Feature extraction; D: Modeling analysis; E: Classification results. CD: Crohn’s disease; ITB: Intestinal tuberculosis; PCA: principal component analysis; ICA: Independent component analysis.
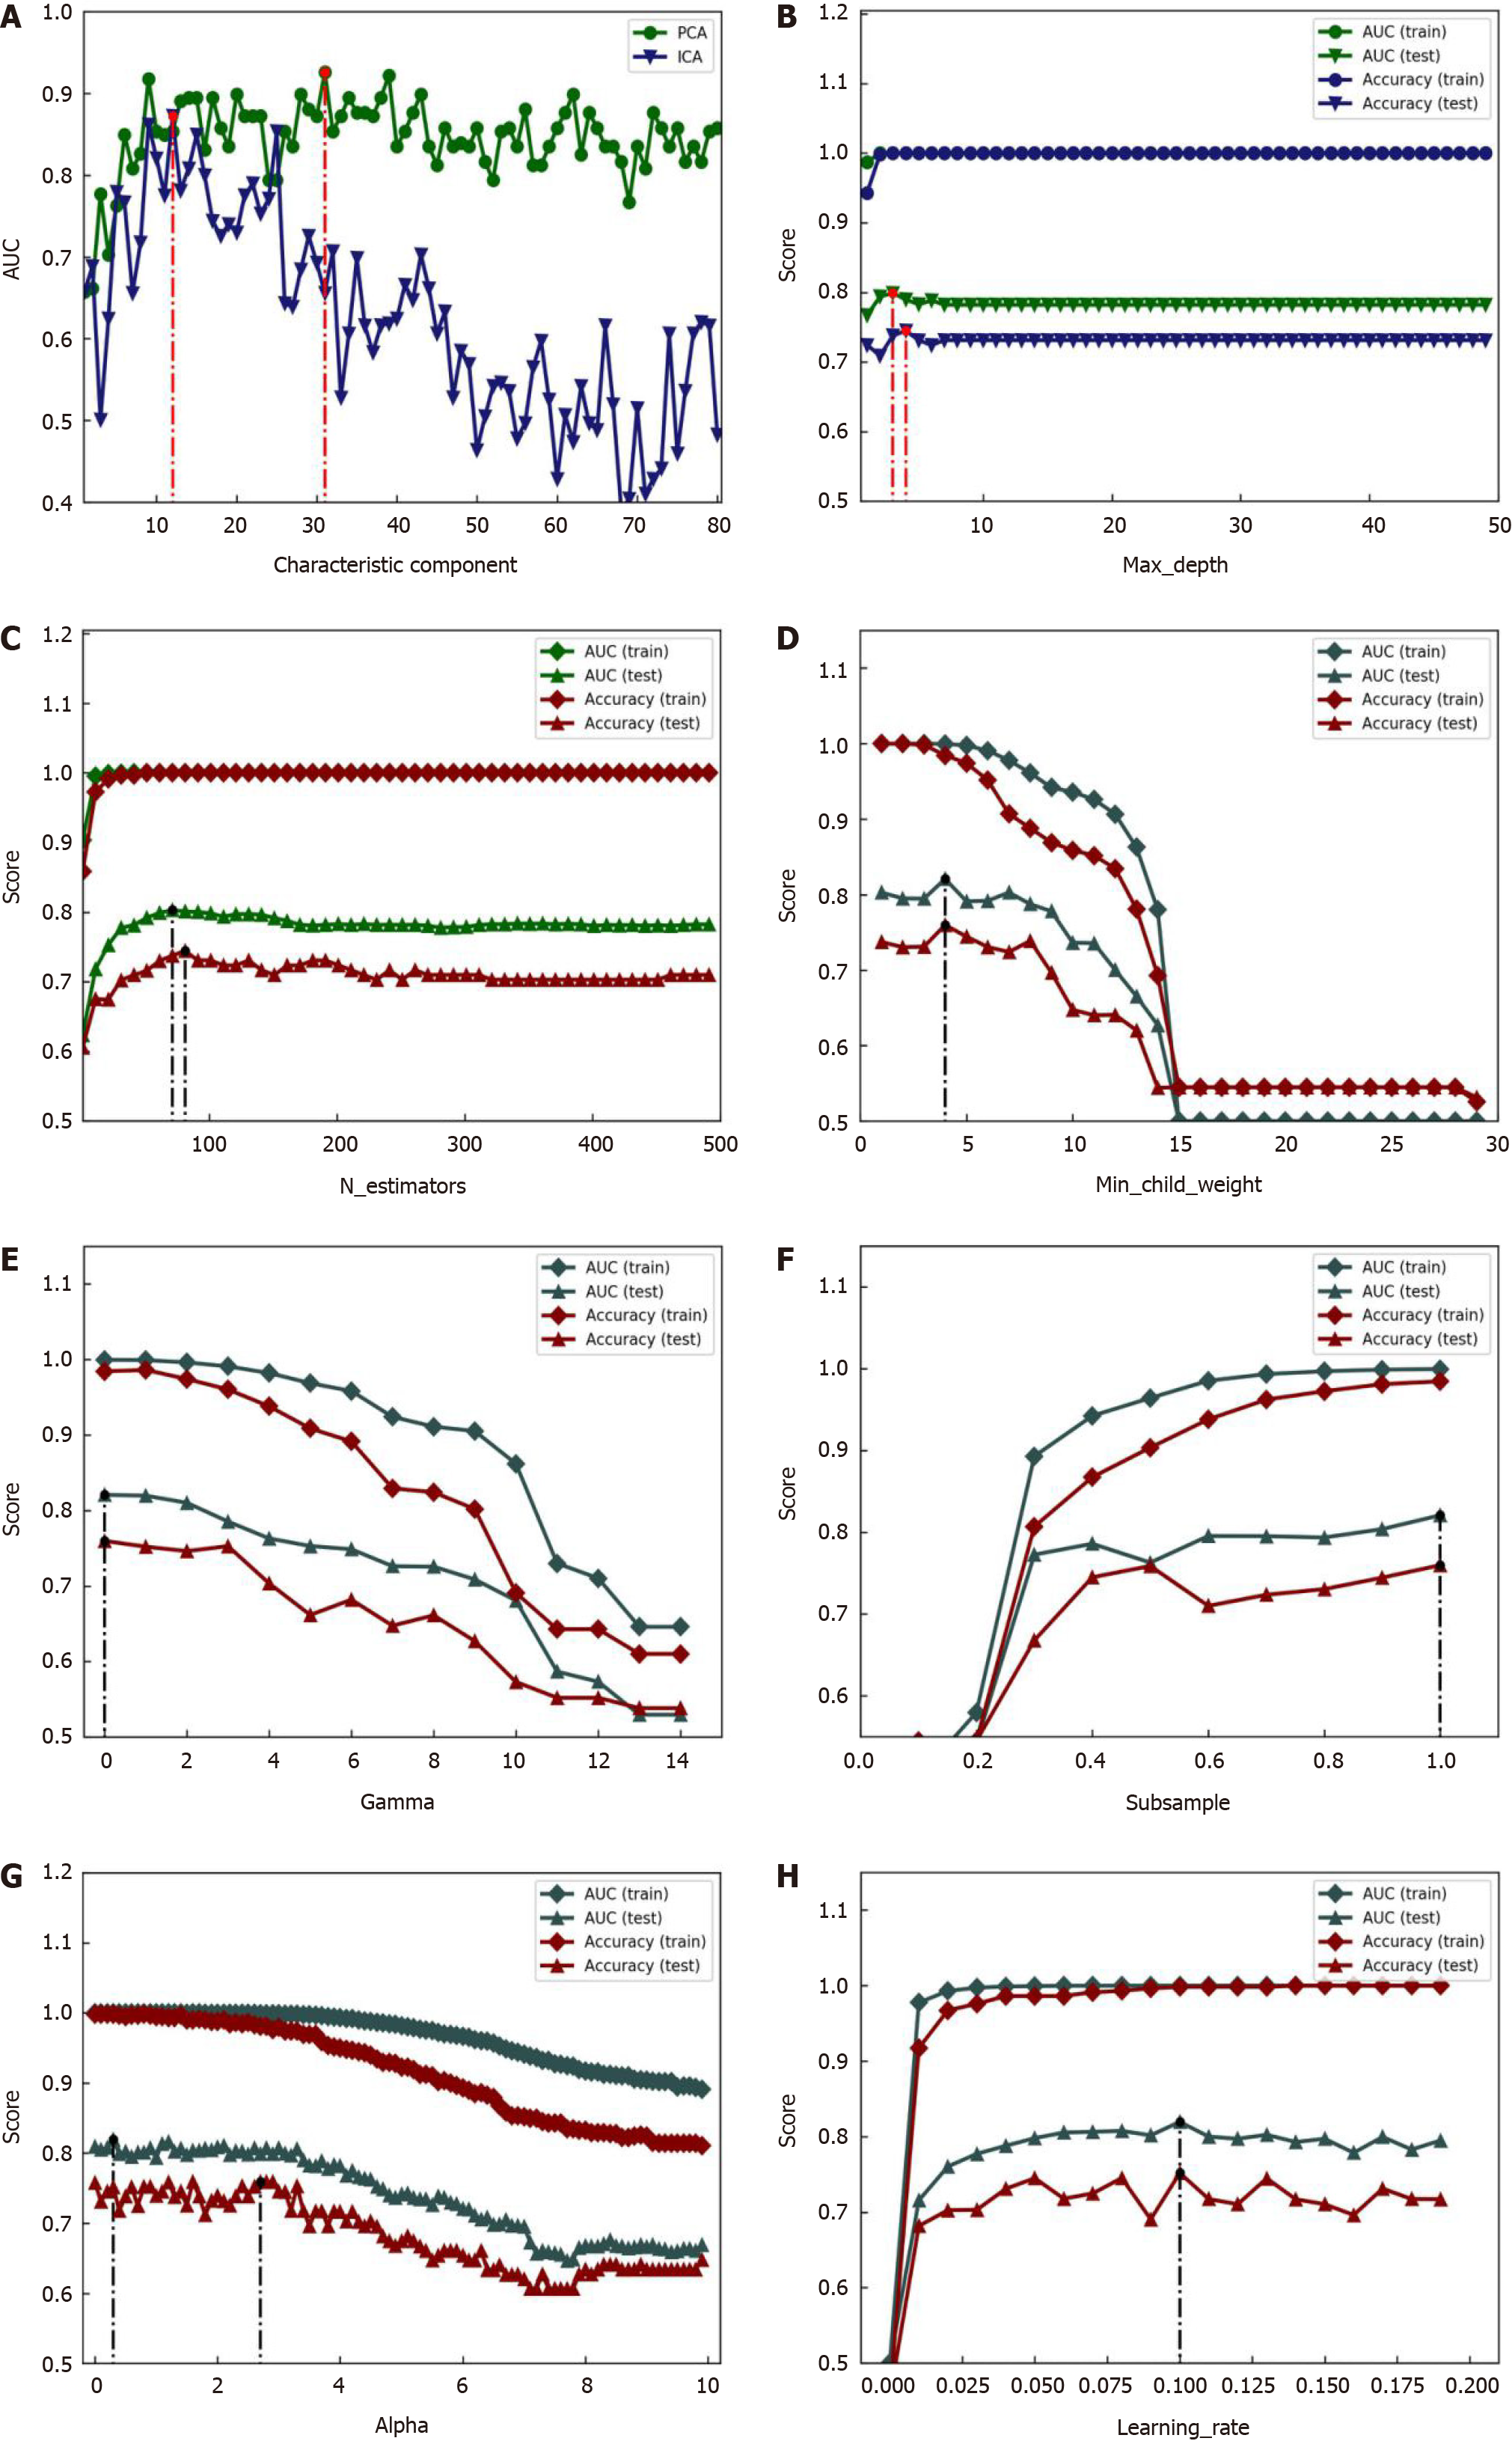
Figure 11 XGBoost model optimization results based on first derivative spectral data.
A: Characteristic component; B: Max_depth; C: N_estimators; D: Min_child_weight; E: Gamma; F: Subsample; G: Alpha; H: Learning_rate.
- Citation: Li YP, Lu TY, Huang FR, Zhang WM, Chen ZQ, Guang PW, Deng LY, Yang XH. Differential diagnosis of Crohn’s disease and intestinal tuberculosis based on ATR-FTIR spectroscopy combined with machine learning. World J Gastroenterol 2024; 30(10): 1377-1392
- URL: https://www.wjgnet.com/1007-9327/full/v30/i10/1377.htm
- DOI: https://dx.doi.org/10.3748/wjg.v30.i10.1377


