Copyright
©The Author(s) 2024.
World J Gastroenterol. Jan 7, 2024; 30(1): 108-111
Published online Jan 7, 2024. doi: 10.3748/wjg.v30.i1.108
Published online Jan 7, 2024. doi: 10.3748/wjg.v30.i1.108
Figure 1 Dual energy computed tomography in severe pancreatitis.
A: Iodine mapping; B: Portal venous phase (blue arrow); C: Virtual non-contrast image in the patient with severe pancreatitis. Acute necrotic collection is seen in the pancreatic body and tail.
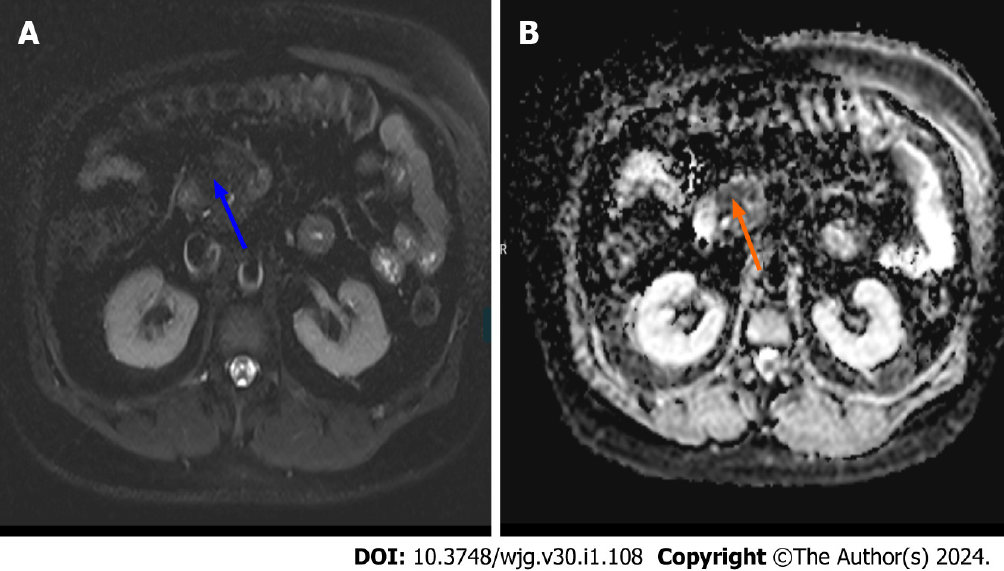
Figure 2 Magnetic resonance imaging and apparent diffusion coefficient map in early acute pancreatitis (original image).
A: On axial T2 weighted fat saturated images there was no obvious signal change (blue arrow) in the pancreatic head; B: On apparent diffusion coefficient (ADC) map there was an obvious low ADC region (orange arrow) in the pancreatic head indicating early acute pancreatitis.
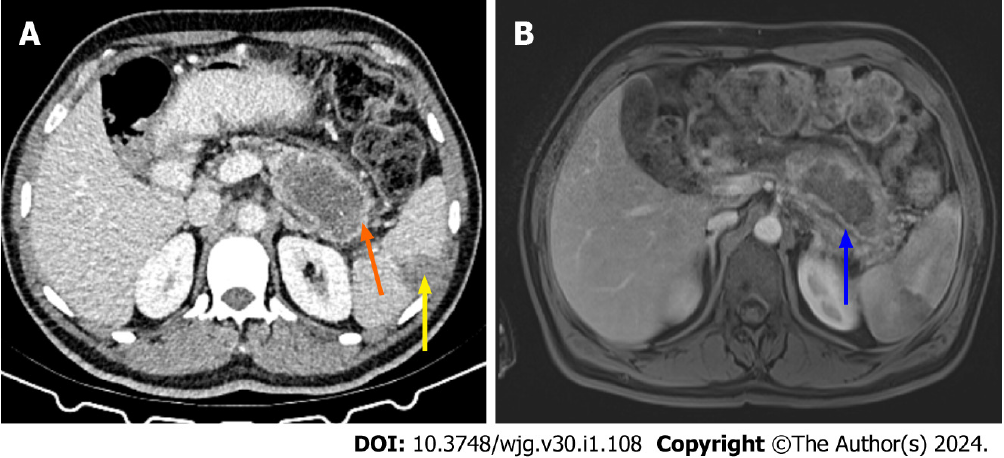
Figure 3 Computed tomography and contrast enhanced magnetic resonance imaging in necrotizing pancreatitis (original image).
A: Computed tomography (CT) image of a patient with known necrotizing pancreatitis. On the pancreatic bed, 73 mm × 45 mm fluid collection with irregular thick walls (orange arrow) was seen along with a focal wedge shaped peripheral non-enhancement of spleen consistent with infarction (yellow arrow); B: Two days following the CT scan, the same patient’s contrast-enhanced T1 weighted fat-saturated magnetic resonance image showed thromboembolic hypointensity in the splenic artery (blue arrow).
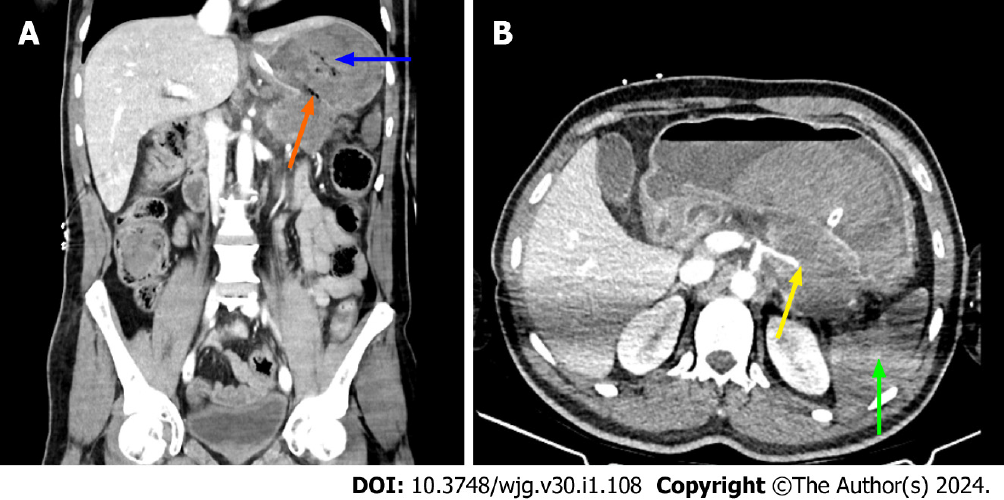
Figure 4 Computed tomography images of complicated necrotizing pancreatitis (original image).
A: Coronal image of the same patient (Figure 3) with walled off necrosis. Coronal computed tomography (CT) image showed that walled off necrosis was complicated by perforation into the stomach. A defect was seen on the wall of the necrotic collection (orange arrow). Stomach content was hyperdense (blue arrow) adjacent to the defect. When considered together with the gastrointestinal bleeding findings in the patient, this hyperdense appearance was thought to represent hemorrhage; B: Axial CT image showed that the splenic artery appeared to be occluded as it passes over the edge of the walled off necrosis (yellow arrow). It was also noteworthy that there was a near total loss of contrast enhancement in the spleen, consistent with infarction (green arrow).
- Citation: Ozturk MO, Aydin S. Complementary comments on diagnosis, severity and prognosis prediction of acute pancreatitis. World J Gastroenterol 2024; 30(1): 108-111
- URL: https://www.wjgnet.com/1007-9327/full/v30/i1/108.htm
- DOI: https://dx.doi.org/10.3748/wjg.v30.i1.108


