Copyright
©The Author(s) 2023.
World J Gastroenterol. Feb 28, 2023; 29(8): 1374-1394
Published online Feb 28, 2023. doi: 10.3748/wjg.v29.i8.1374
Published online Feb 28, 2023. doi: 10.3748/wjg.v29.i8.1374
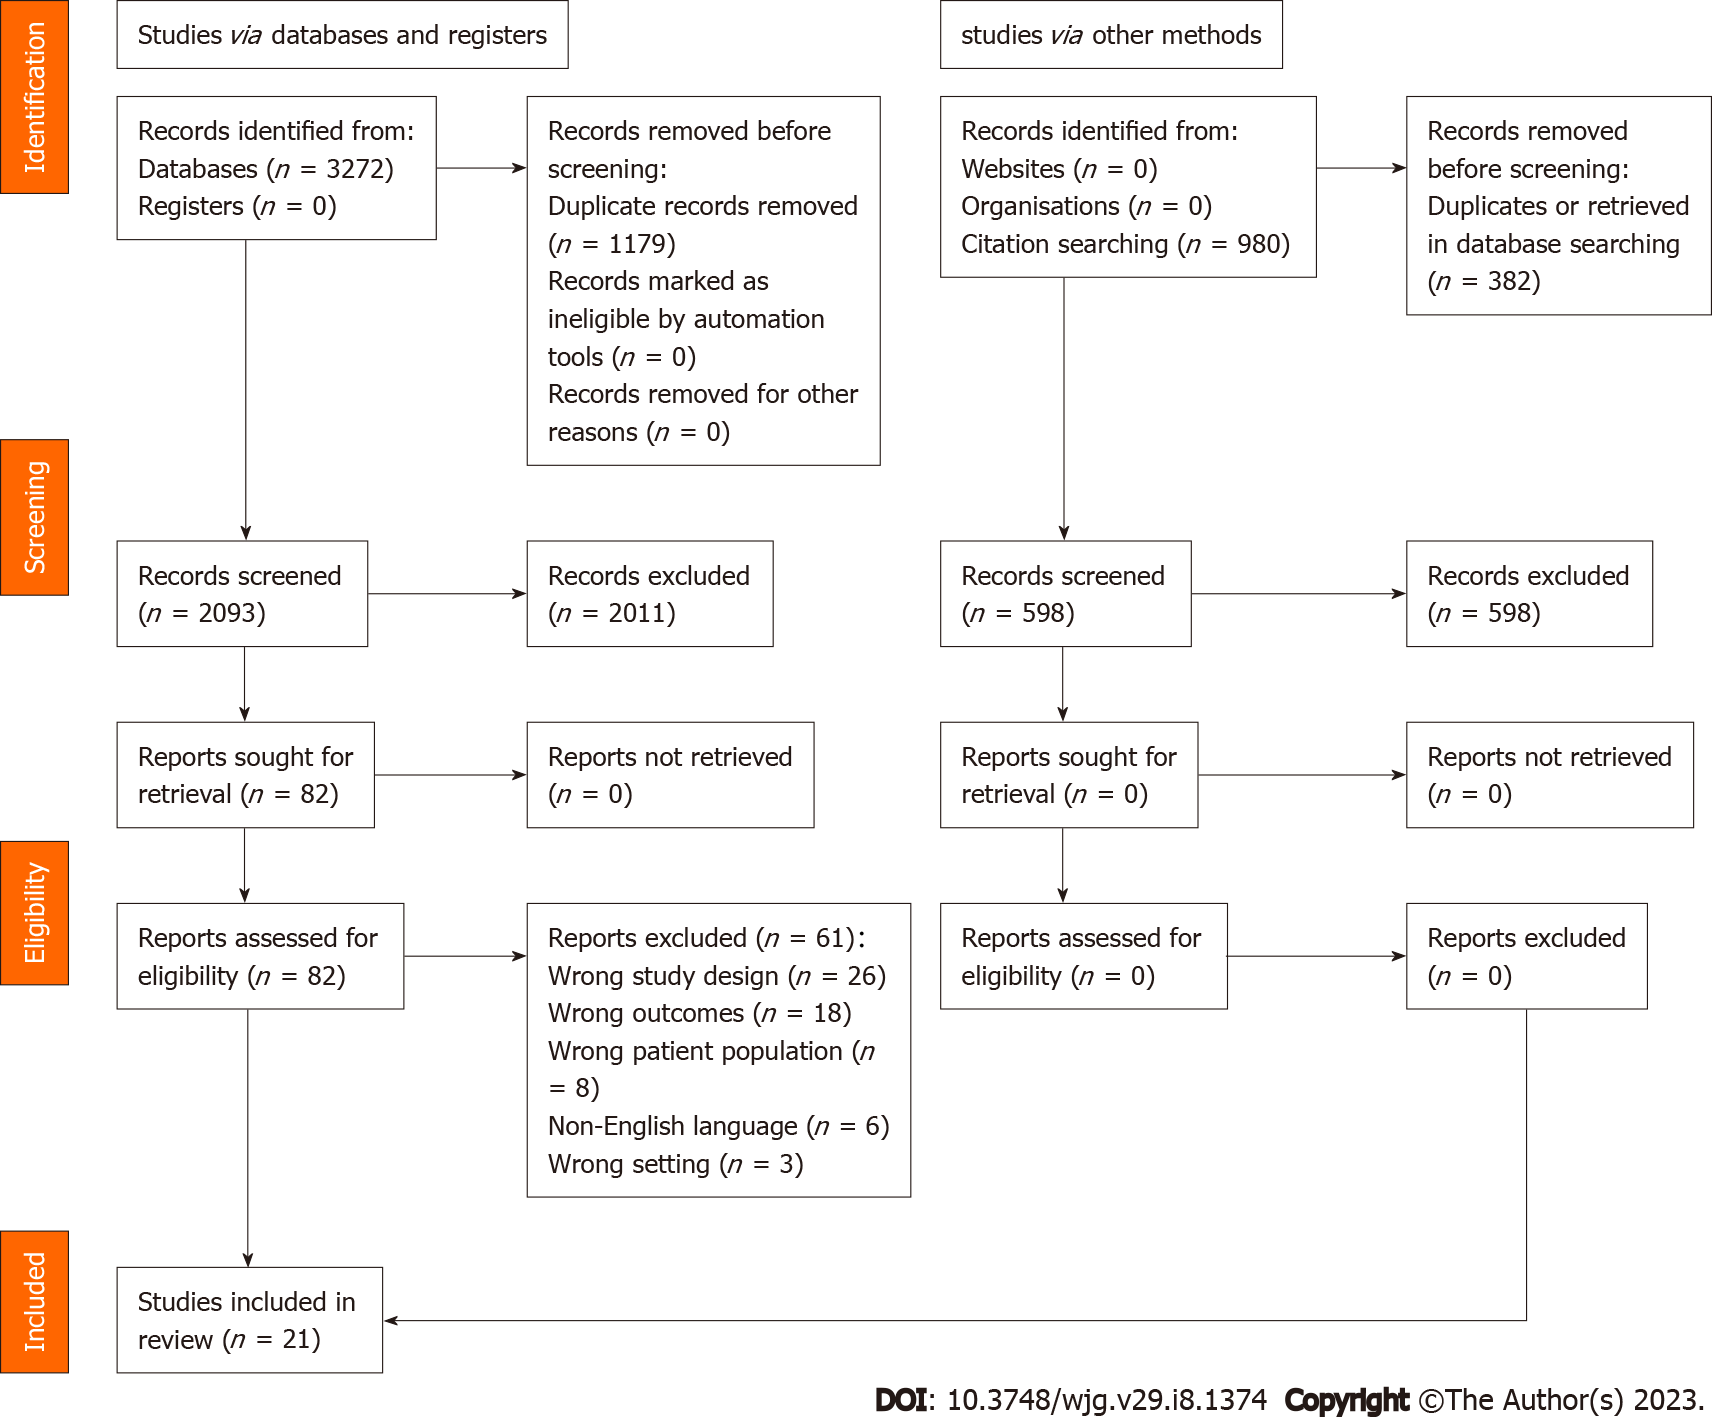
Figure 1 PRISMA flow diagram describing study selection.
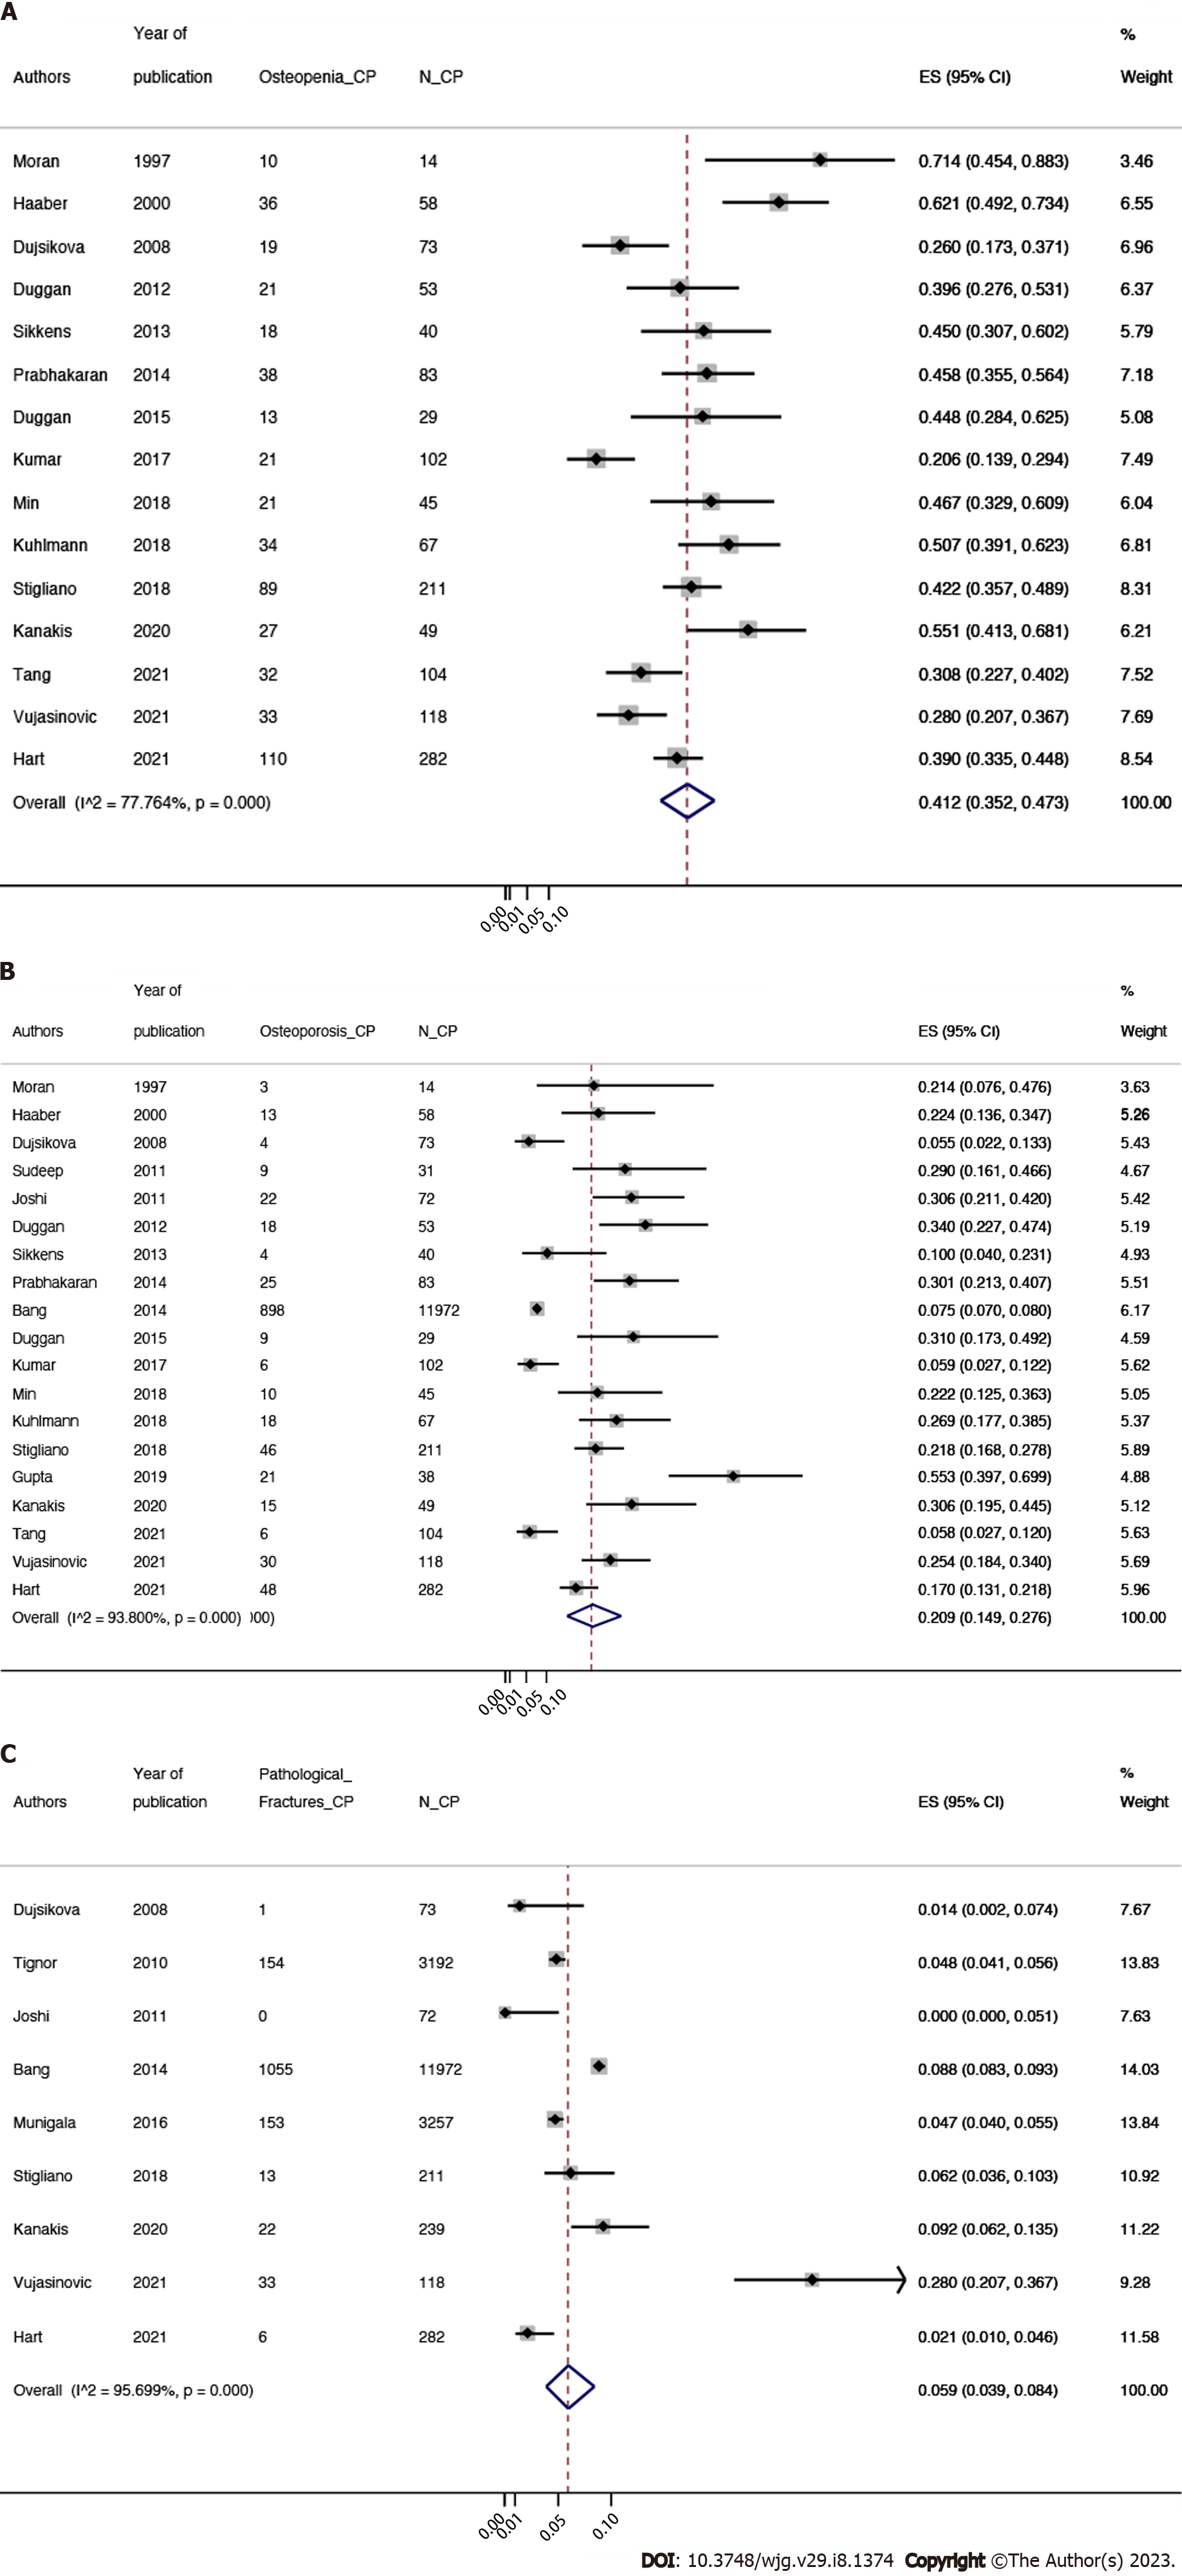
Figure 2 Forest plot demonstrating pooled prevalence of bone disease in chronic pancreatitis.
A: Forest plot demonstrating pooled prevalence of osteopenia in chronic pancreatitis (CP); B: Forest plot demonstrating pooled prevalence of osteoporosis in CP; C: Forest plot demonstrating pooled prevalence of fragility fractures in CP. ES: Effect size; N: Total chronic pancreatitis population.
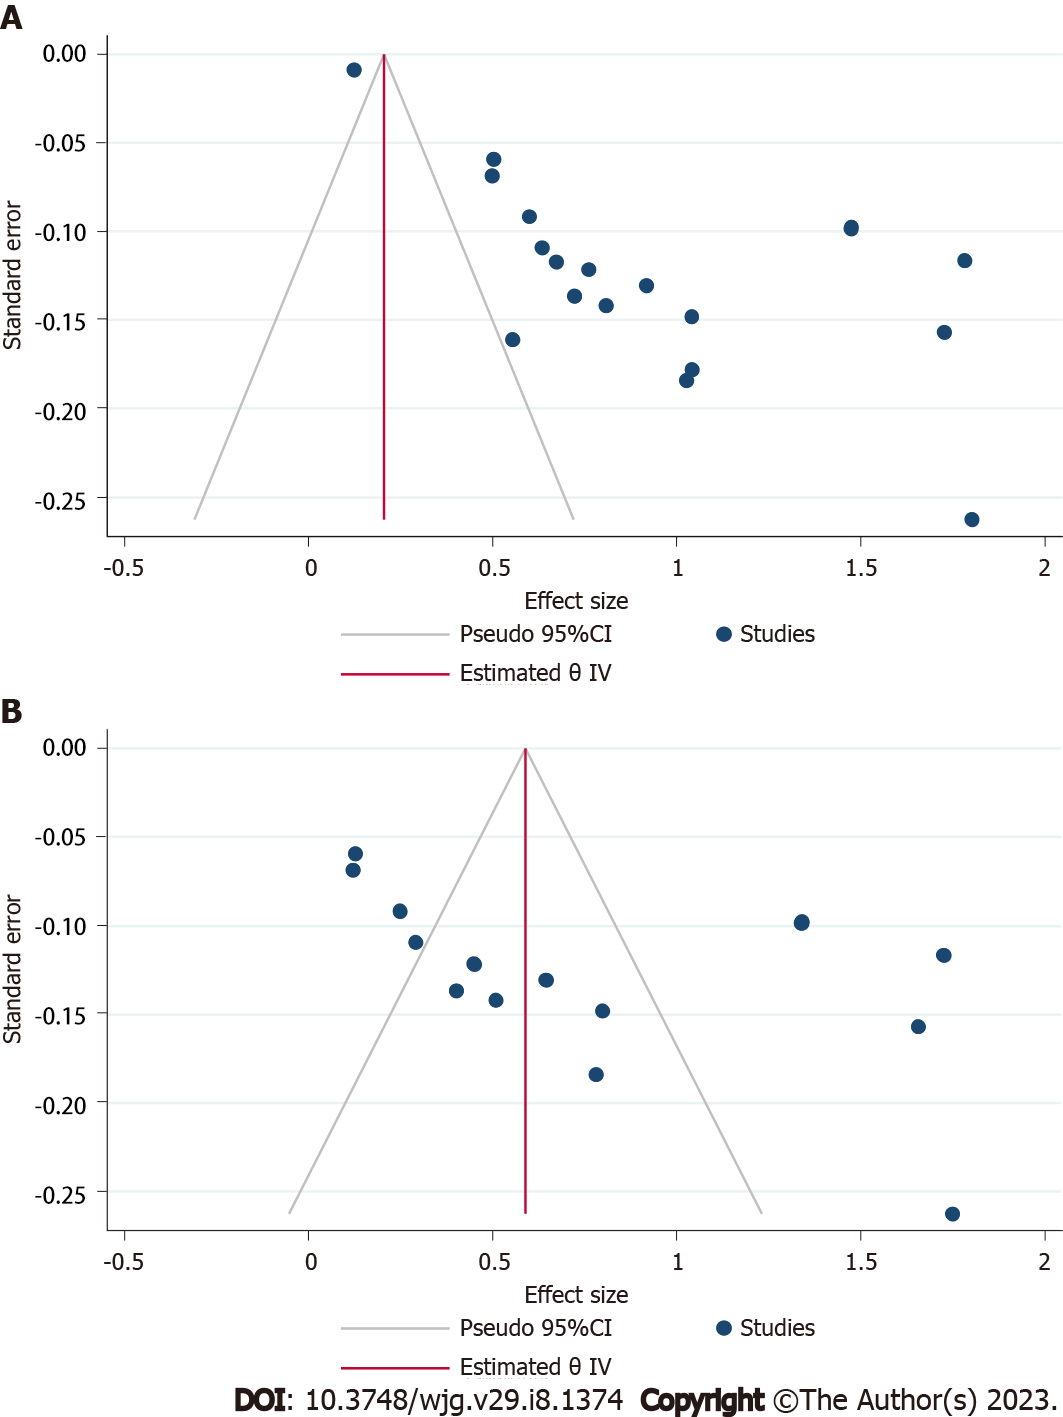
Figure 3 Funnel plots showing the publication bias assessment in studies describing patients with osteopenia and osteoporosis.
A: Osteopenia (Z = 2.9, P = 0.003); B: Osteoporosis (Z = 4.7, P < 0.001).
- Citation: Chhoda A, Hernandez-Woodbine MJ, Addo NAA, Nasir SA, Grimshaw A, Gunderson C, Ahmed A, Freedman SD, Sheth SG. Burden of bone disease in chronic pancreatitis: A systematic review and meta-analysis. World J Gastroenterol 2023; 29(8): 1374-1394
- URL: https://www.wjgnet.com/1007-9327/full/v29/i8/1374.htm
- DOI: https://dx.doi.org/10.3748/wjg.v29.i8.1374


