Copyright
©The Author(s) 2023.
World J Gastroenterol. Feb 28, 2023; 29(8): 1315-1329
Published online Feb 28, 2023. doi: 10.3748/wjg.v29.i8.1315
Published online Feb 28, 2023. doi: 10.3748/wjg.v29.i8.1315
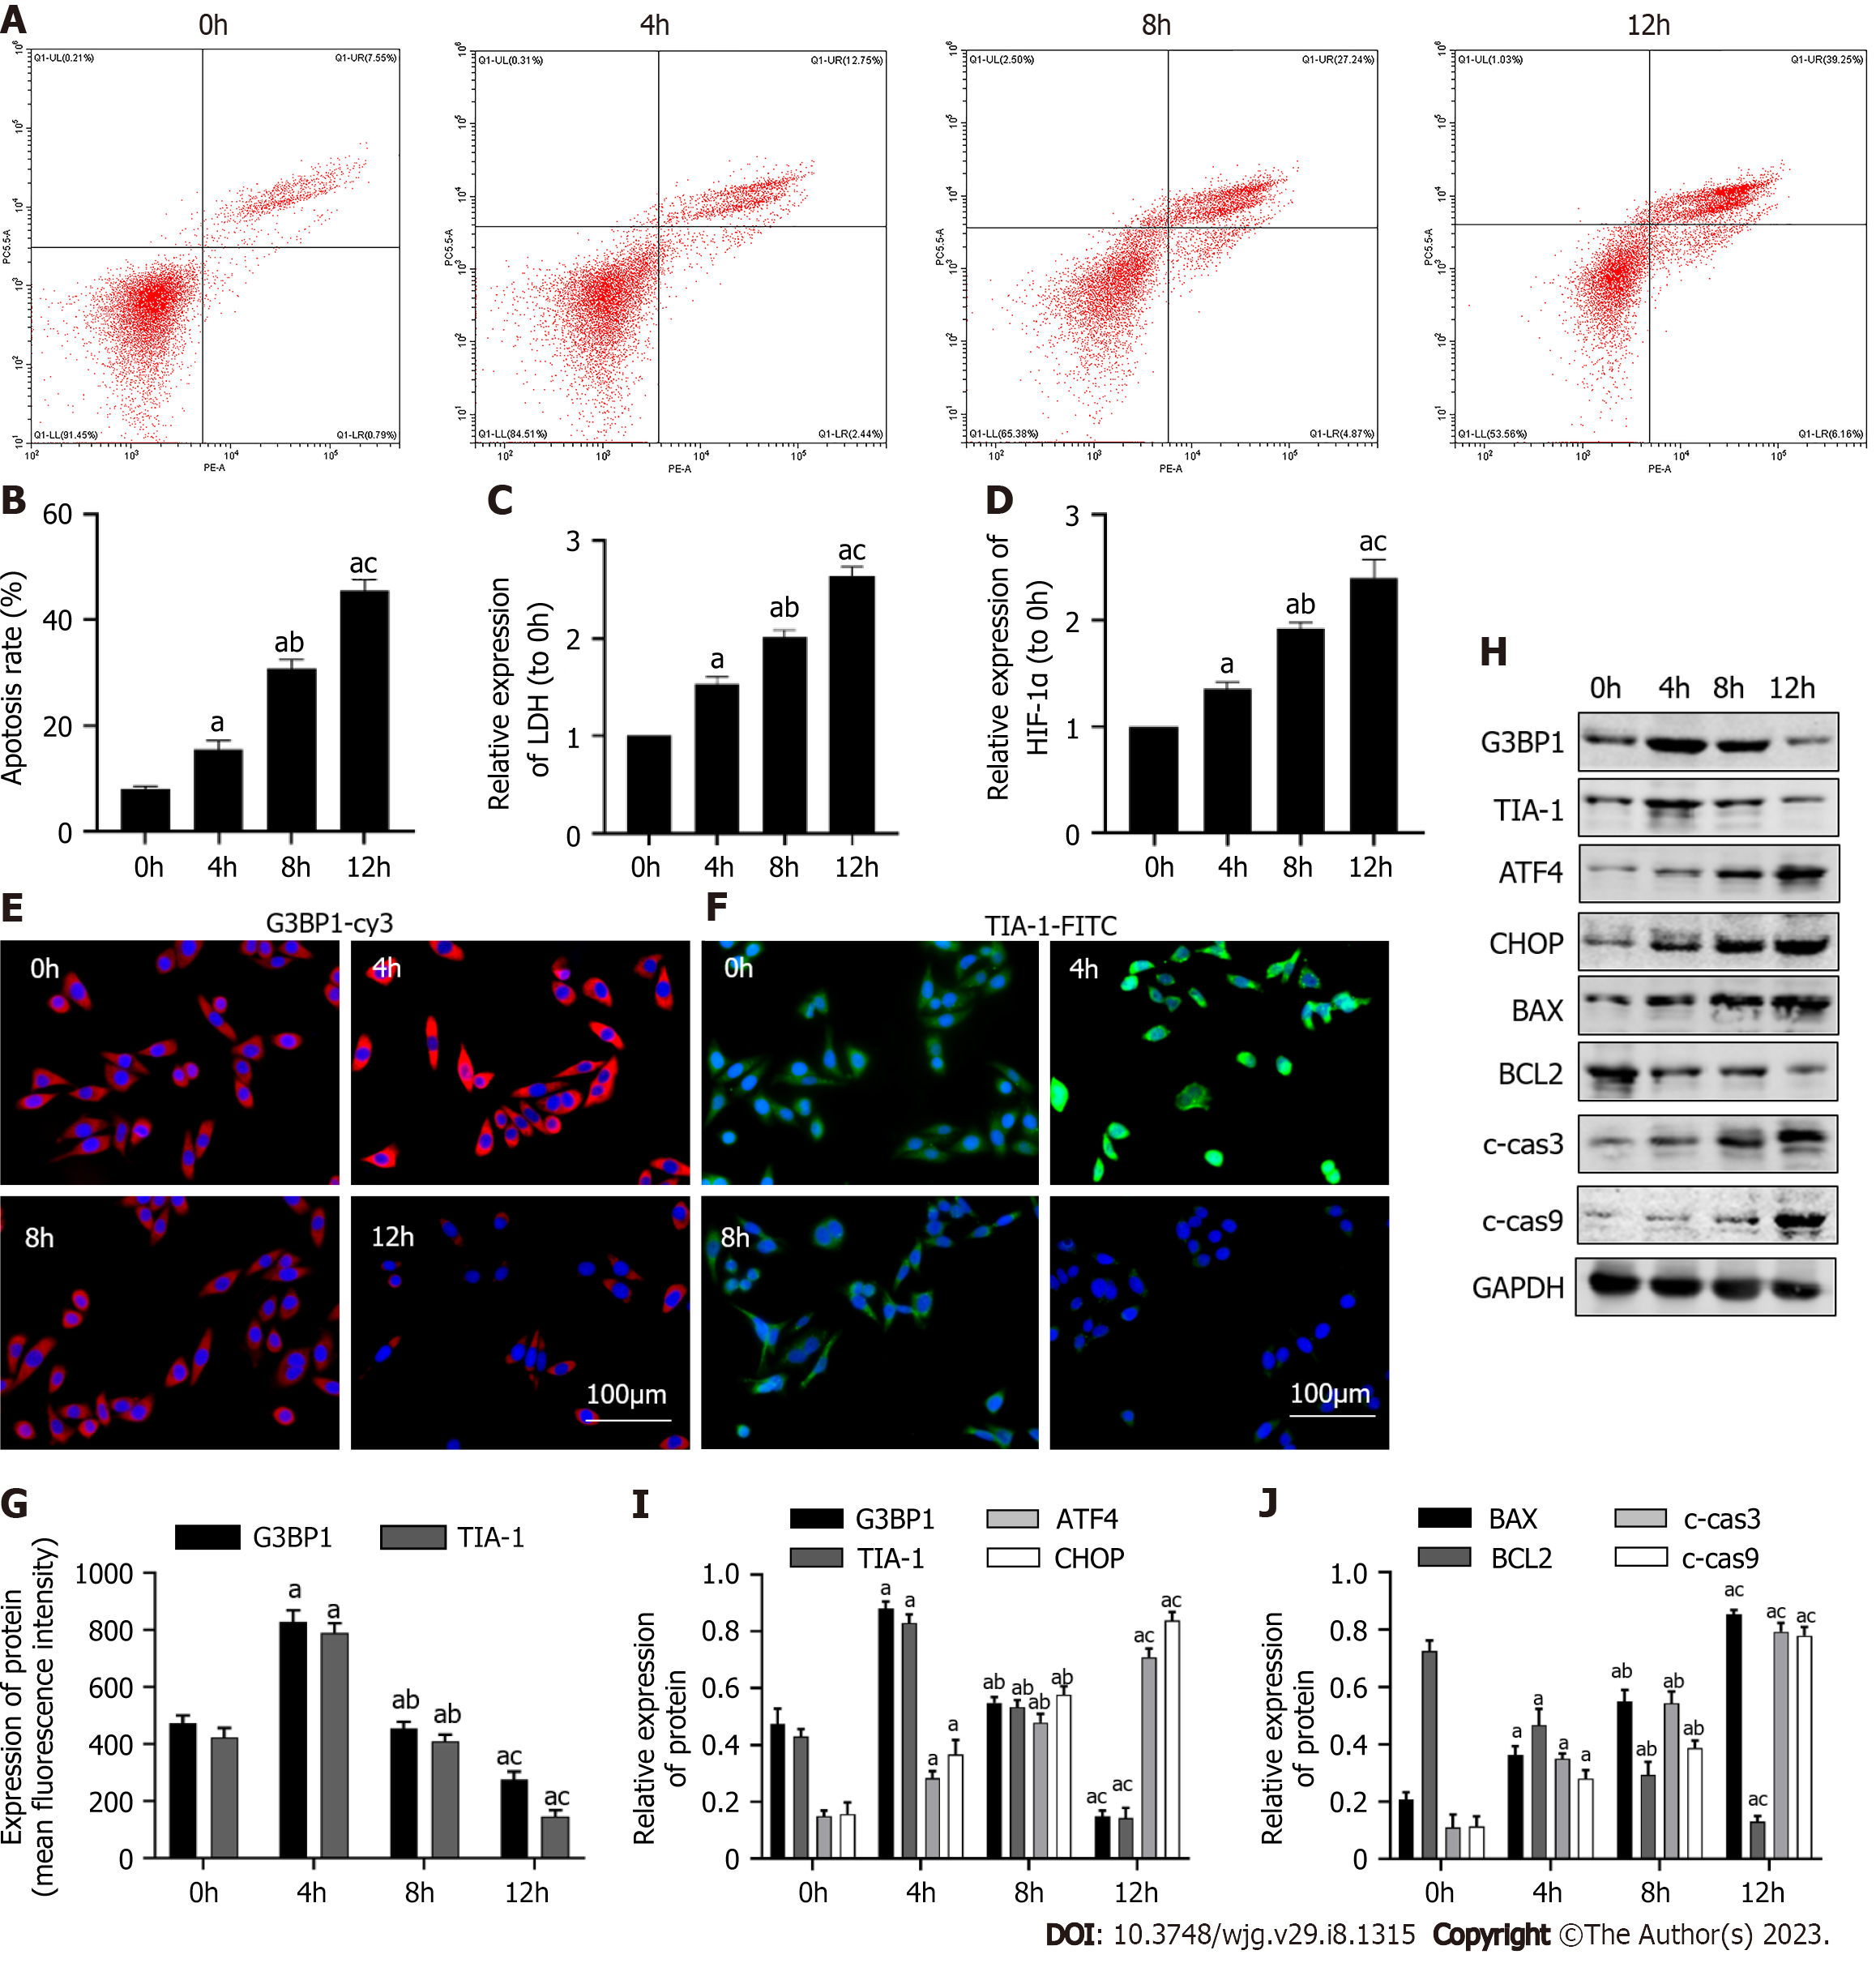
Figure 1 Changes of stress granules, endoplasmic reticulum stress and apoptosis levels with the change of hypoxia time.
A and B: The level of apoptosis was detected by flow cytometry; C and D: The detection kits were used to evaluate the content of HIF-1α in homogenates, lactate dehydrogenase in cell supernatant; E: The expression of G3BP1 in cells was detected by immunofluorescence; F: The expression of TIA-1 in cells was detected by immunofluorescence; G: The histogram displays the amount of molecules expression; H-J: The protein expression levels of G3BP1, TIA-1, ATF4, CHOP, BAX, BCL2, c-cas3 and c-cas9 was detected by western blot. n = 3. Data was shown mean ± SD. aP < 0.05 vs 0 h group; bP < 0.05 vs 4 h group; cP < 0.05 vs 8 h group.
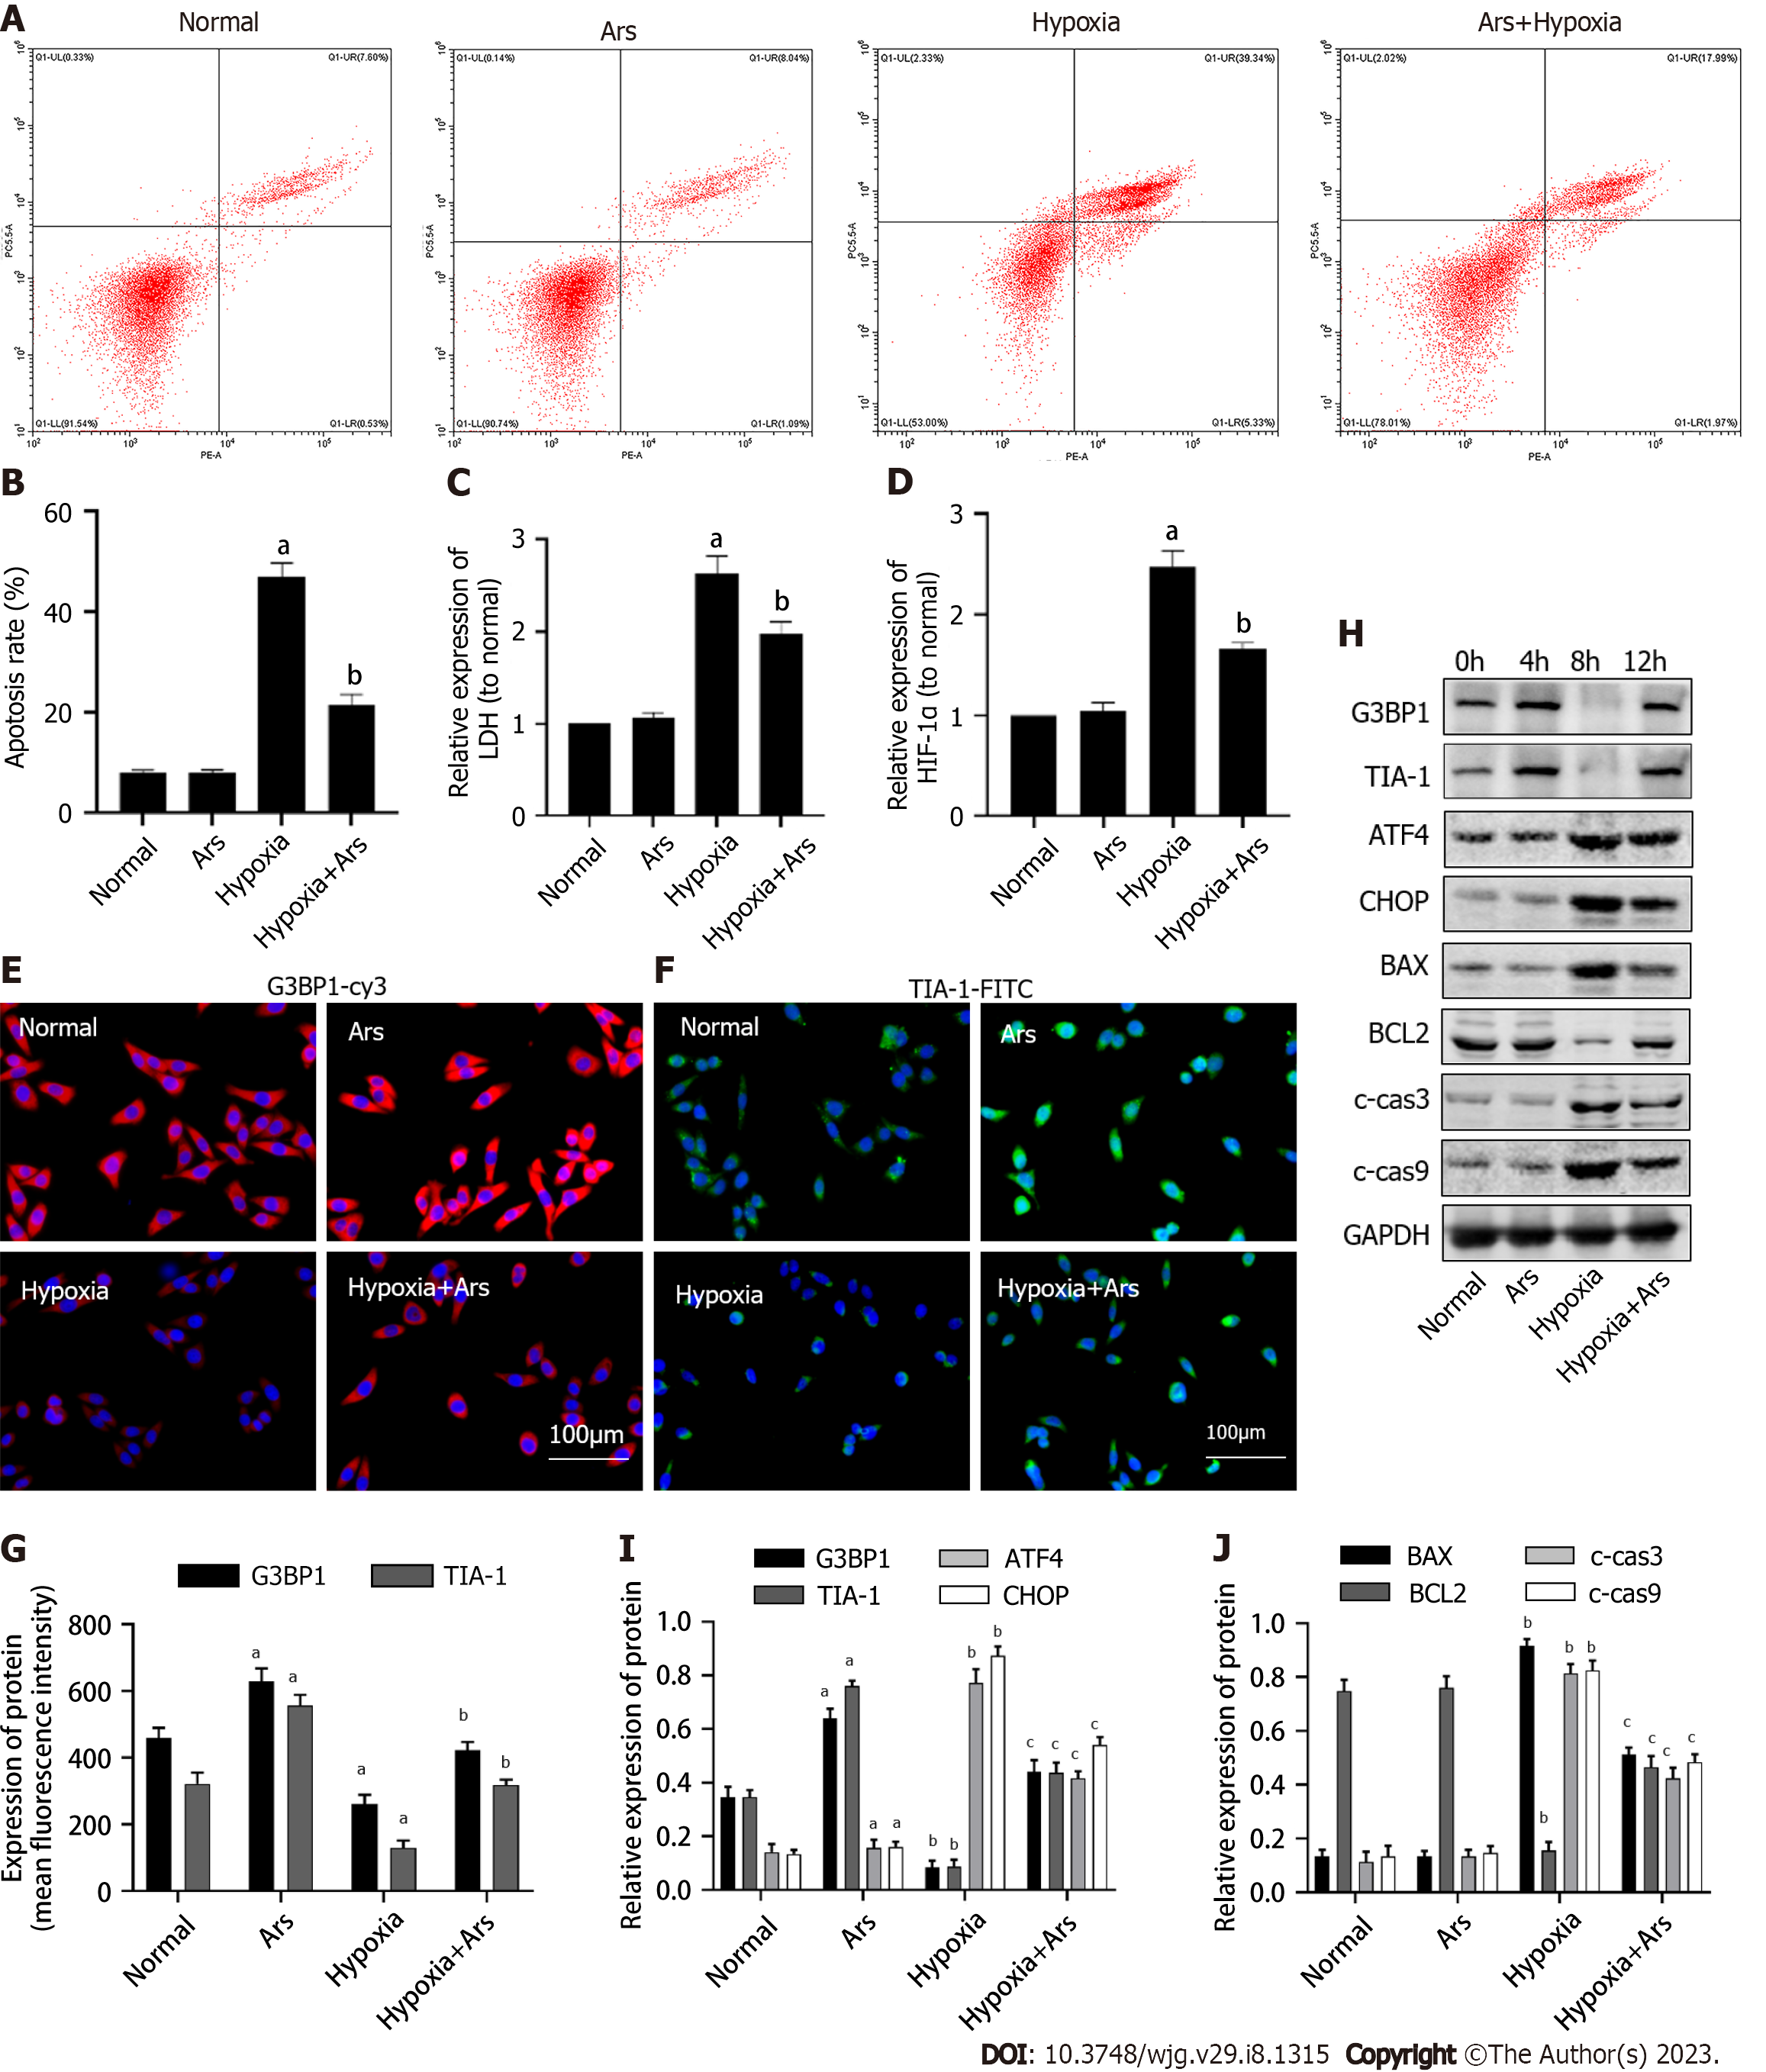
Figure 2 Effects of stress granules agonist on endoplasmic reticulum stress and apoptosis in hepatocyte hypoxia model.
A and B: The level of apoptosis was detected by flow cytometry; C and D: The detection kits were used to evaluate the content of HIF-1α in homogenates, lactate dehydrogenase in cell supernatant; E: The expression of G3BP1 in cells was detected by immunofluorescence; F: The expression of TIA-1 in cells was detected by immunofluorescence; G: The histogram displays the amount of molecules expression; H-J: The protein expression levels of G3BP1, TIA-1, ATF4, CHOP, BAX, BCL2, c-cas3 and c-cas9 was detected by western blot. n = 3. Data was shown mean ± SD. aP < 0.05 vs normal group; bP < 0.05 vs hypoxia group.
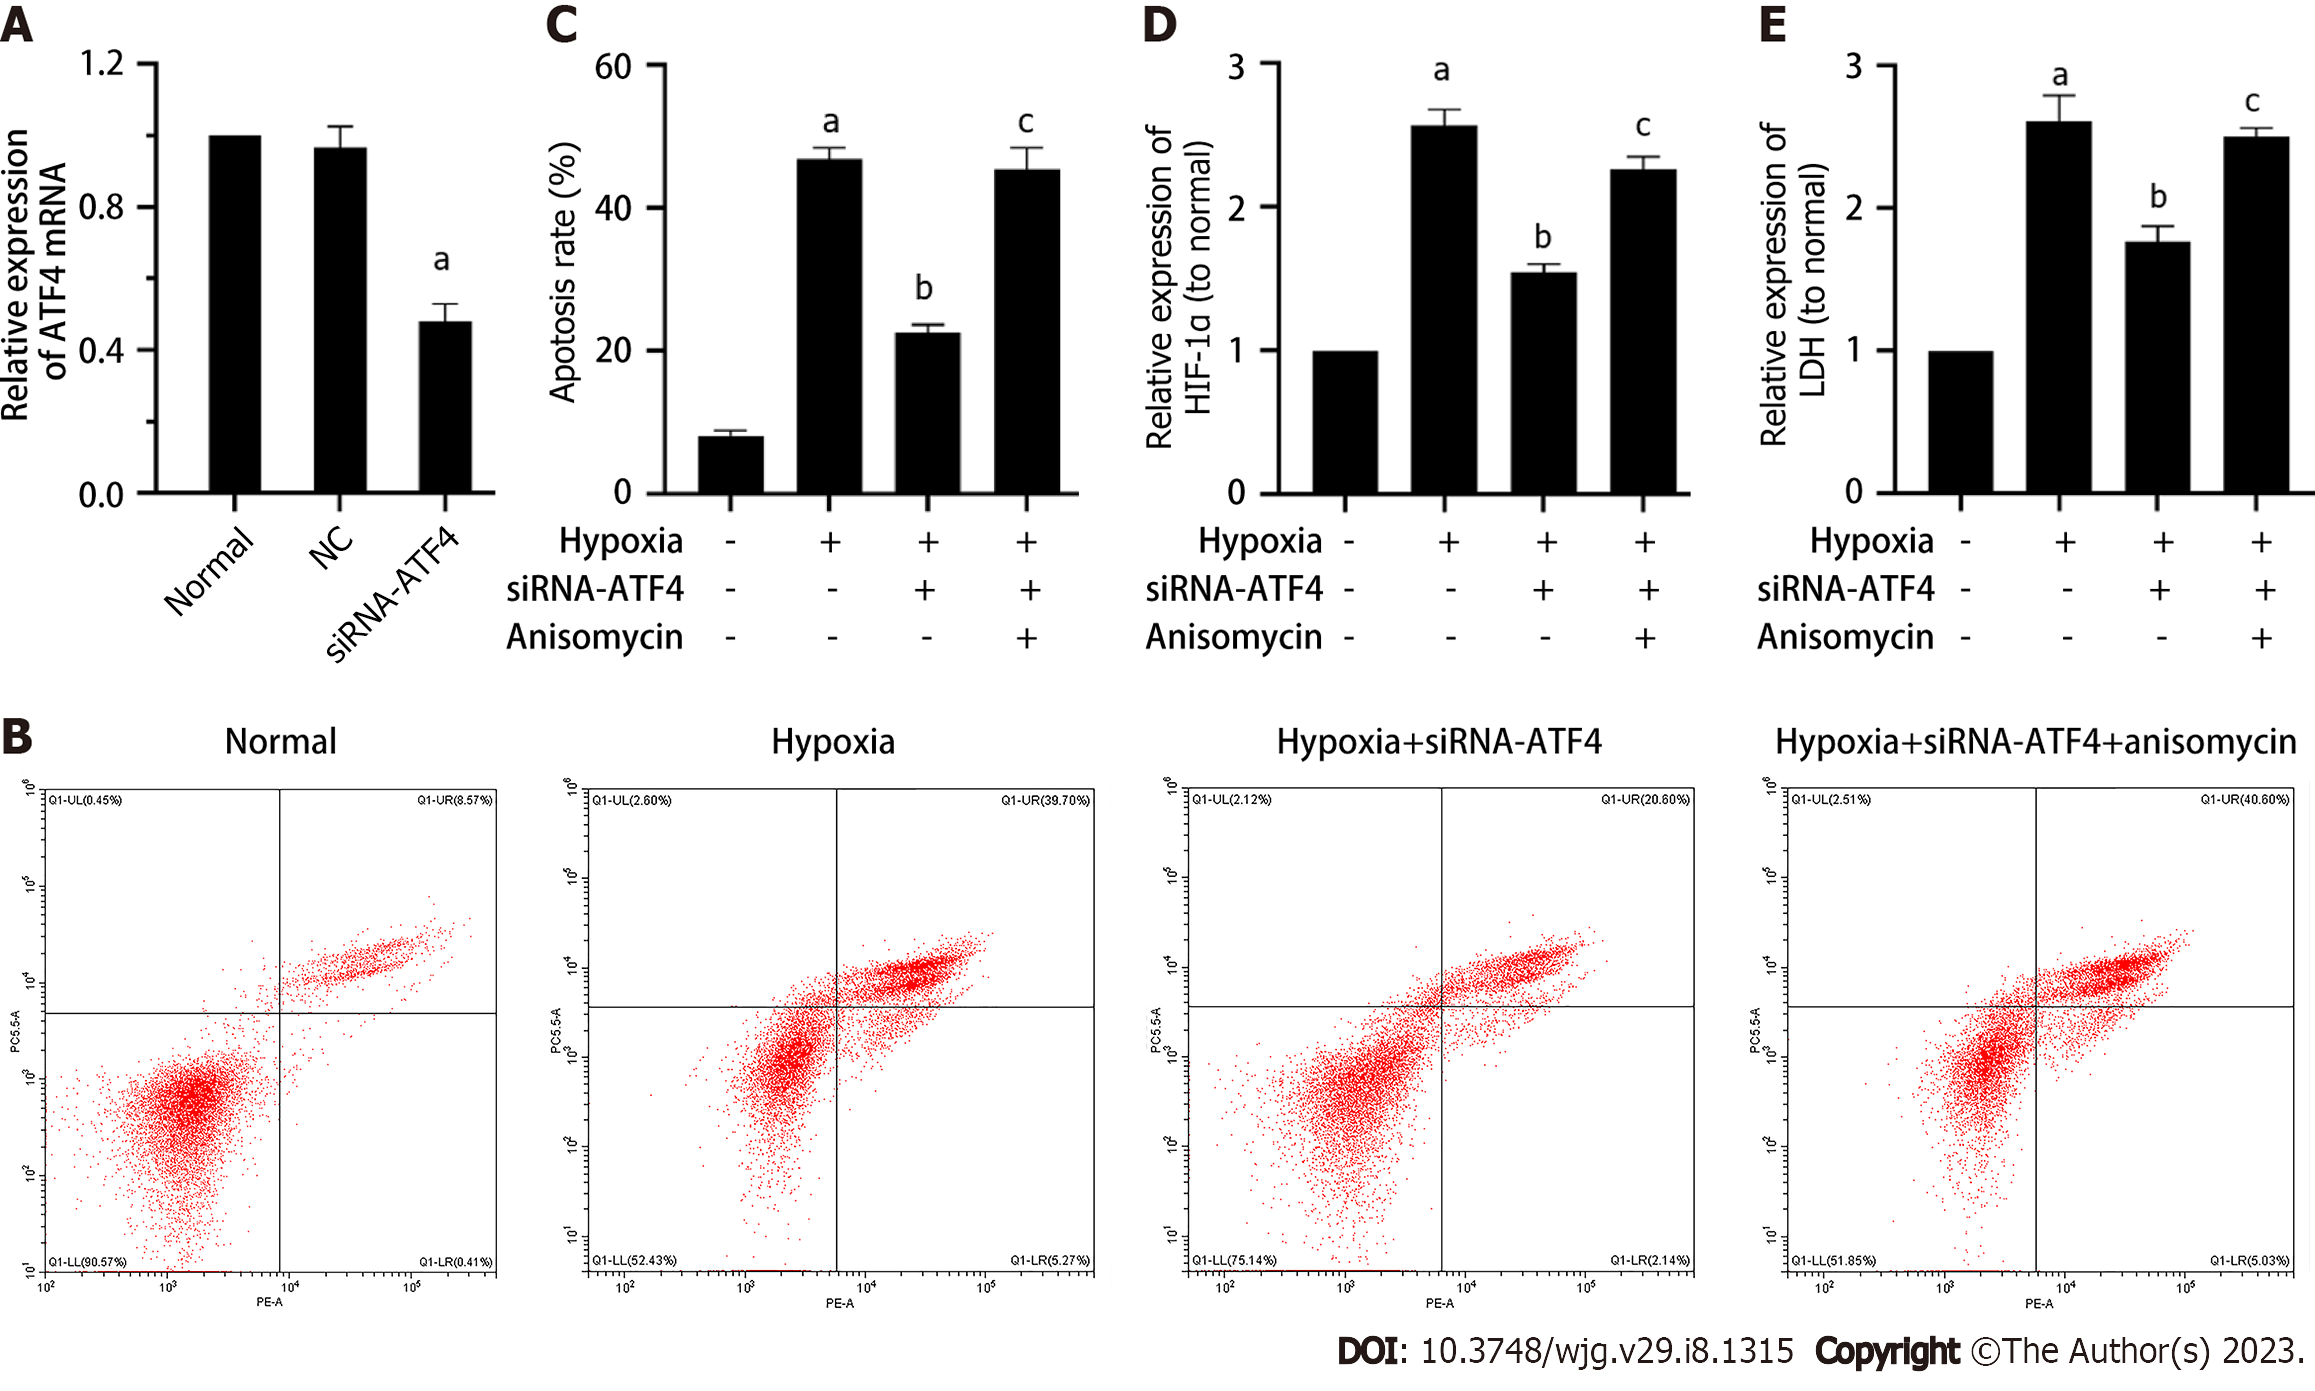
Figure 3 Effect of stress granules on apoptosis, HIF-1α, and lactate dehydrogenase in hepatocyte hypoxia model through endoplasmic reticulum stress.
A: The level of mRNA in cells was detected by quantitative real-time polymerase chain reaction; B and C: The level of apoptosis was detected by flow cytometry; D-E: The detection kits were used to evaluate the content of HIF-1α in homogenates, lactate dehydrogenase in cell supernatant. n = 3. Data was shown mean ± SD. aP < 0.05 vs normal group; bP < 0.05 vs hypoxia group; cP < 0.05 vs hypoxia + siRNA-ATF4.
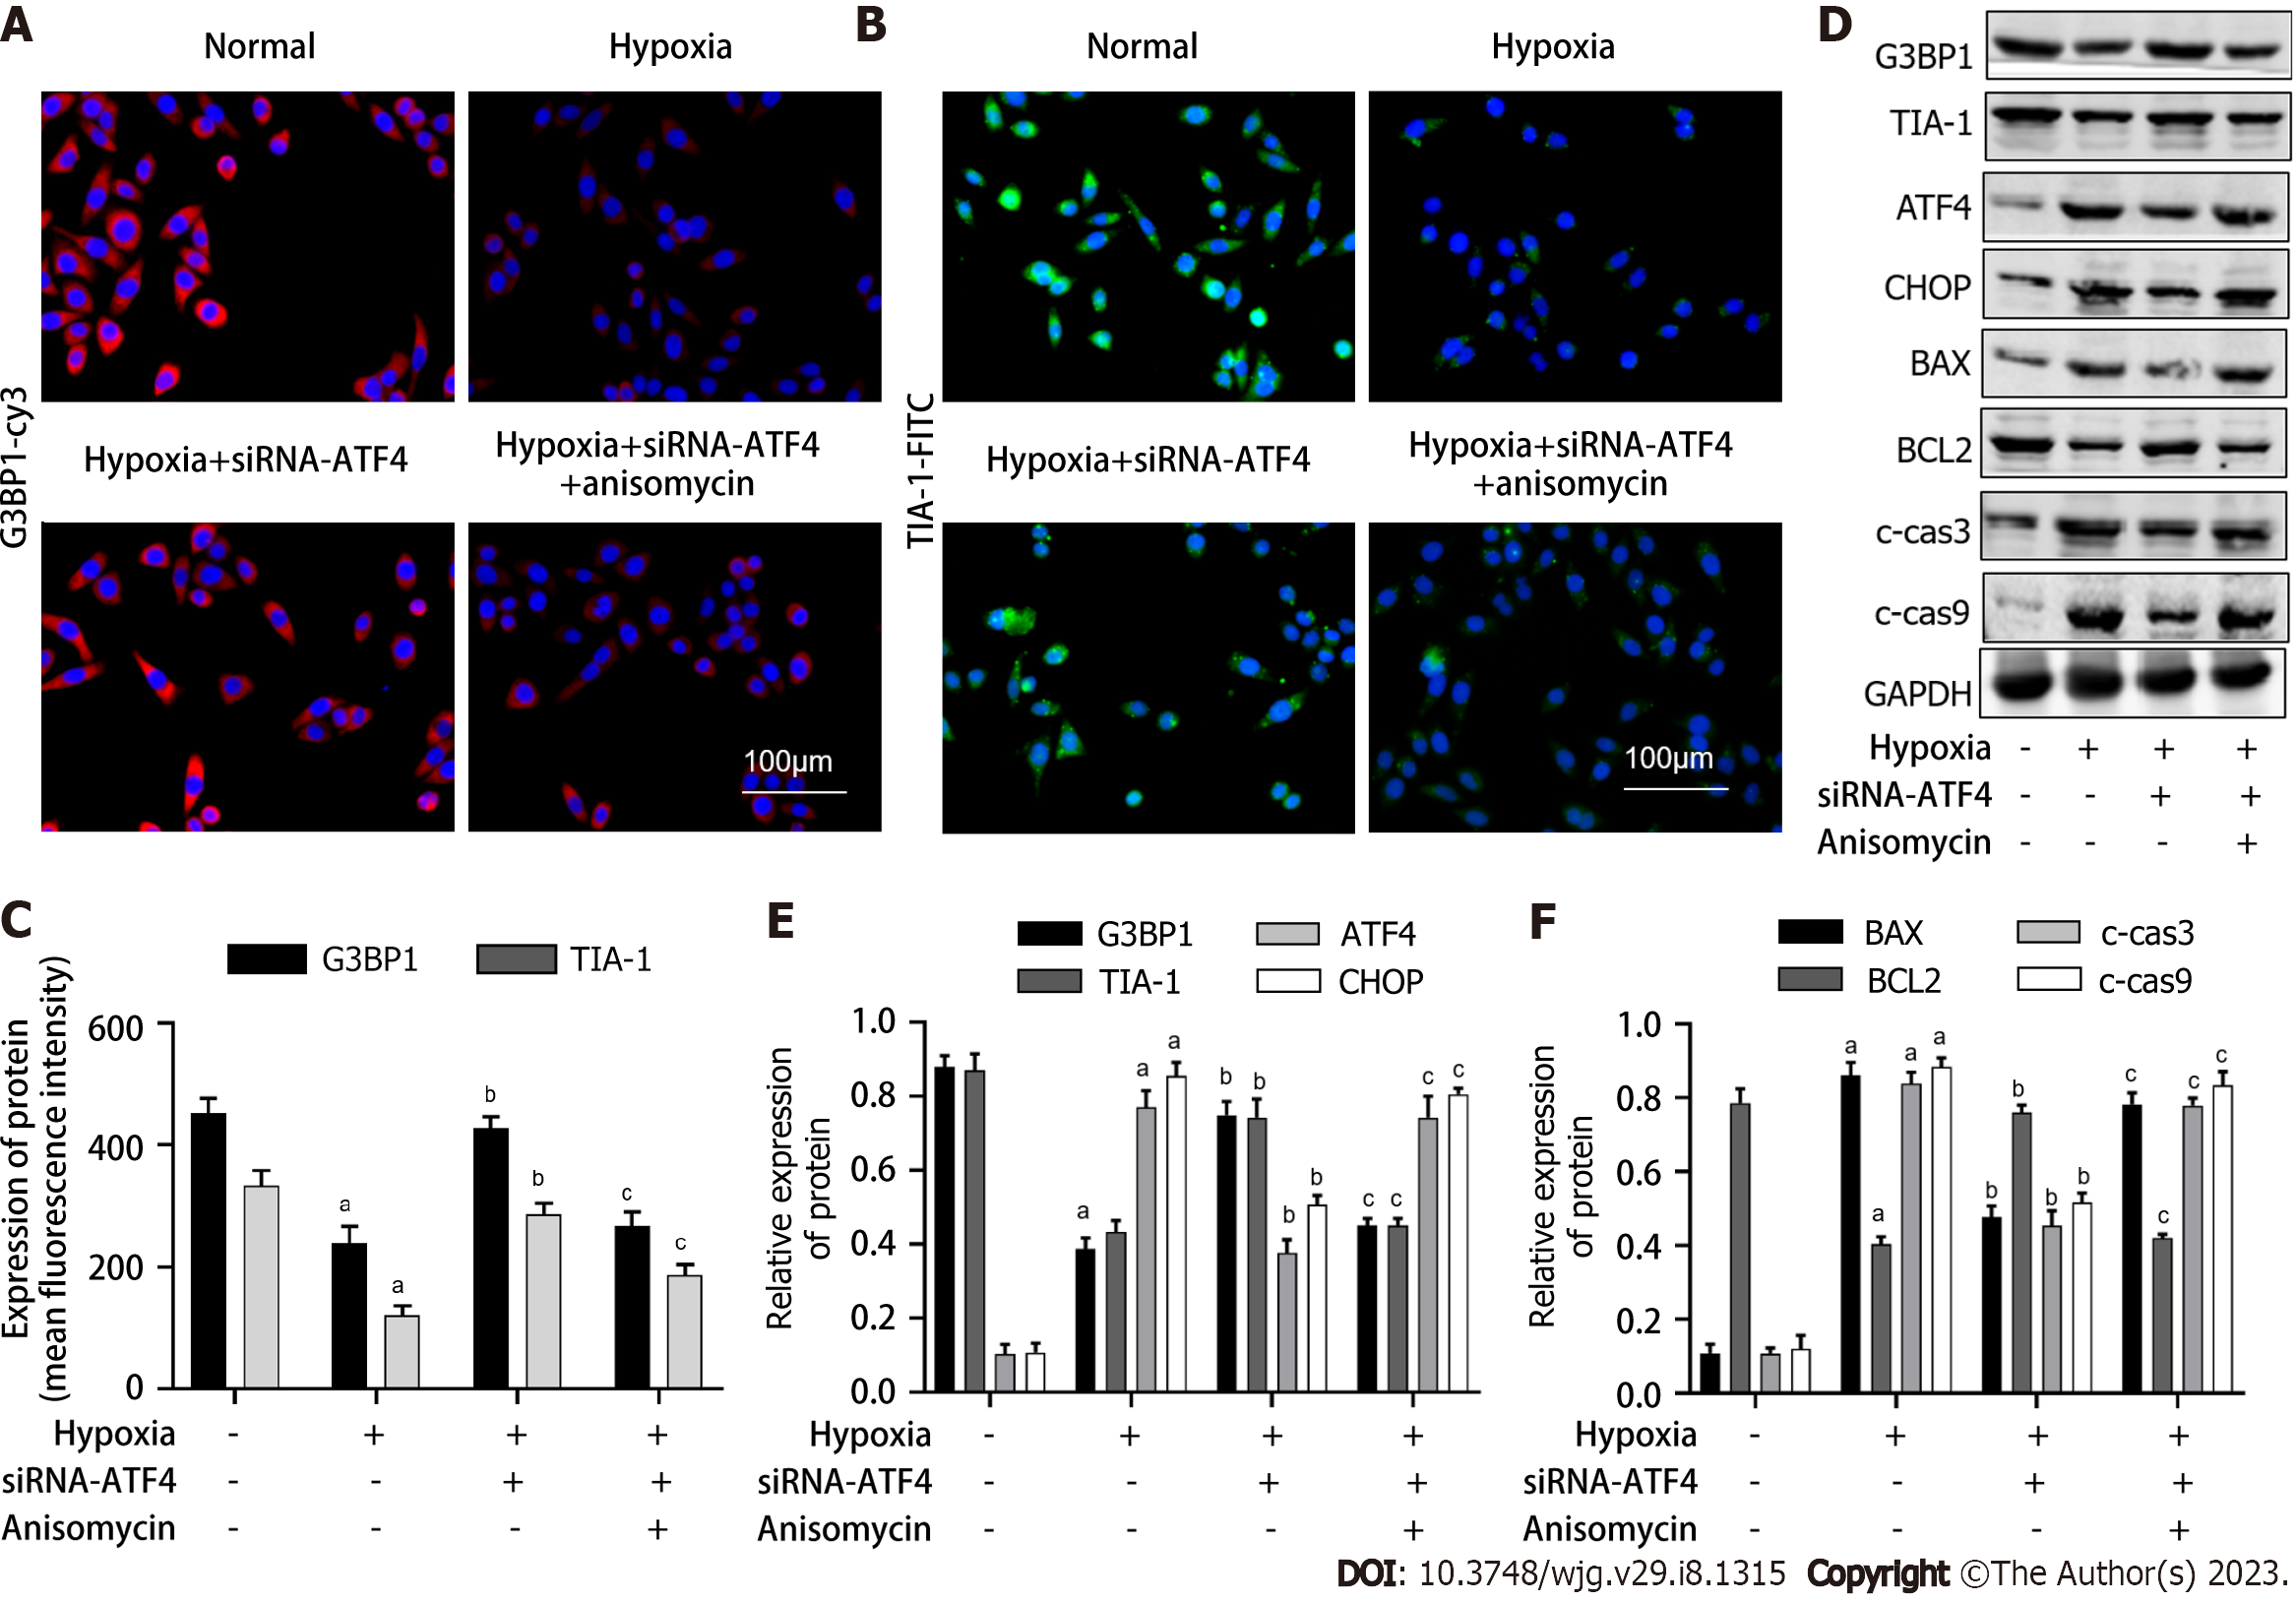
Figure 4 Effect of stress granules on G3BP1 and endoplasmic reticulum stress related molecules in hepatocyte hypoxia model through endoplasmic reticulum stress.
A: The expression of G3BP1 in cells was detected by immunofluorescence; B: The expression of TIA-1 in cells was detected by immunofluorescence; C: The histogram displays the amount of molecules expression; D-F: The protein expression levels of G3BP1, TIA-1, ATF4, CHOP, BAX, BCL2, c-cas3 and c-cas9 was detected by western blot. n = 3. aP < 0.05 vs normal group; bP < 0.05 vs hypoxia group; cP < 0.05 vs hypoxia + siRNA-ATF4.
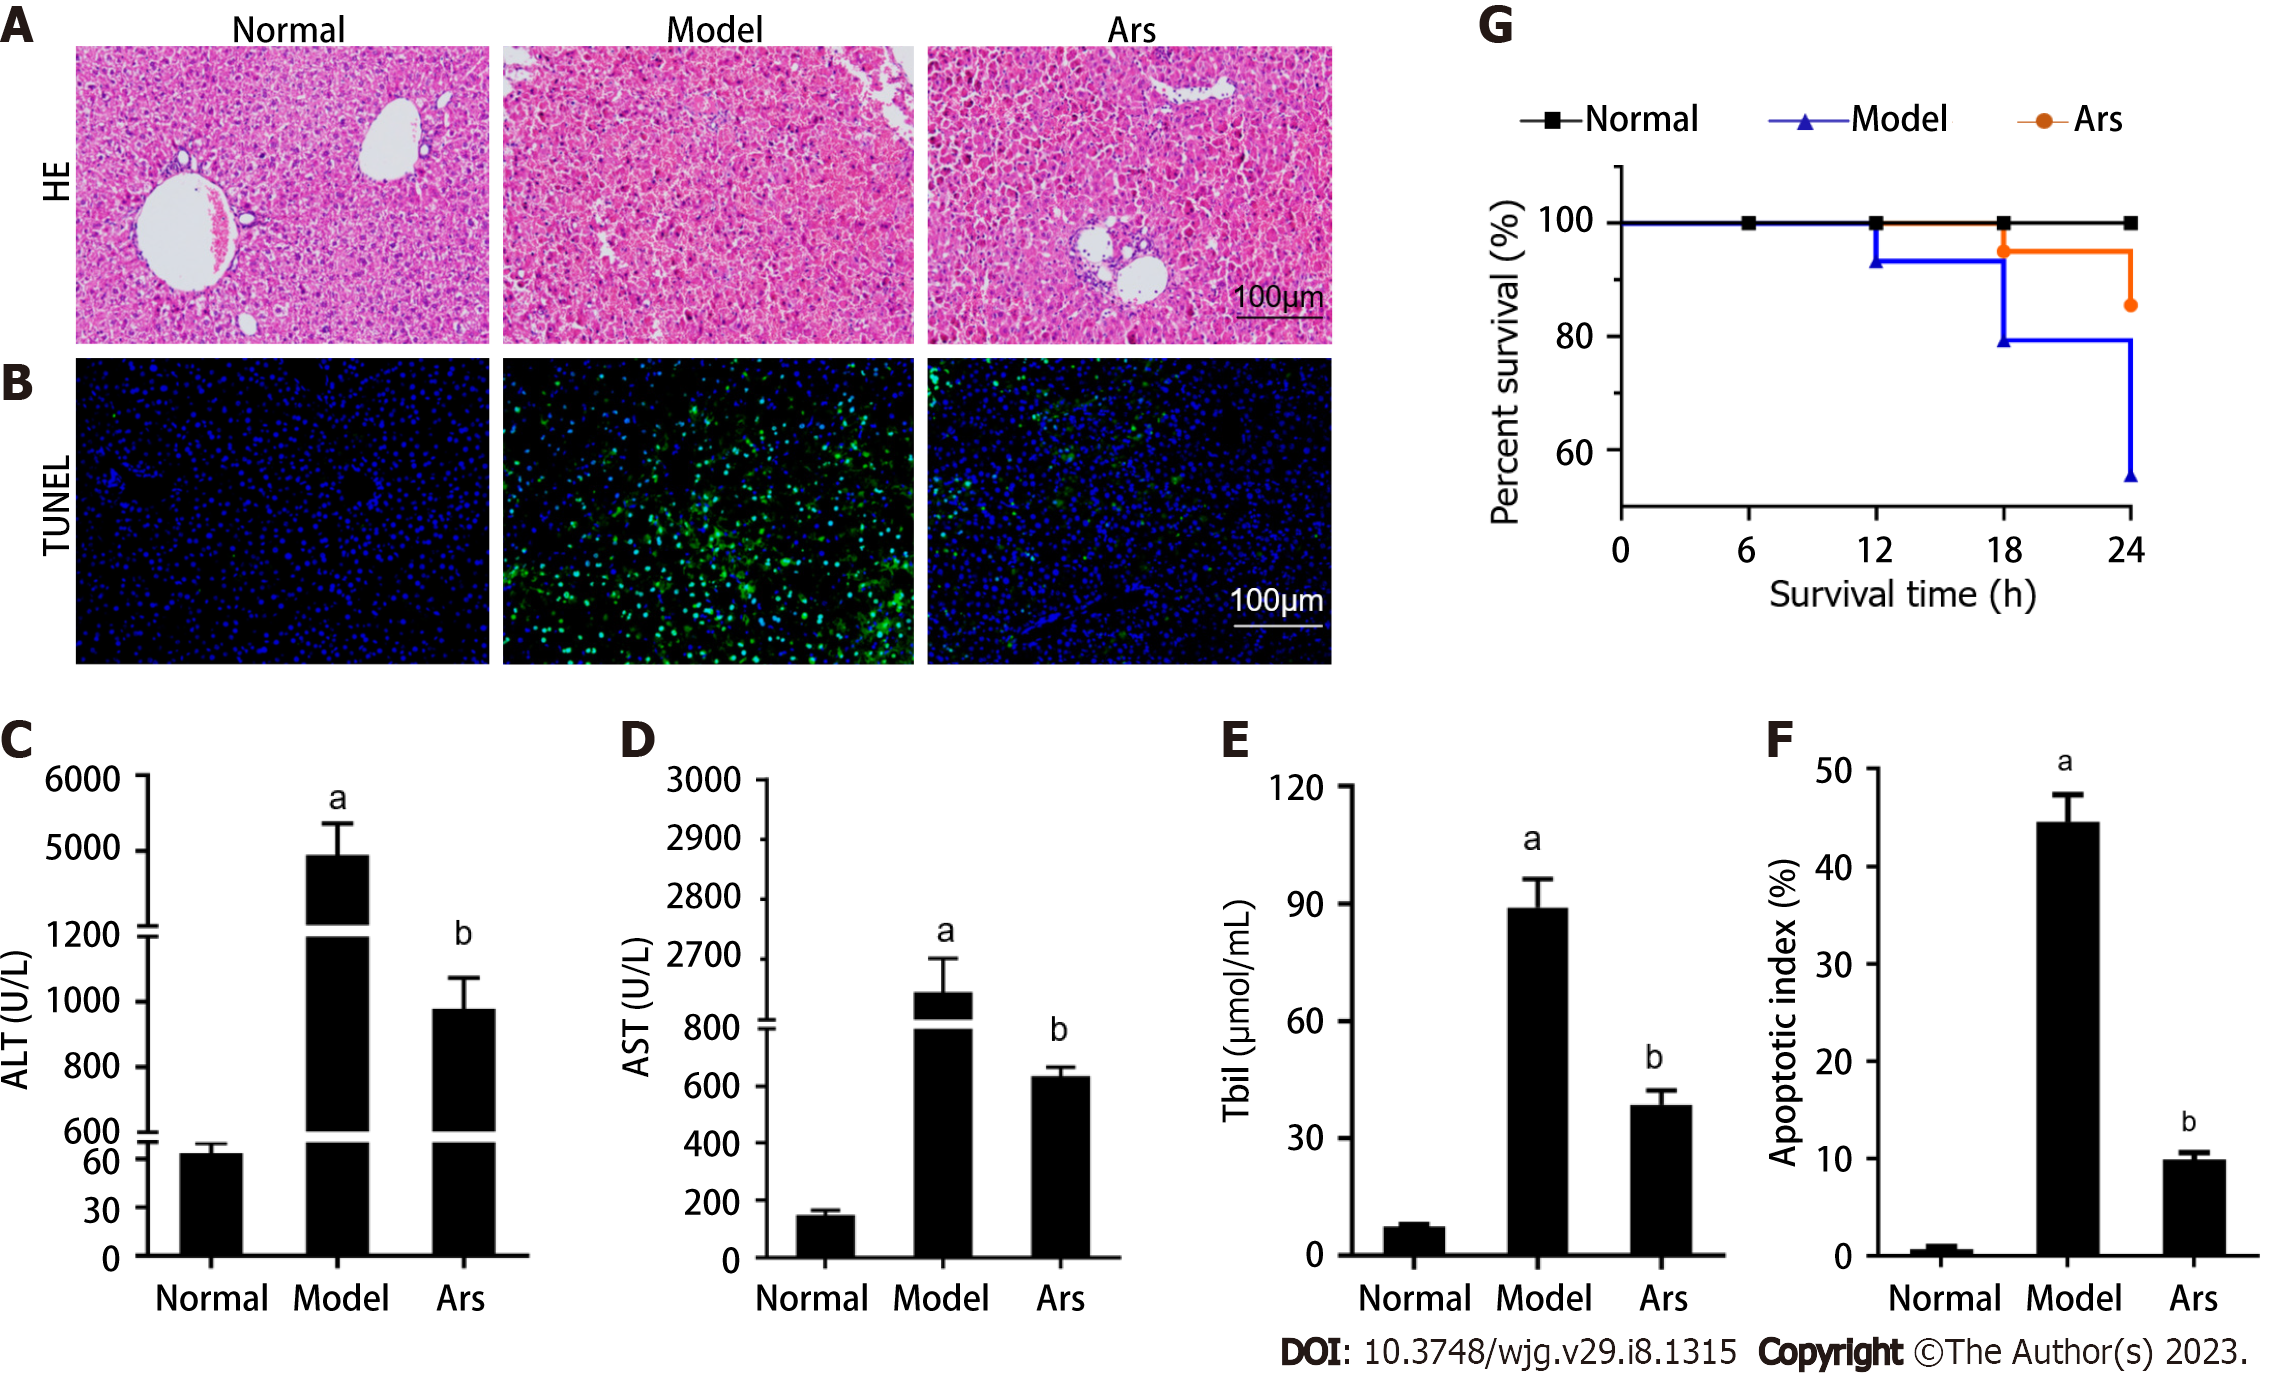
Figure 5 Effects of stress granules agonist on histopathology, apoptosis levels, liver function in acute liver failure mice.
A: Hepatic histopathological changes were detected by HE staining; B and F: TUNEL stanning was used to detected the level of apoptosis in live liver tissue; C-E: The levels of alanine aminotransferase, aspartate aminotransferase and total bilirubin in the serum of mice were detected by automatic biochemical analyzer; G: The 6 h, 12 h, 18 h, 24 h survival rates of mice in each group were observed. n = 10. Data was shown mean ± SD. aP < 0.05 vs normal group; bP < 0.05 vs model group. ALT: Alanine aminotransferase; AST: Aspartate aminotransferase; TBIL: Total bilirubin.
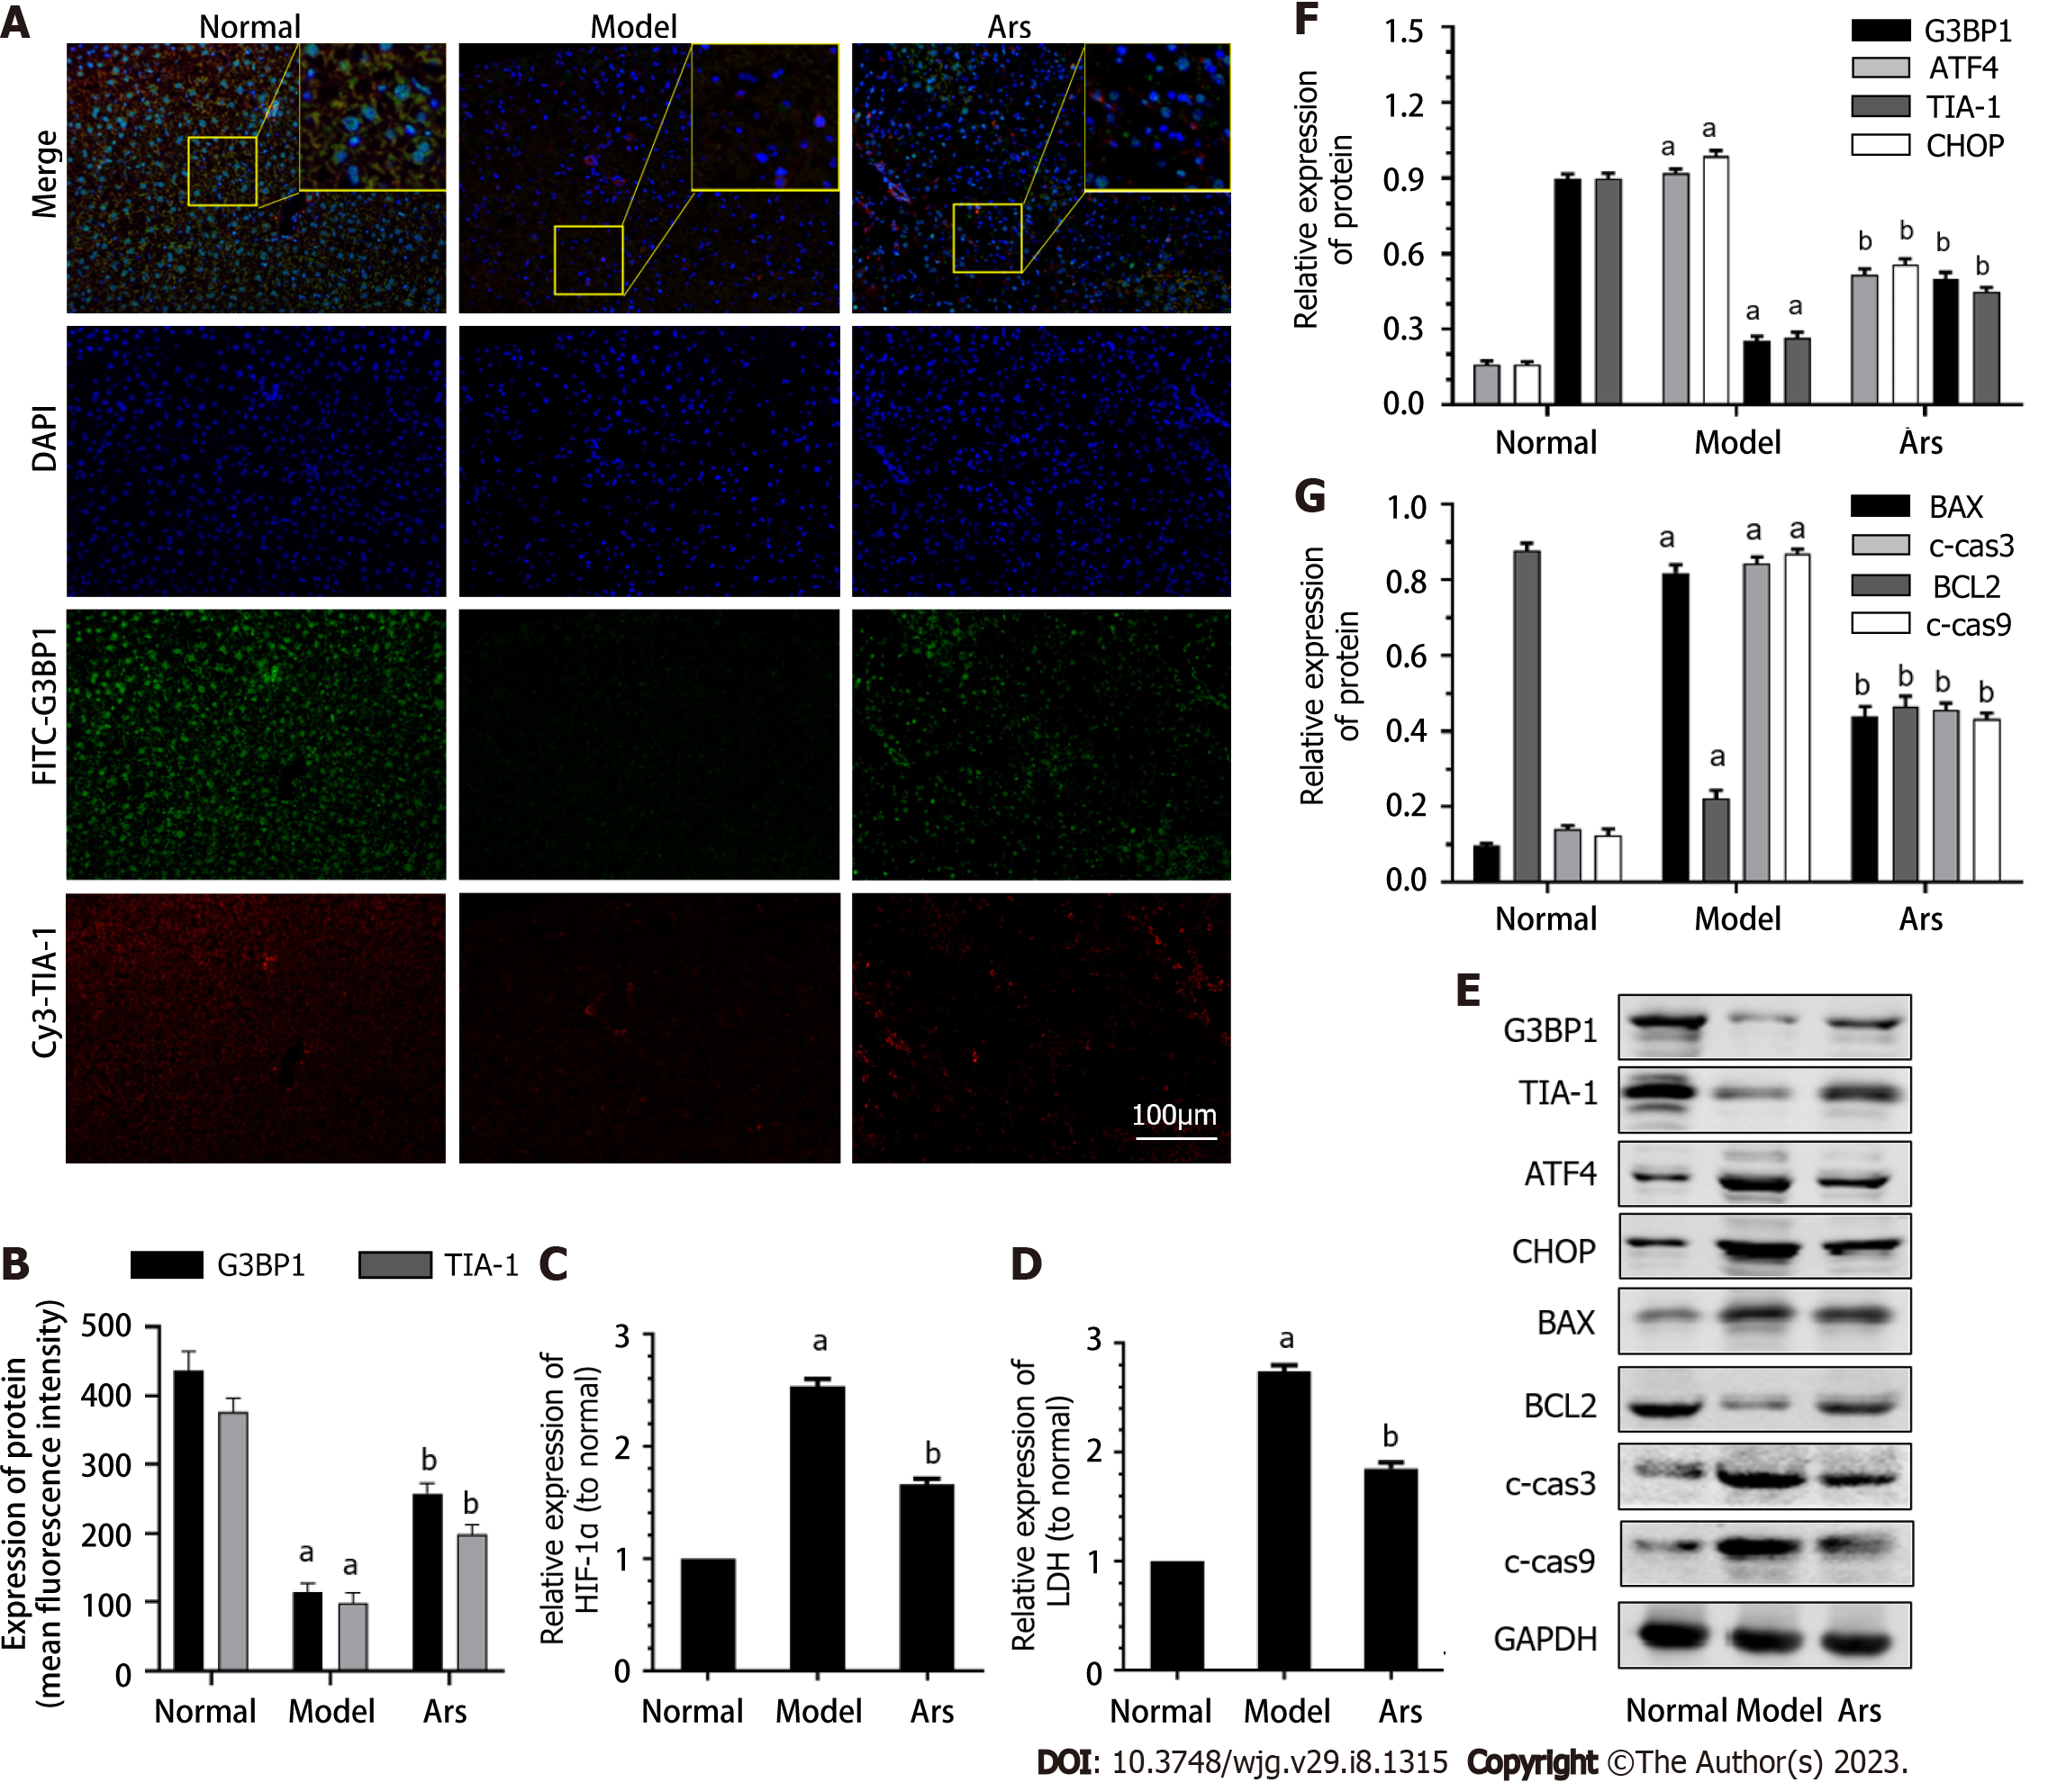
Figure 6 Effect of stress granules agonist on G3BP1, HIF-1α, lactate dehydrogenase and endoplasmic reticulum stress related molecules in acute liver failure mice liver.
A: The expression of G3BP1 and TIA-1 in liver was detected by immunofluorescence; B: The histogram displays the amount of molecules expression; C and D: The detection kits were used to evaluate the content of HIF-1α in liver tissue homogenate, lactate dehydrogenase in serum; E-G: The protein expression levels of G3BP1, TIA-1, ATF4, CHOP, BAX, BCL2, c-cas3 and c-cas9 was detected by western blot. n = 10. Data was shown mean ± SD. aP < 0.05 vs normal group; bP < 0.05 vs model group.
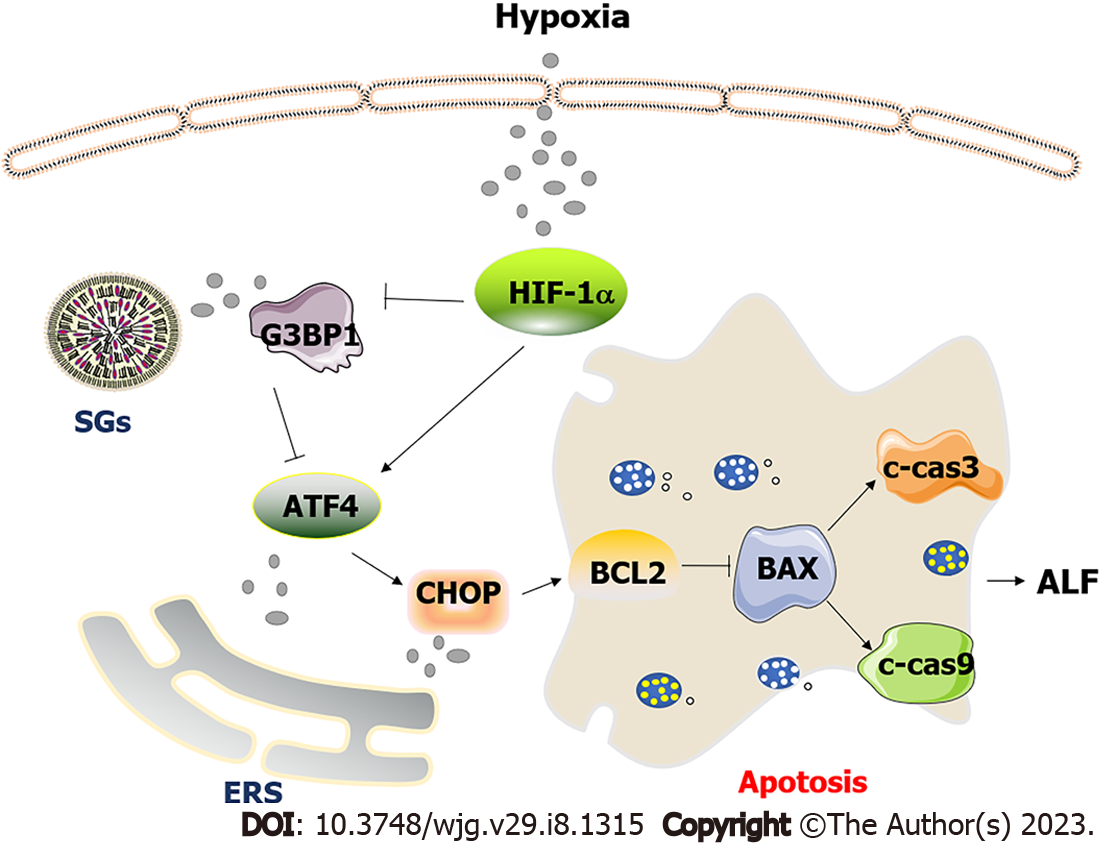
Figure 7 Graphical abstract.
In the process of acute liver failure, hepatocytes were damaged by hypoxia and ischemia injury. At this time, the content of HIF-1α in cells increased, which inhibited the formation of stress granules (SGs) mediated by G3BP1 and promoted the expression of endoplasmic reticulum stress (ERS) marker molecules ATF4 and CHOP. The activated ERS pathway further promotes hepatocyte apoptosis. Promoting SGs synthesis can inhibit the level of hepatocyte apoptosis by inhibiting the ATF4-mediated ERS pathway. SGs: Stress granules; ERS: Endoplasmic reticulum stress; ALF: Acute liver failure.
- Citation: Li WY, Yang F, Li X, Wang LW, Wang Y. Stress granules inhibit endoplasmic reticulum stress-mediated apoptosis during hypoxia-induced injury in acute liver failure. World J Gastroenterol 2023; 29(8): 1315-1329
- URL: https://www.wjgnet.com/1007-9327/full/v29/i8/1315.htm
- DOI: https://dx.doi.org/10.3748/wjg.v29.i8.1315


