Copyright
©The Author(s) 2023.
World J Gastroenterol. Feb 21, 2023; 29(7): 1235-1242
Published online Feb 21, 2023. doi: 10.3748/wjg.v29.i7.1235
Published online Feb 21, 2023. doi: 10.3748/wjg.v29.i7.1235
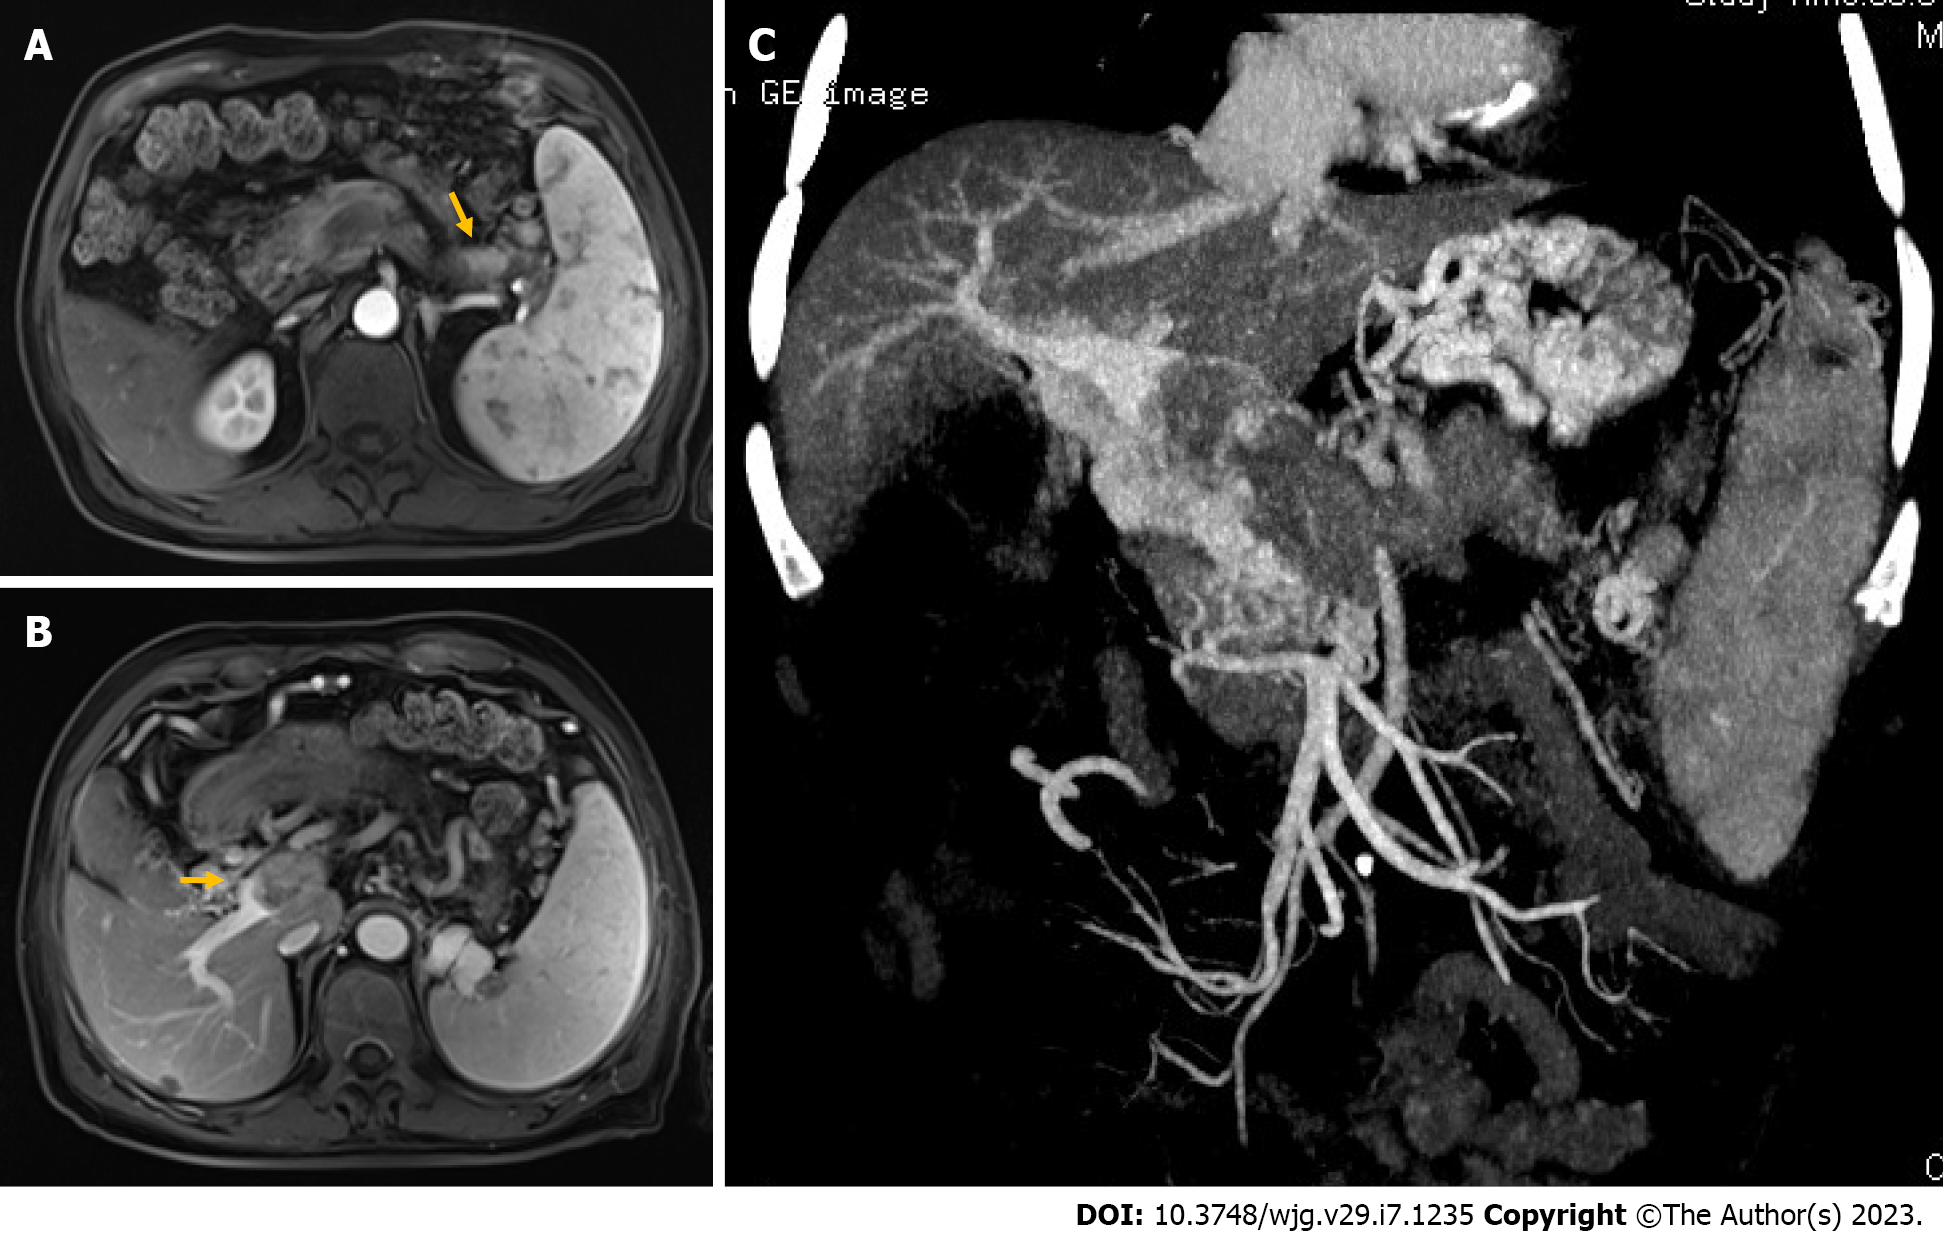
Figure 1 Representative magnetic resonance imaging and computed tomography image on admission.
A: Contrast-enhanced magnetic resonance imaging (MRI) axial view showing a well-enhanced tumor in the pancreatic tail; B: Axial view of contrast-enhanced MRI shows an intravascular filling defect (arrows) occupying the entire portal vein lumen; C: Computed tomography portal venography image showing extensive collateral venous circulation due to portal vein occlusion.
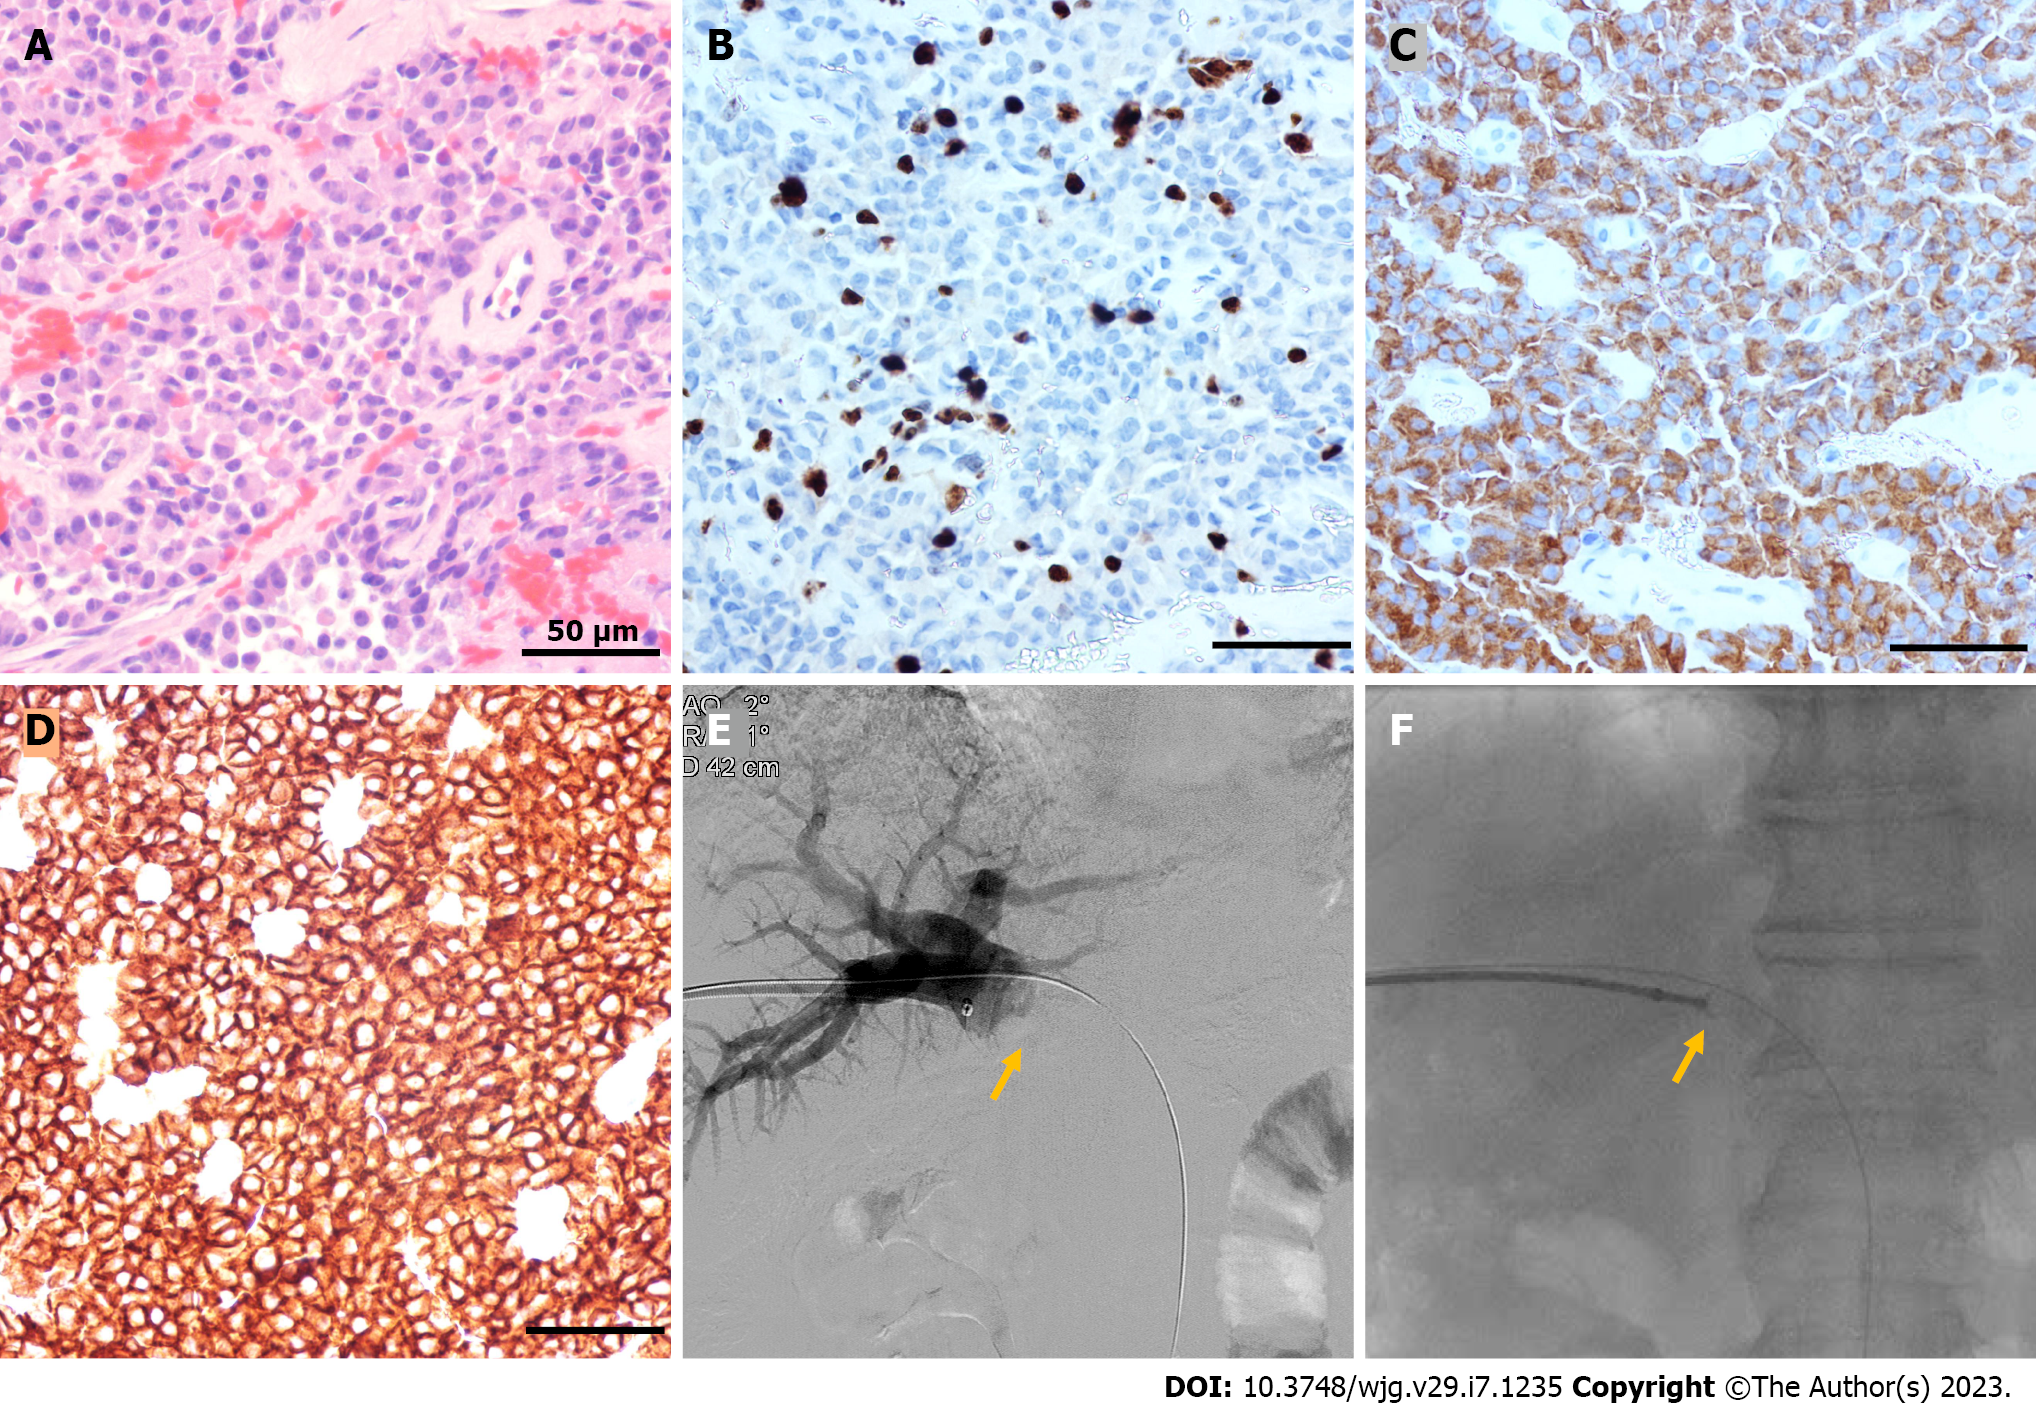
Figure 2 Morphology and immunohistochemistry image of the tumor and radiograph from portography.
A: Hematoxylin and eosin stained section of the tumor; B: Immunohistochemistry staining for Ki-67 showed Ki-67 index of 5%-8%; C and D: Immunohistochemistry staining for synaptophysin (C) and somatostatin receptors 2 (D) were positive (magnification × 400); E: Portography showing a filling defect within the intravascular space (arrows) in the main portal vein; F: Intravascular biopsy using gastroscope biopsy forceps assisted by a 7-F guide catheter located in the right portal vein (arrow).
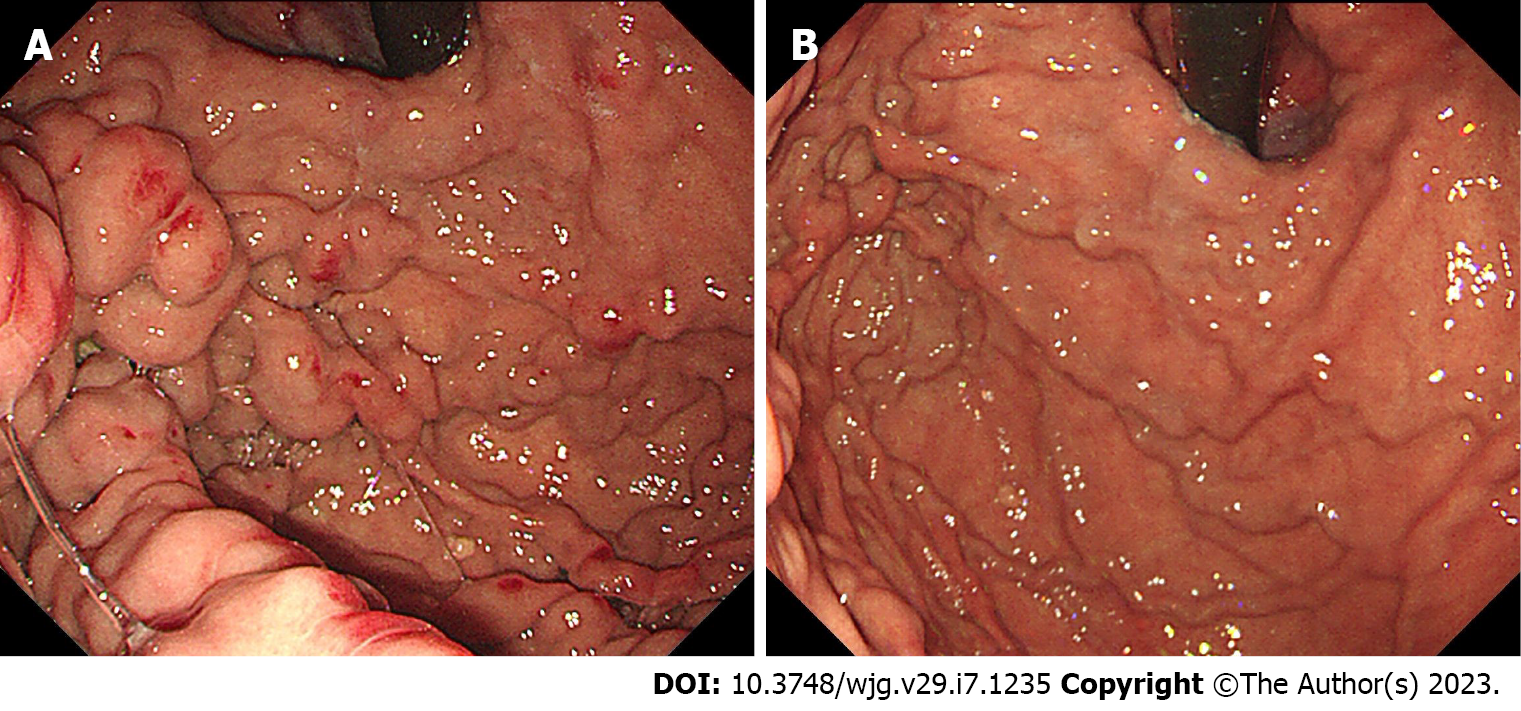
Figure 3 Endoscopic image on admission and 1 mo later.
A: Endoscopic image before partial splenic embolization (PSE) showing diffused gastric varices; B: Endoscopic image after PSE showing alleviation of gastric varices.
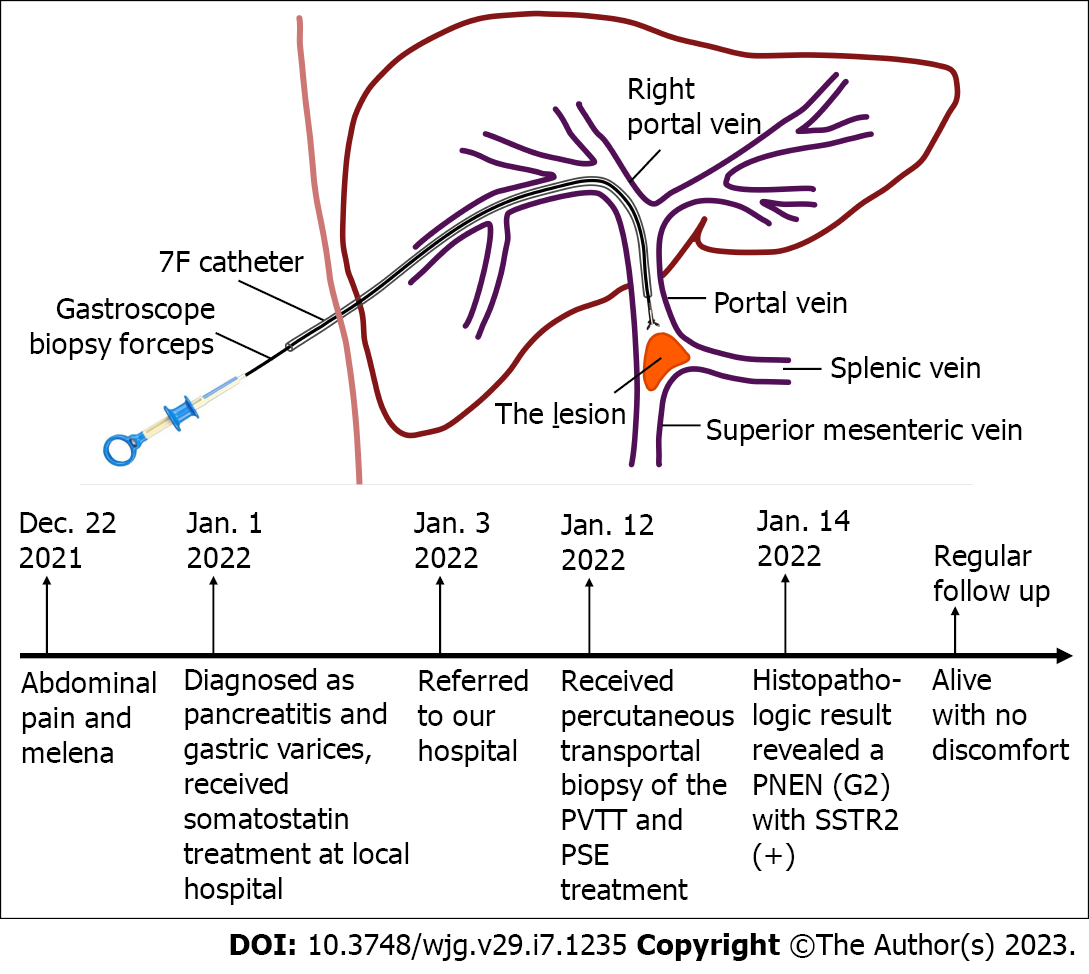
Figure 4 Schematic illustration of the procedure and timeline.
A: Schematic illustration of the procedure for percutaneous transhepatic intraportal biopsy using a gastroscope biopsy forceps; B: Timeline. PNEN: Pancreatic neuroendocrine neoplasm; SSTR2: Somatostatin receptors 2; PVTT: Portal vein tumor thrombosis; PSE: Partial splenic embolization.
- Citation: Wang GC, Huang GJ, Zhang CQ, Ding Q. Percutaneous transhepatic intraportal biopsy using gastroscope biopsy forceps for diagnosis of a pancreatic neuroendocrine neoplasm: A case report. World J Gastroenterol 2023; 29(7): 1235-1242
- URL: https://www.wjgnet.com/1007-9327/full/v29/i7/1235.htm
- DOI: https://dx.doi.org/10.3748/wjg.v29.i7.1235


