Copyright
©The Author(s) 2023.
World J Gastroenterol. Feb 14, 2023; 29(6): 1090-1108
Published online Feb 14, 2023. doi: 10.3748/wjg.v29.i6.1090
Published online Feb 14, 2023. doi: 10.3748/wjg.v29.i6.1090
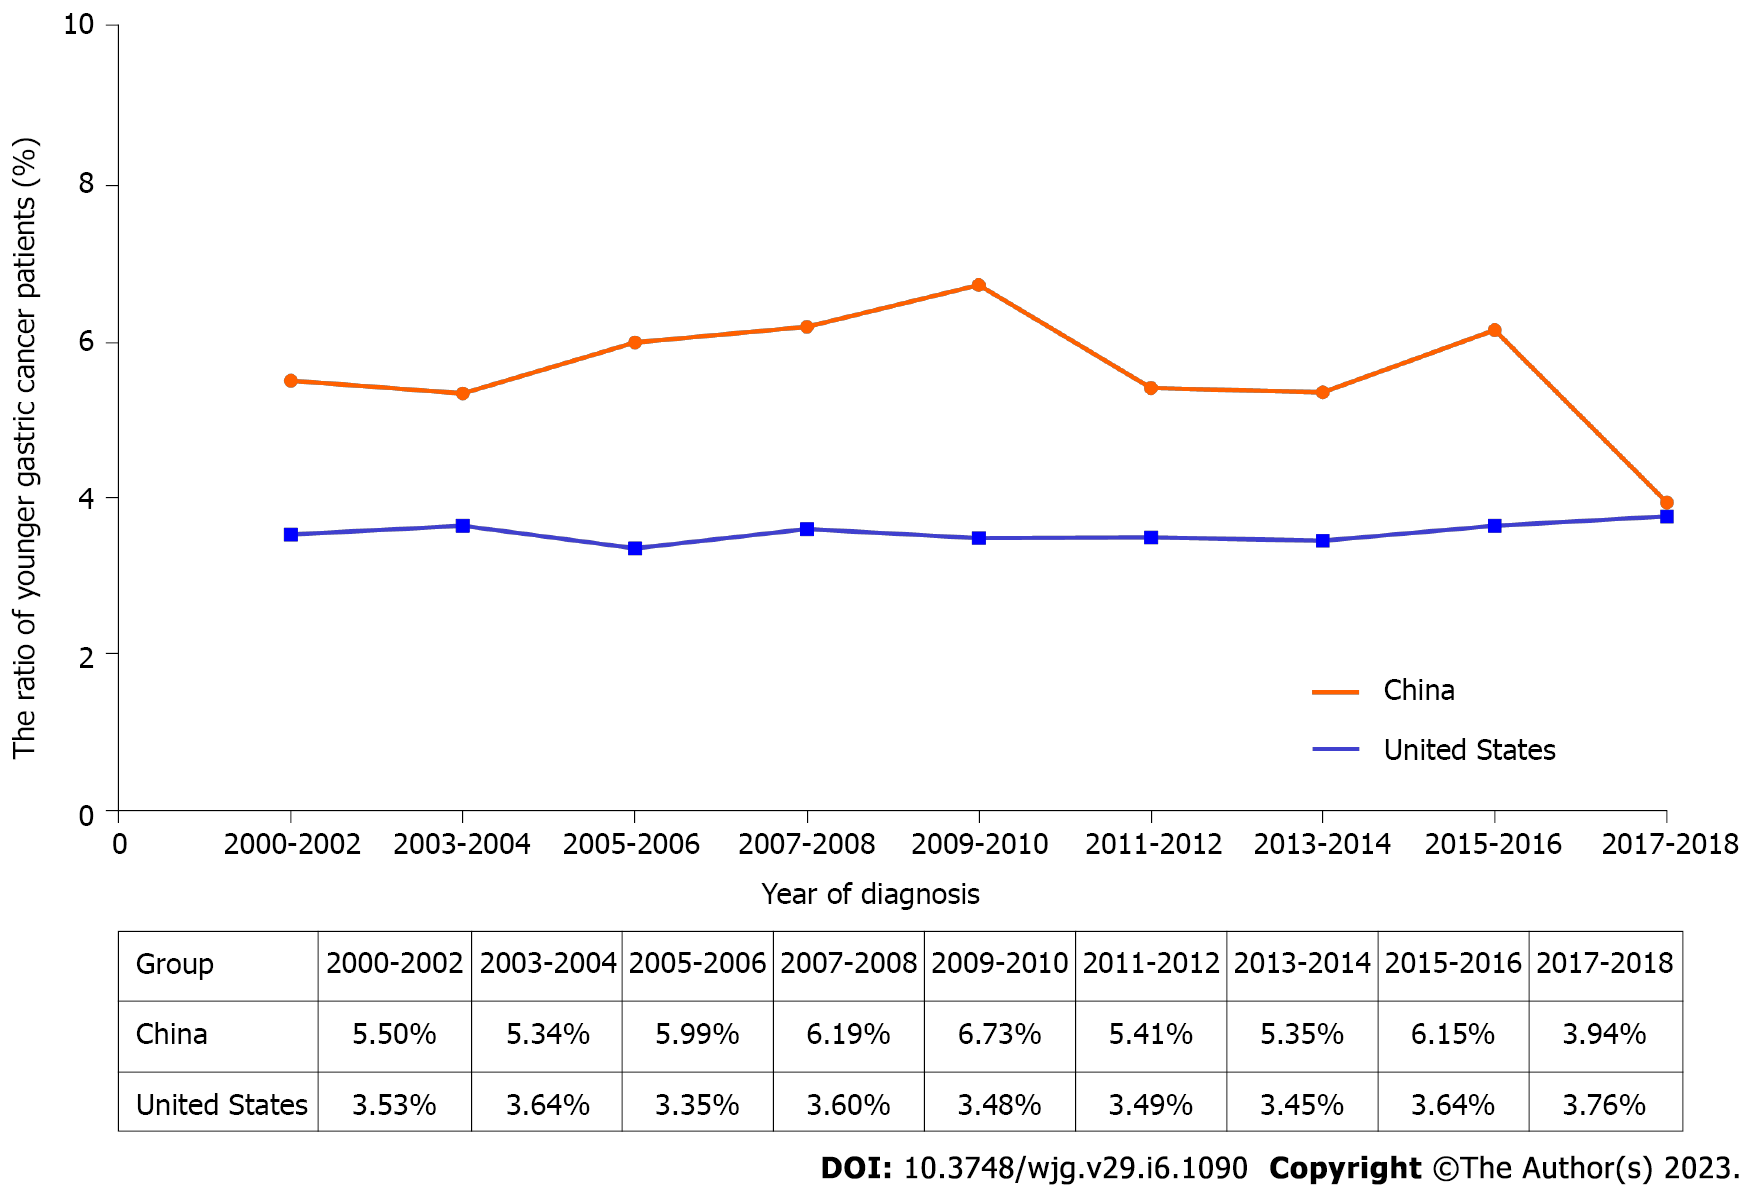
Figure 1 The ratio of younger patients with gastric cancer based on the China National Cancer Center and Surveillance Epidemiology and End Results databases from 2000 to 2018.
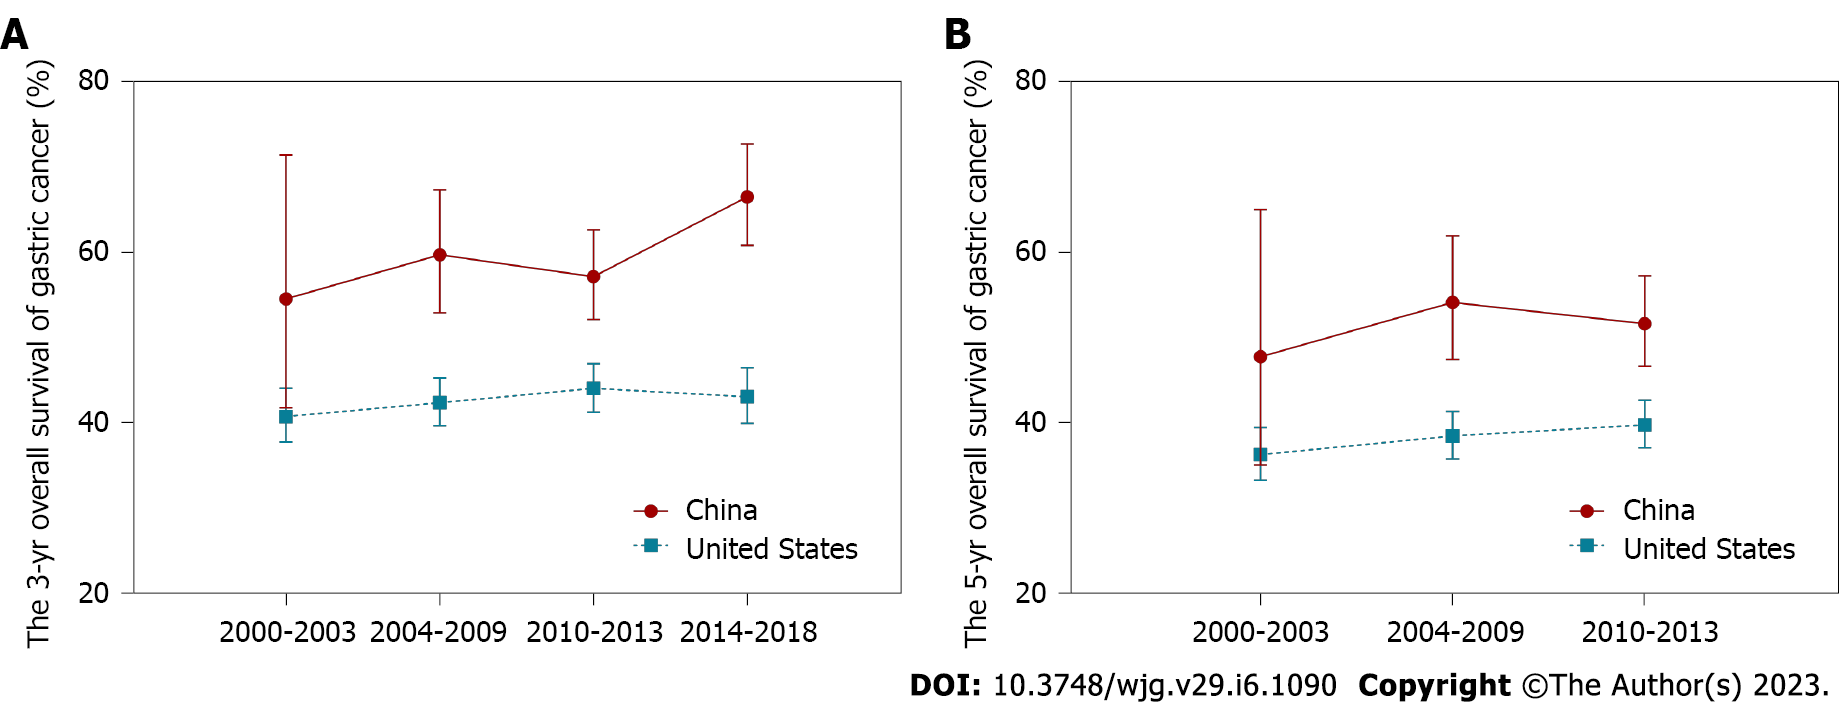
Figure 2 The survival trends of younger patients with gastric cancer based on the China National Cancer Center and Surveillance Epidemiology and End Results databases.
A: Trends of the 3-year overall survival; B: Trends of the 5-year overall survival.
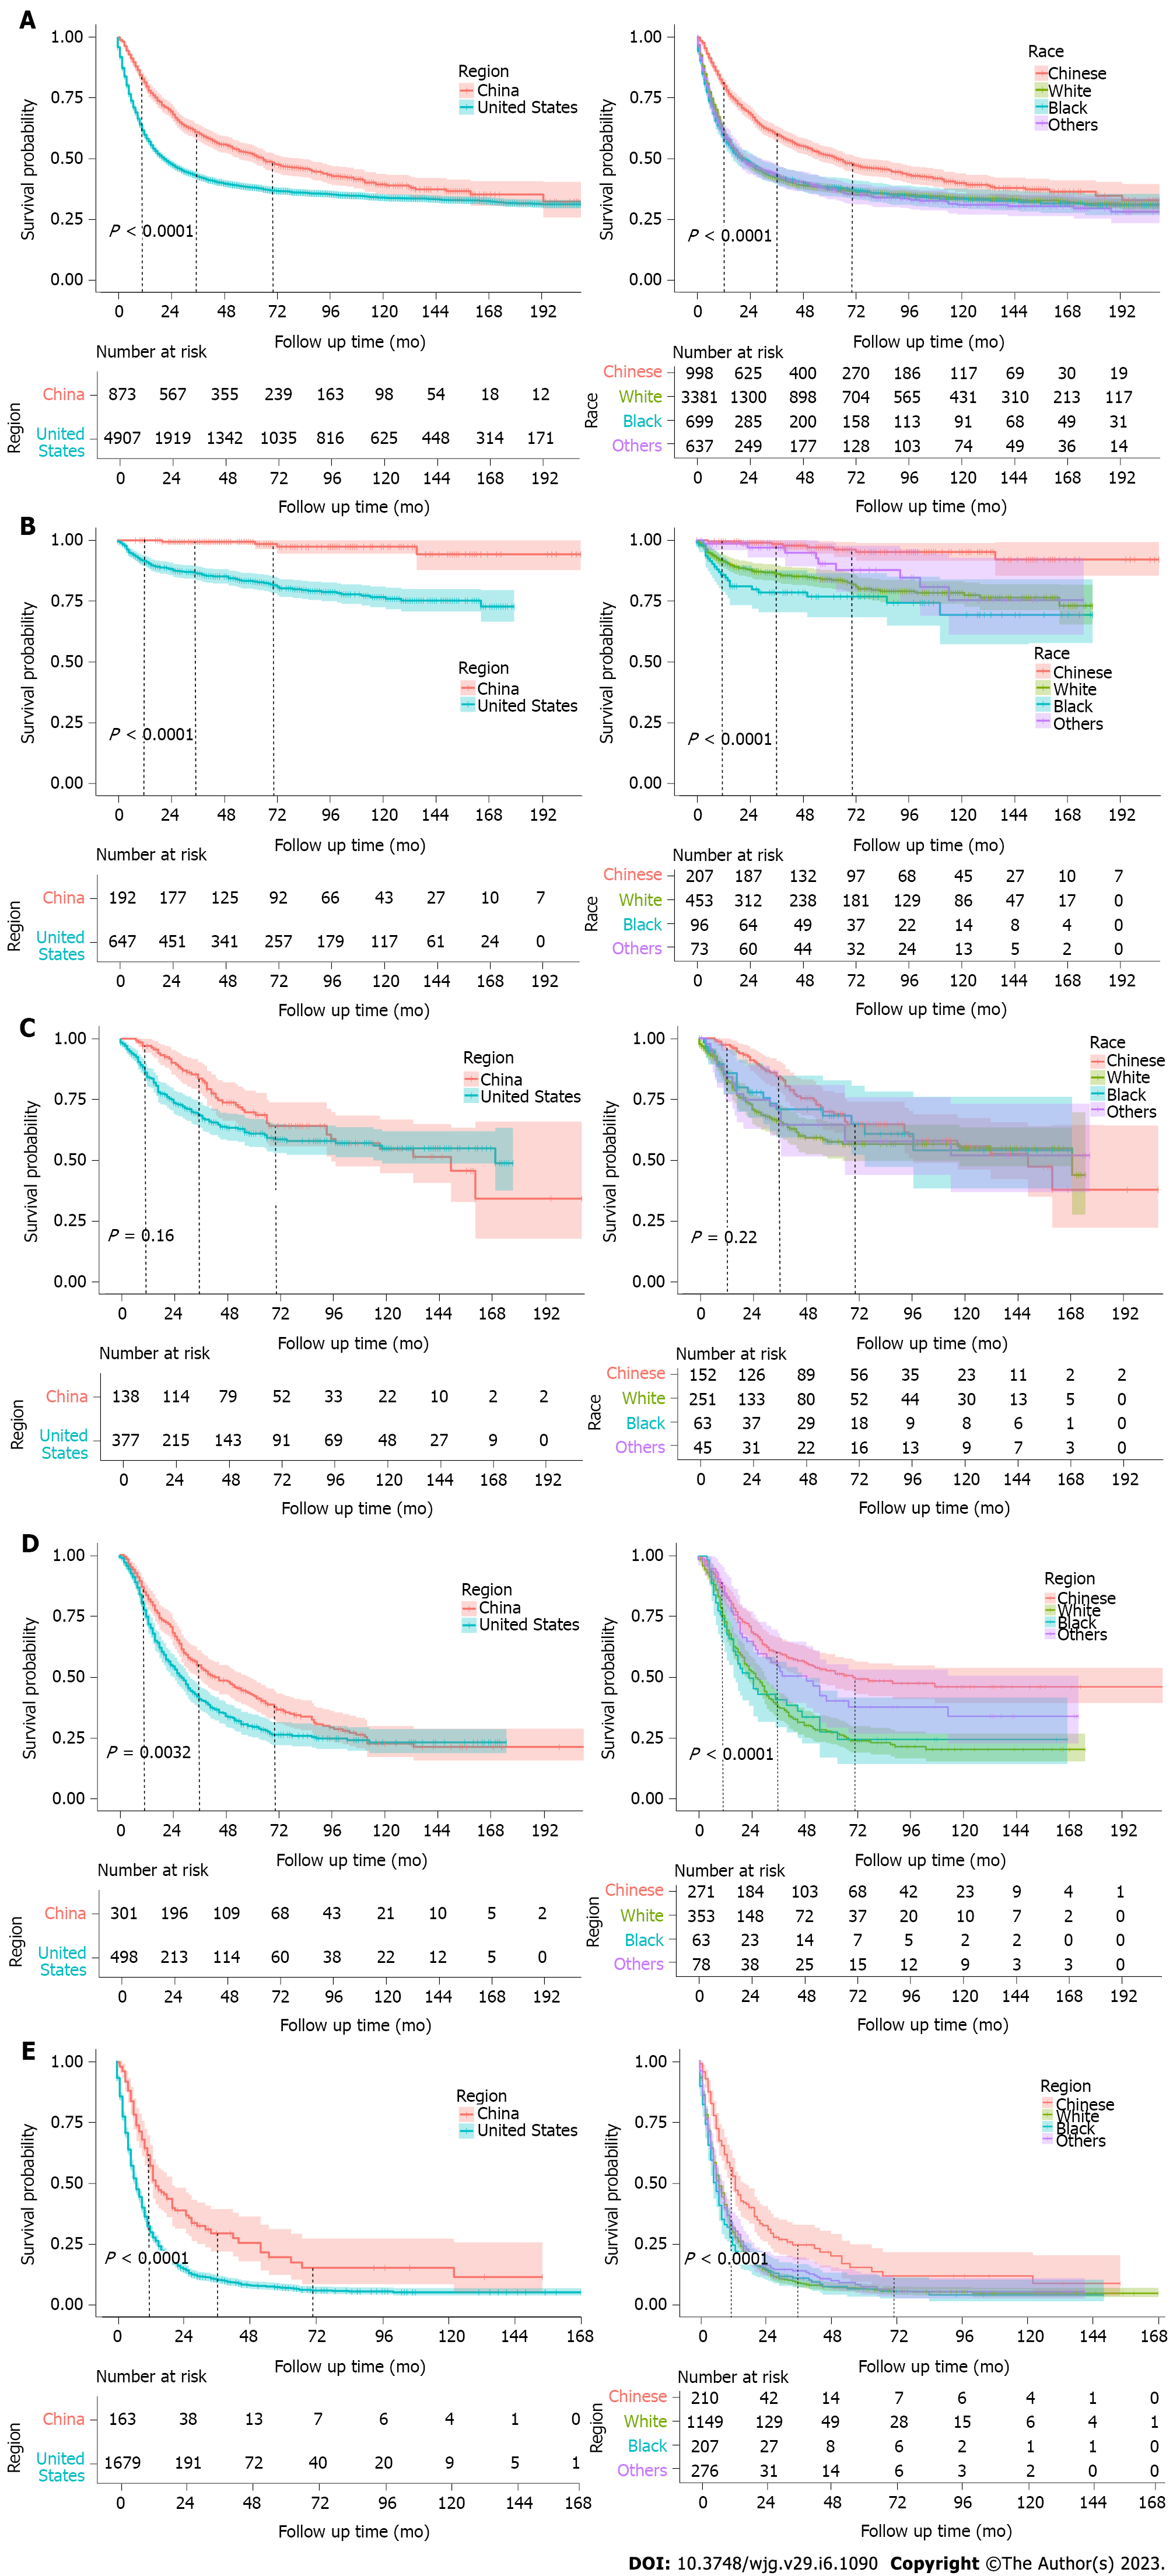
Figure 3 Kaplan-Meier survival curves of different regions and races from the China National Cancer Center and Surveillance Epidemiology and End Results databases from 2000 to 2018.
A: All gastric cancer; B: Gastric cancer diagnosed as Tumor-Node-Metastasis (TNM) stage I; C: Gastric cancer diagnosed as TNM stage II; D: Gastric cancer diagnosed as TNM stage III; E: Gastric cancer diagnosed as TNM stage IV.
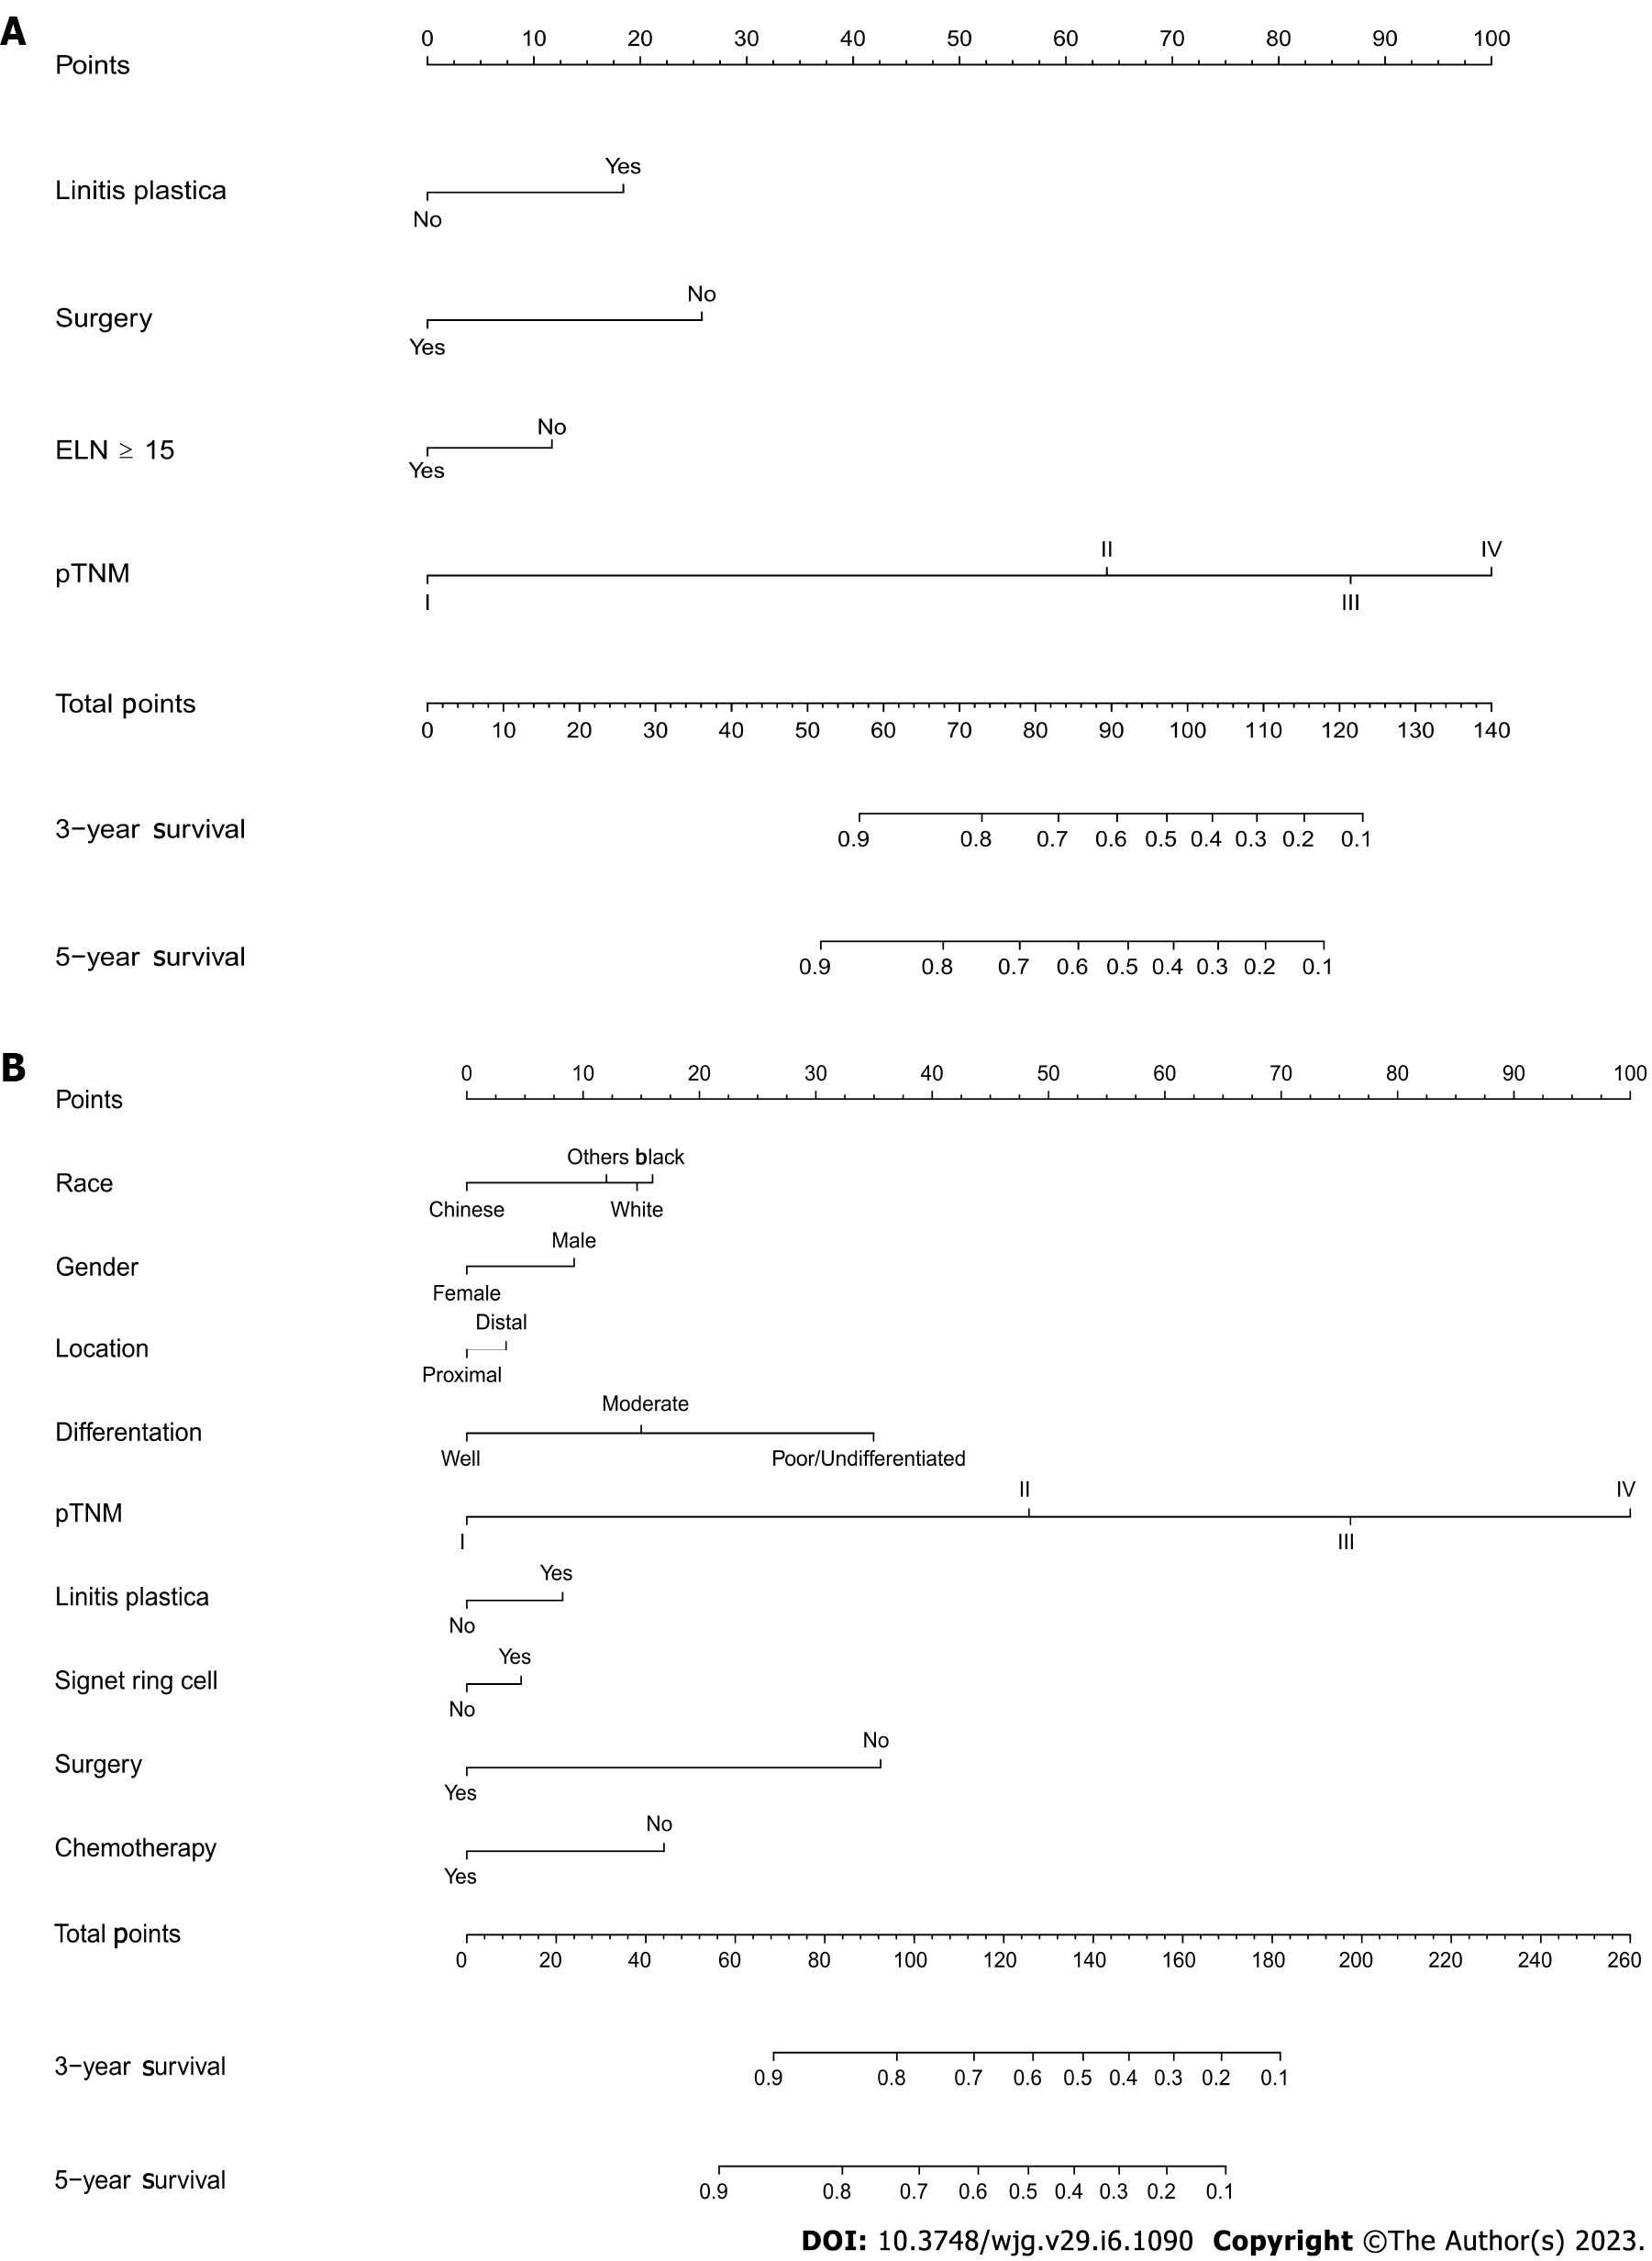
Figure 4 Prognostic nomogram for younger gastric cancer patients.
A: Nomogram based on the China National Cancer Center; B: Nomogram based on the Surveillance Epidemiology and End Results database. ELN: Examined lymph nodes; pTNM: Pathological Tumor-Node-Metastasis.
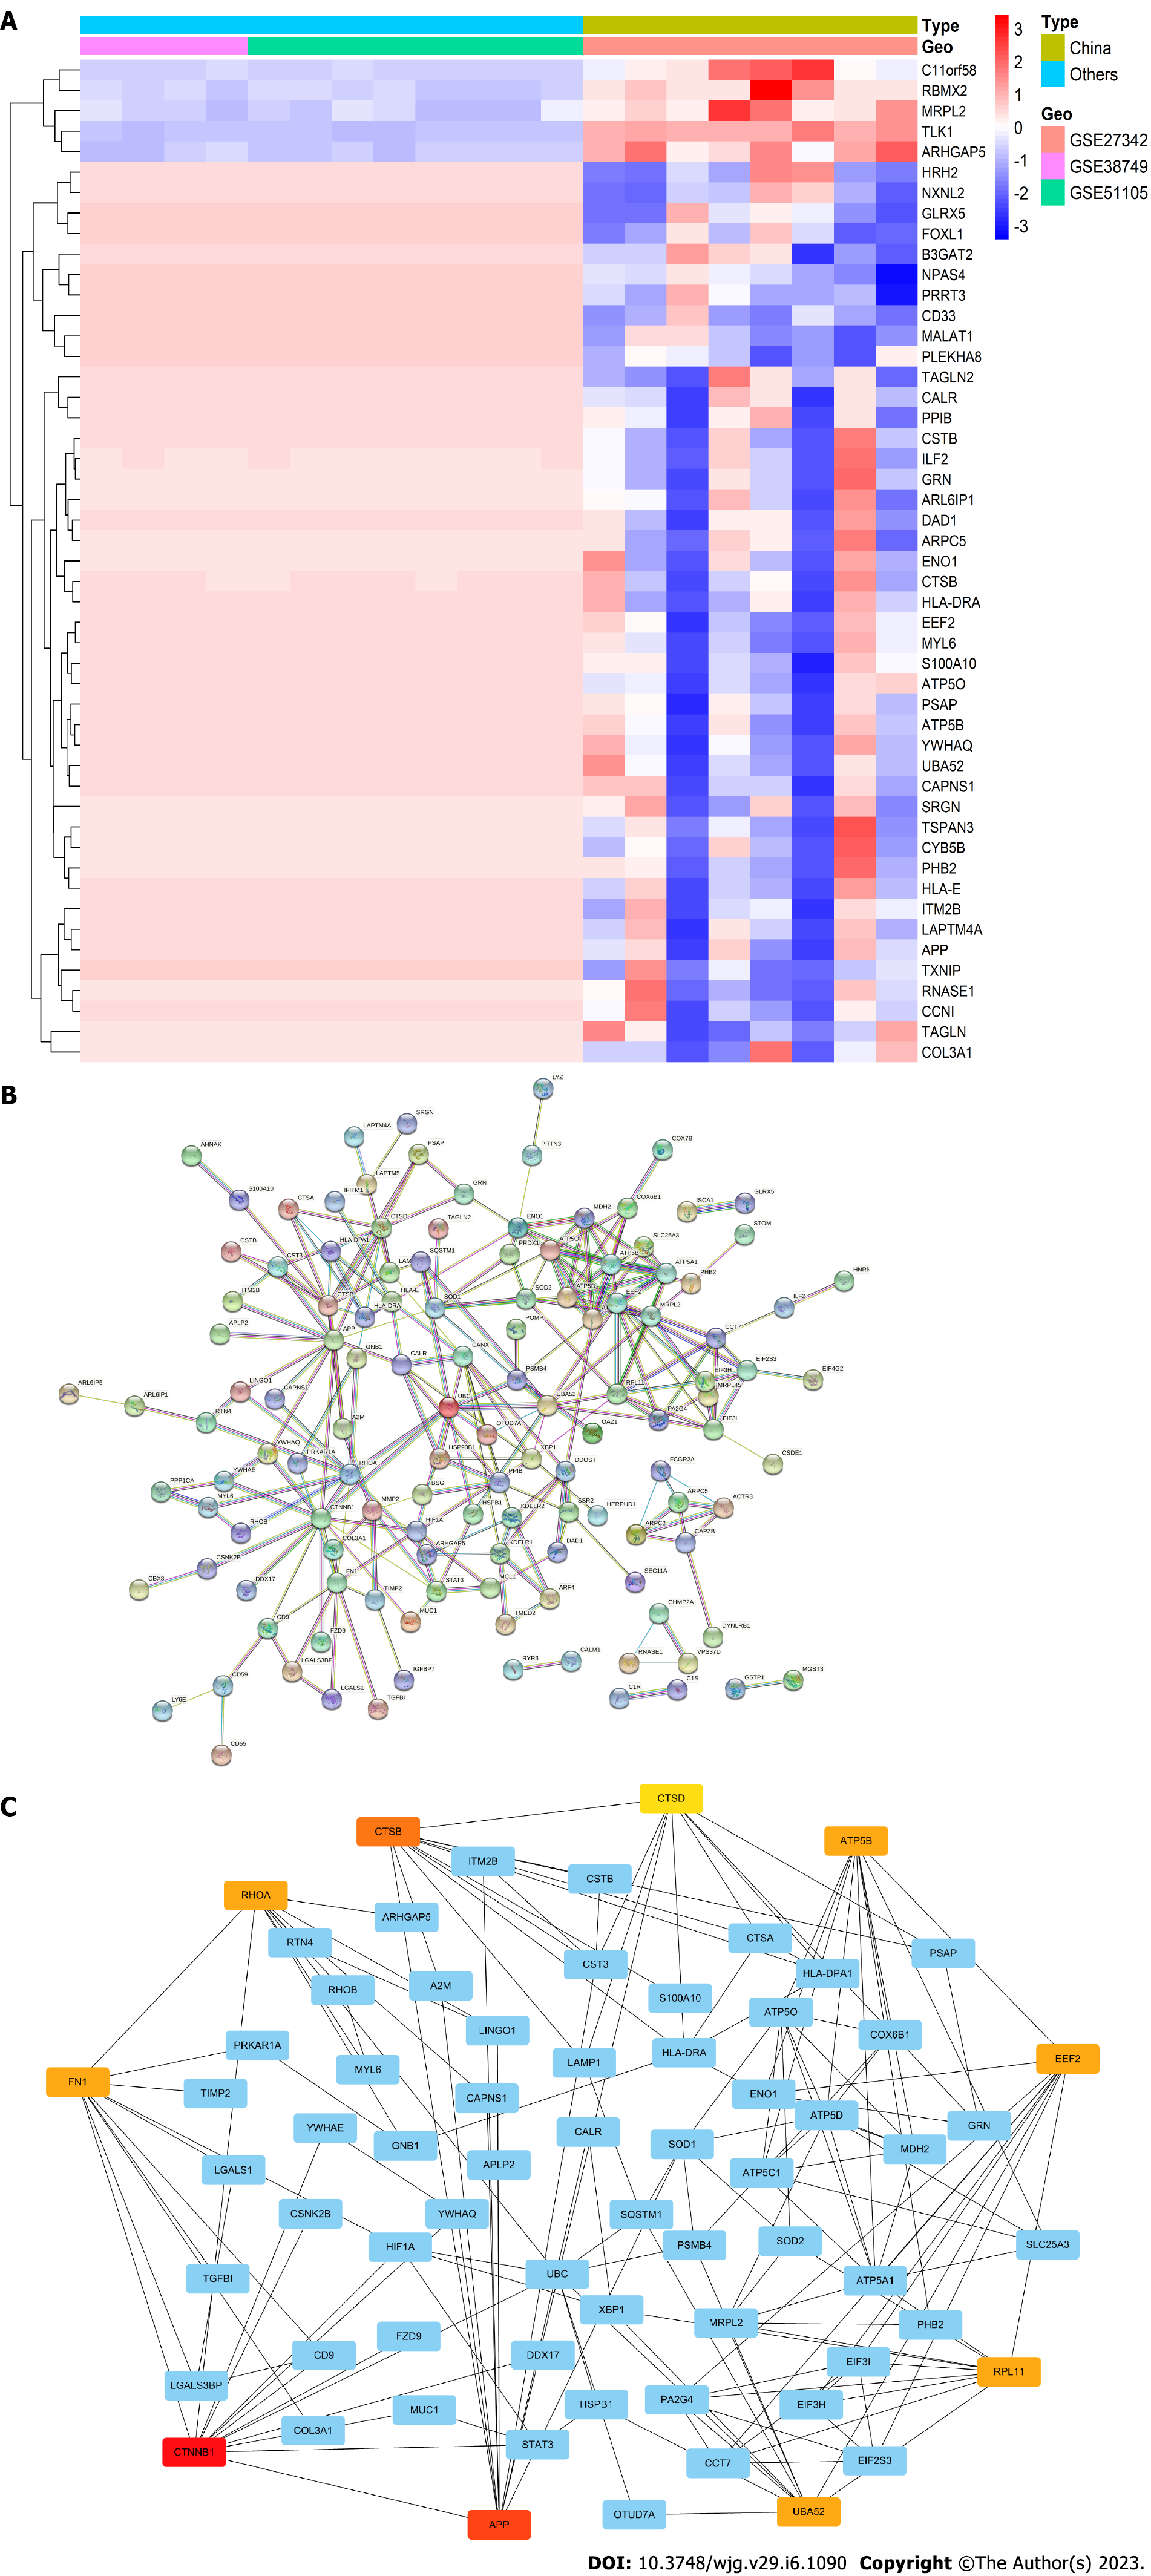
Figure 5 After differentially expressed genes analysis was performed among different regional sets, 50 significant differently expressed genes were selected.
A: Heatmap constructed with the differentially expressed genes for younger gastric cancer patients; B: Protein–protein interaction network; C: Top 10 hub genes with higher degree of connectivity.
- Citation: Niu PH, Zhao LL, Wang WQ, Zhang XJ, Li ZF, Luan XY, Chen YT. Survival benefit of younger gastric cancer patients in China and the United States: A comparative study. World J Gastroenterol 2023; 29(6): 1090-1108
- URL: https://www.wjgnet.com/1007-9327/full/v29/i6/1090.htm
- DOI: https://dx.doi.org/10.3748/wjg.v29.i6.1090


