Copyright
©The Author(s) 2023.
World J Gastroenterol. Feb 14, 2023; 29(6): 1076-1089
Published online Feb 14, 2023. doi: 10.3748/wjg.v29.i6.1076
Published online Feb 14, 2023. doi: 10.3748/wjg.v29.i6.1076
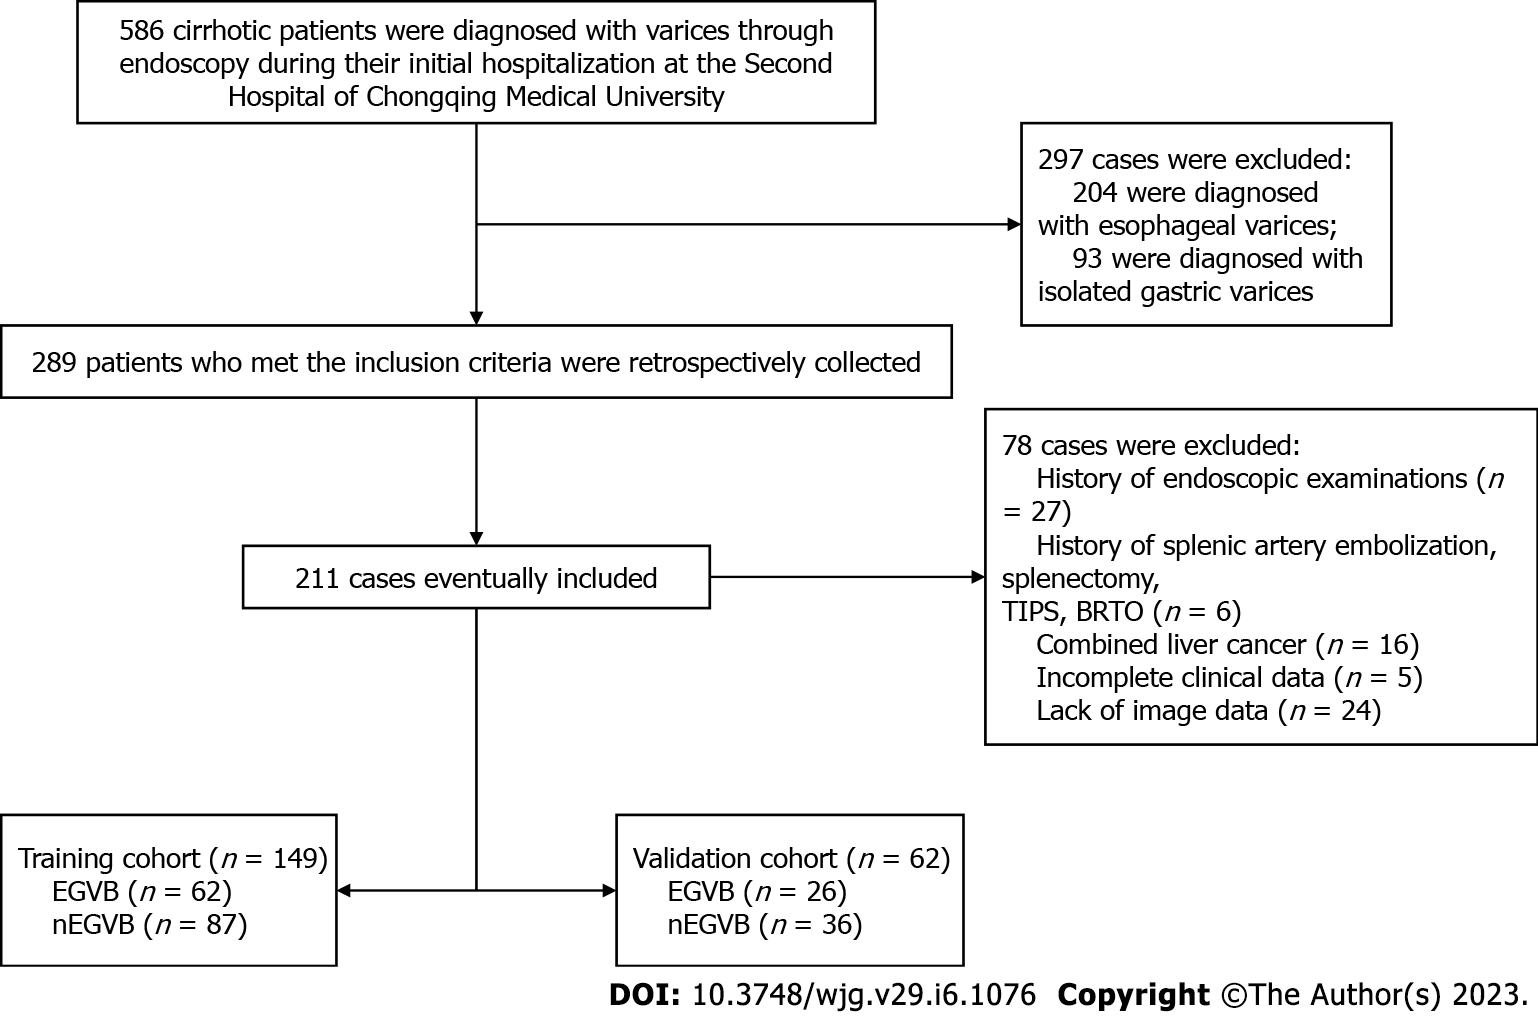
Figure 1 Flowchart of inclusion and exclusion procedures for this study.
TIPS: Transjugular intrahepatic portosystemic shunt; BRTO: Balloon occluded retrograde transvenous obliteration; EGVB: Esophagogastric variceal bleeding; nEGVB: Without the occurrence of esophagogastric variceal bleeding.
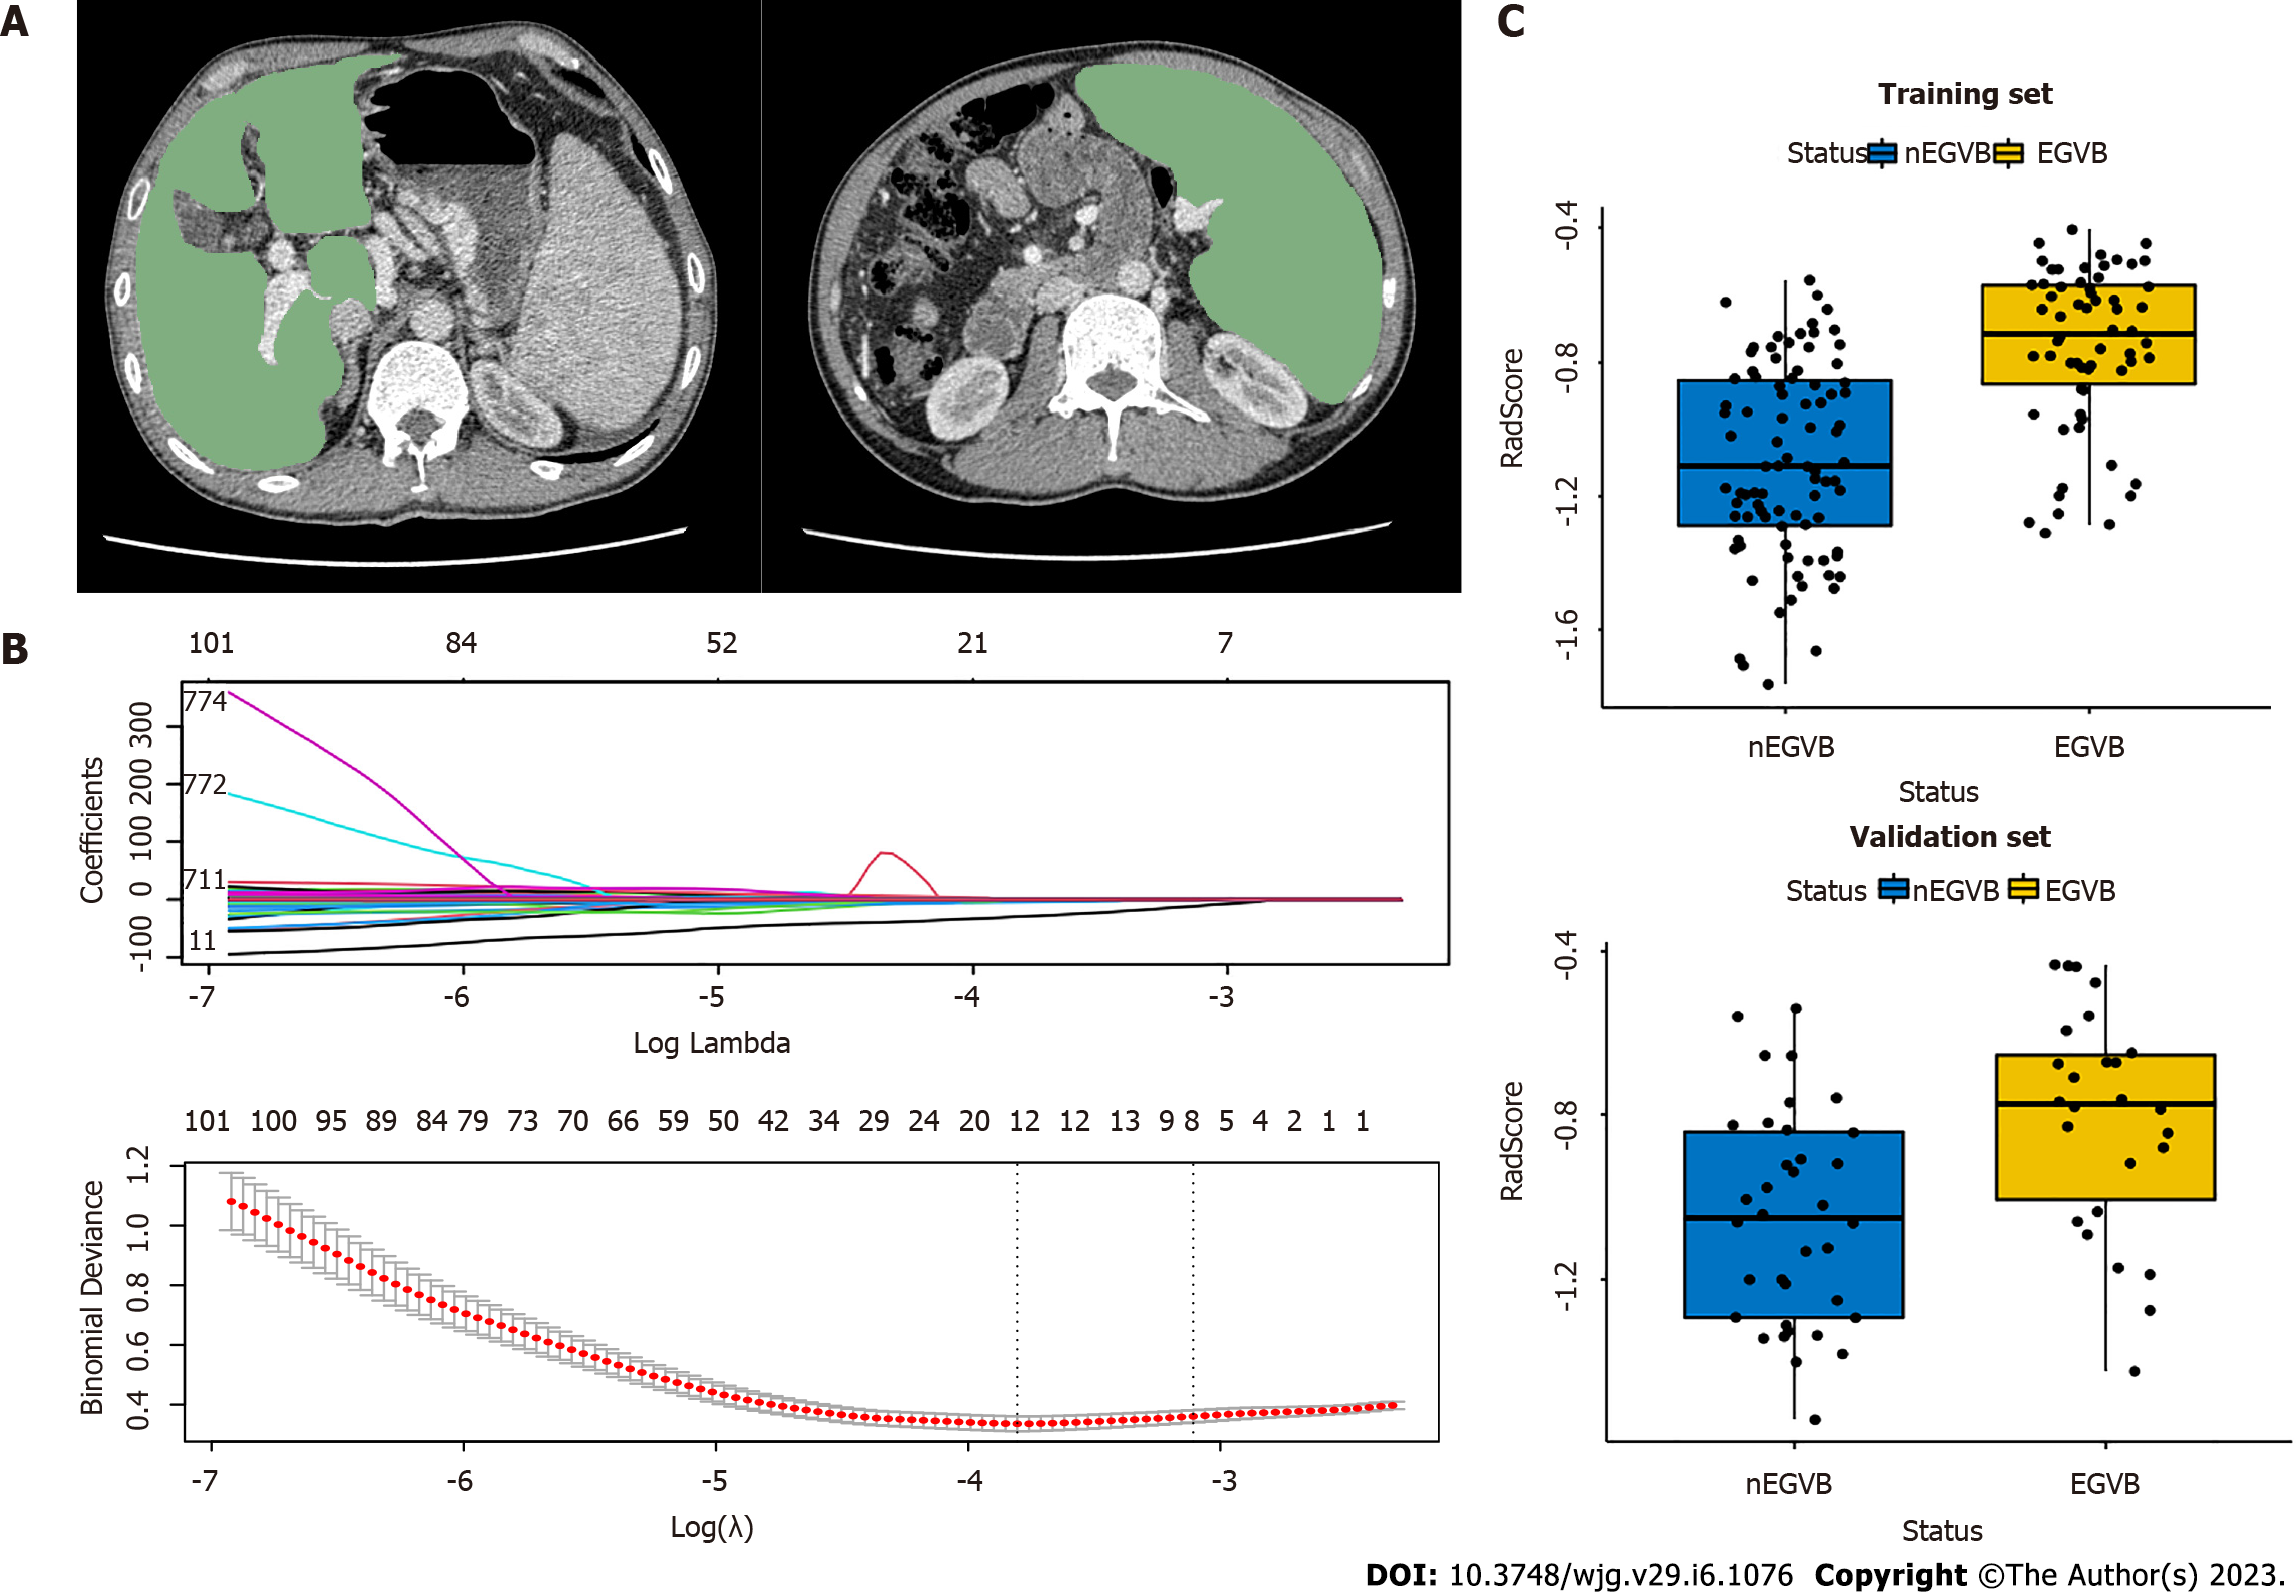
Figure 2 Workflow of the radiomics analysis.
A: The liver and spleen regions of interest were defined at the level of the hepatic hilum and the splenic hilum, respectively; B: The least absolute shrinkage and selection operator regression analysis for dimension reduction of radiomics features, and the optimal model parameter λ was selected by 10-fold cross-validation; C: The boxplots of radiomics signatures (RadScore) in the training and validation groups display notable differences respectively. EGVB: Esophagogastric variceal bleeding; nEGVB: Without the occurrence of esophagogastric variceal bleeding.
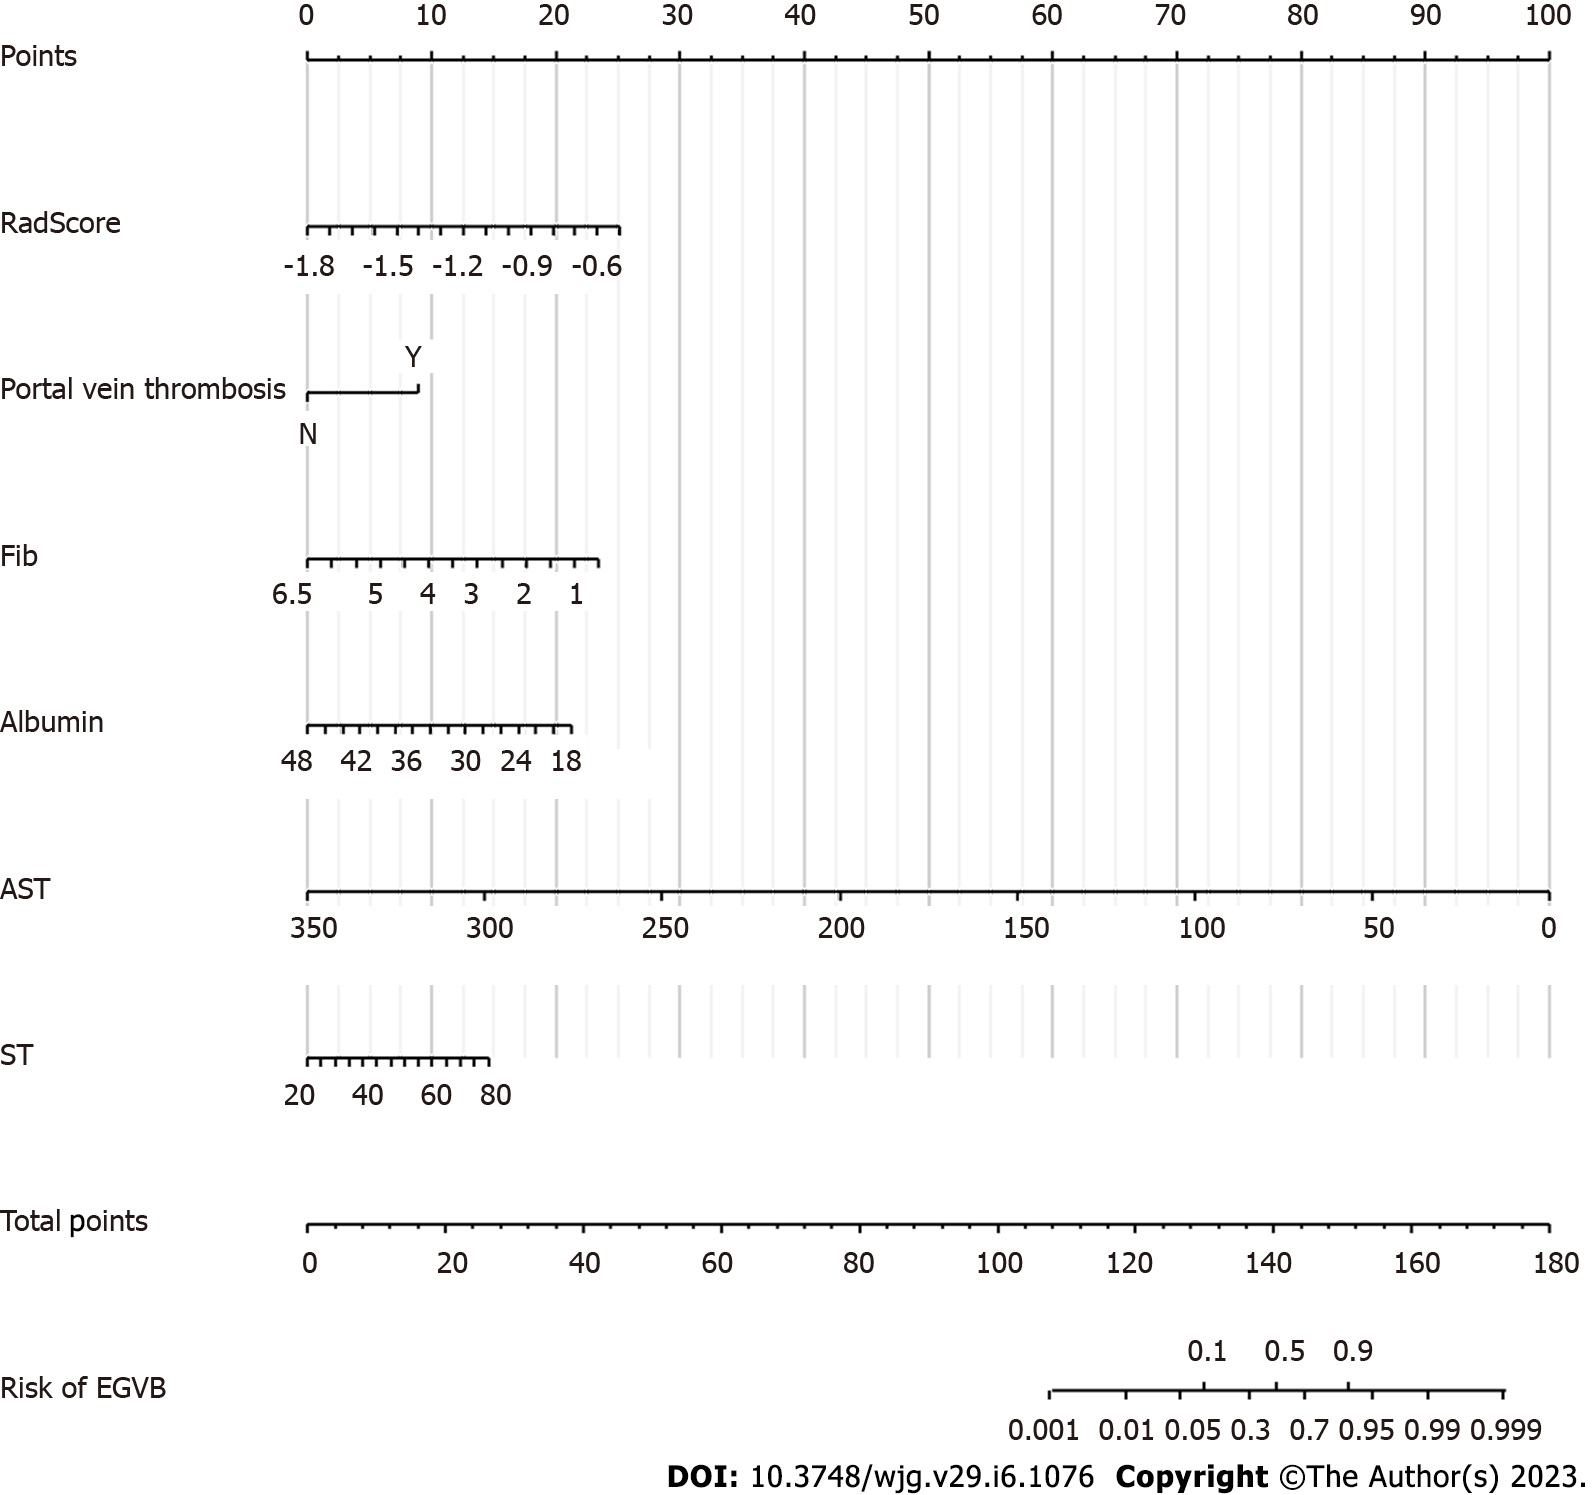
Figure 3 The construction of a clinical-radiomics prediction model for esophagogastric variceal bleeding.
The clinical-radiomics nomogram for predicting bleeding risk. The scores of the different variables in the nomogram were summed to obtain the total score, and a line was drawn from the axis of the total score to the bottom line to determine the probability of bleeding risk. Fib: Fibrinogen; AST: Aspartate aminotransferase; ST: Spleen thickness; EGVB: Esophagogastric variceal bleeding.
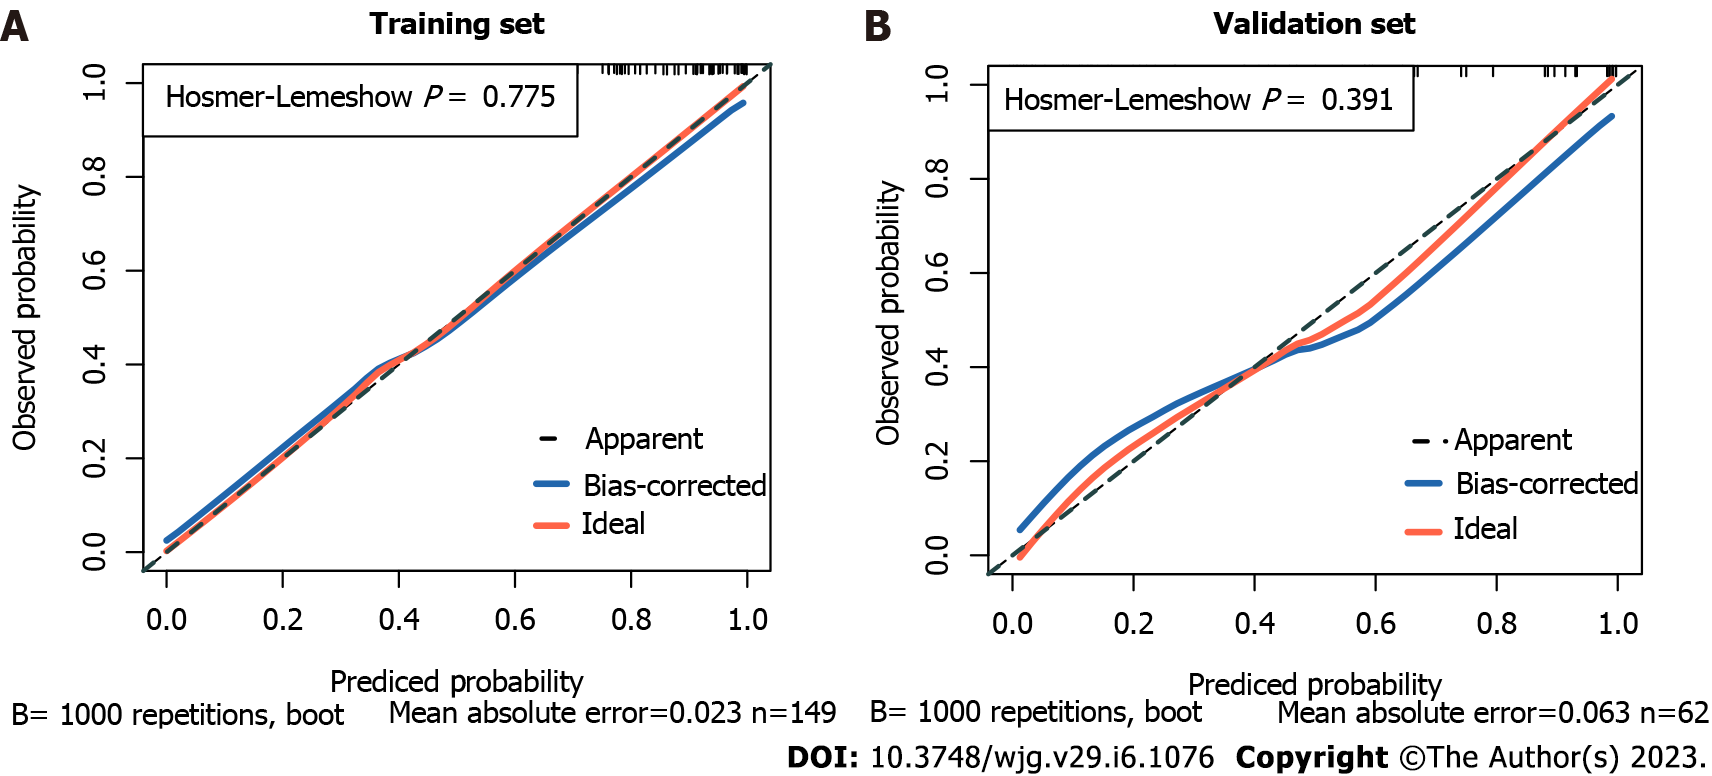
Figure 4 The calibration curves of the nomogram.
A: The calibration curve of the nomogram shows a good fit in the training cohort (P = 0.775); B: The calibration curve of the nomogram shows a good fit in the validation cohort (P = 0.391).
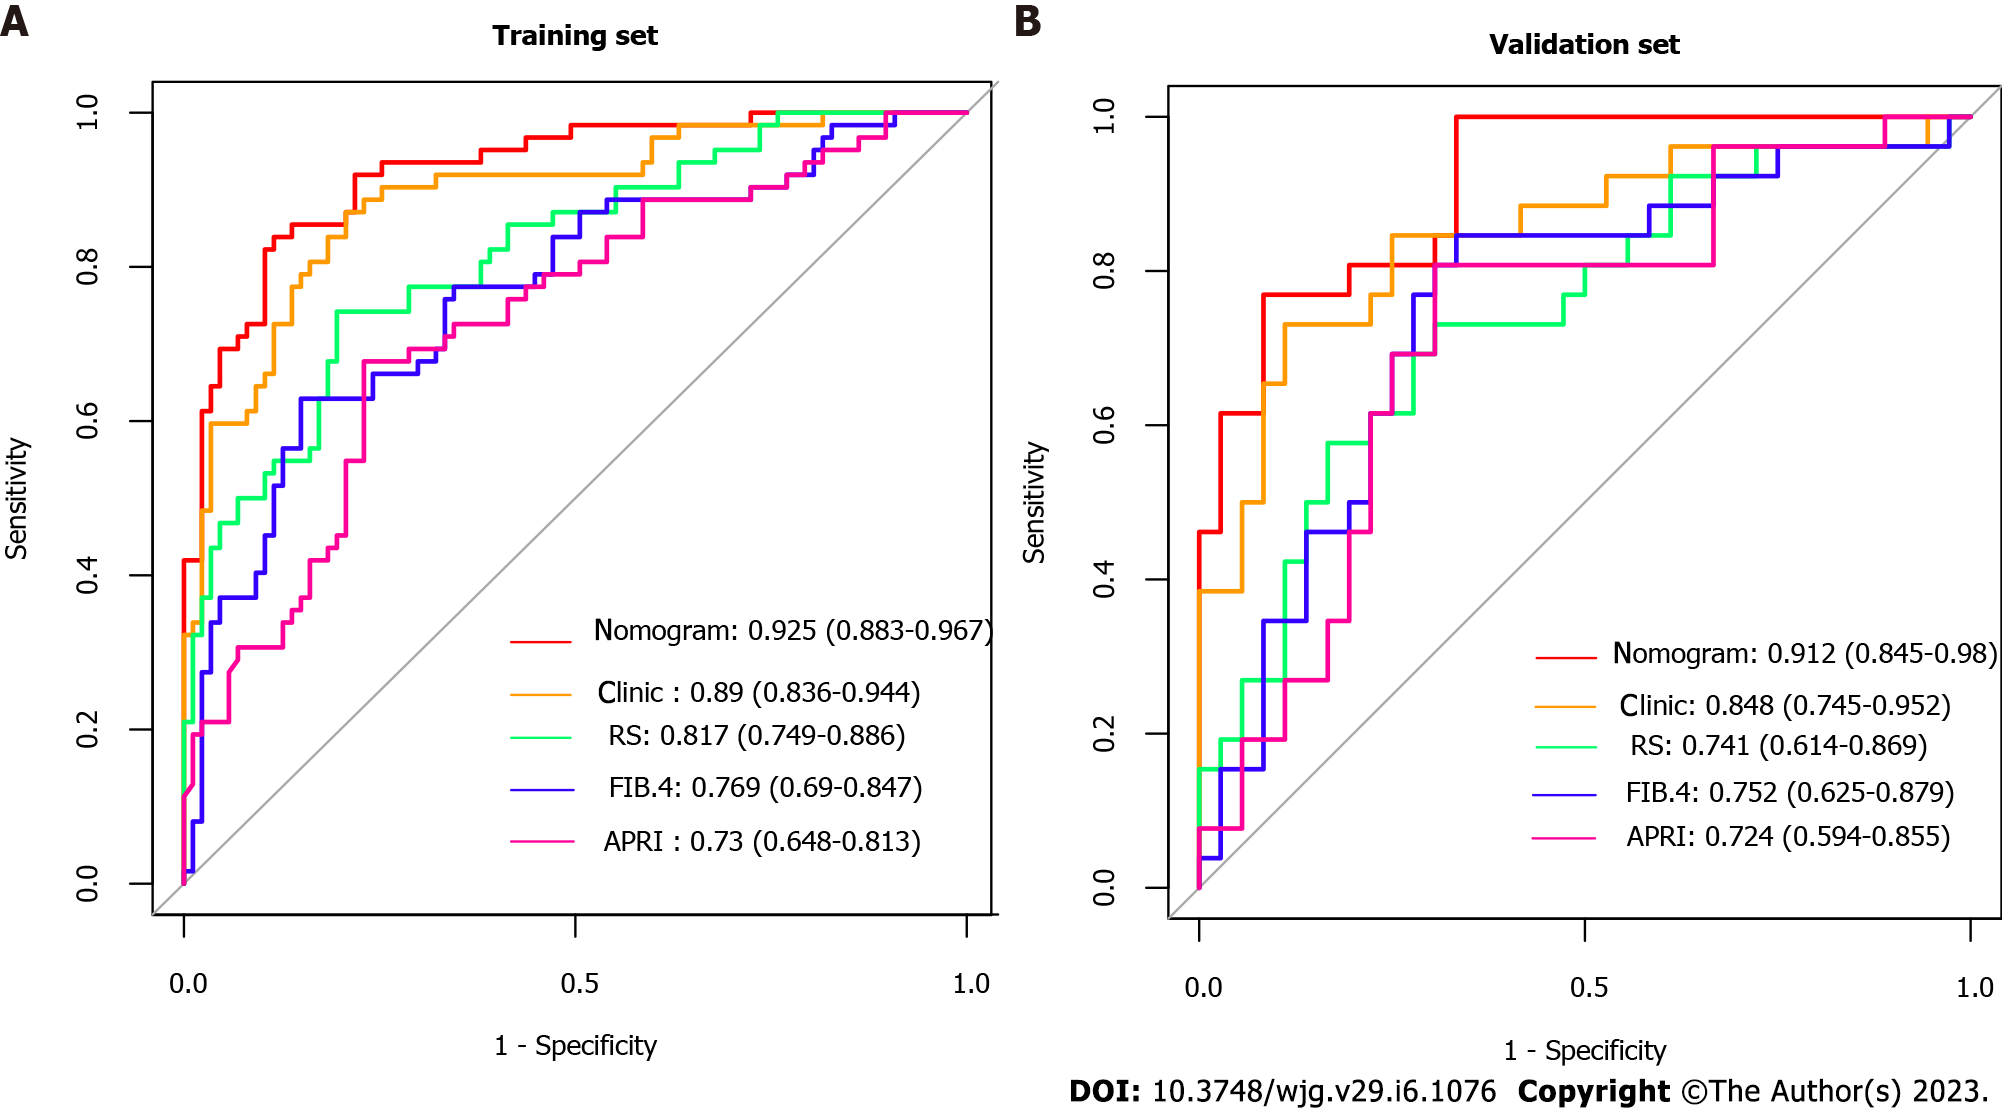
Figure 5 The receiver operating characteristic curves in the study.
A: The receiver operating characteristic curves (ROC) in the training cohort; B: The ROCs in the validation cohort. Clinic: The model based on clinical individual indicator; RS: Radiomics Signature (RadScore); APRI: Ratio of aspartate aminotransferase to platelets; FIB-4: Fibrosis-4 scores.
Figure 6 The clinical decision curves for bleeding prediction.
A: The training cohort; B: The validation cohort. A threshold probability is the point at which the expected benefits of a treatment equal those of not receiving treatment. As shown by the different lines in the diagram, red indicates the clinical-radiomics nomogram, green indicates Fibrosis-4 scores (FIB-4), yellow indicates Ratio of aspartate aminotransferase to platelets (APRI), pink indicates the hypothesis of patients without esophagogastric variceal bleeding (EGVB), and blue indicates that all patients developed EGVB. They indicate that the clinical-radiomics nomogram is superior to the non-invasive serum predictive model’s APRI and FIB-4 in terms of clinical utility. APRI: Ratio of aspartate aminotransferase to platelets; FIB-4: Fibrosis-4 scores.
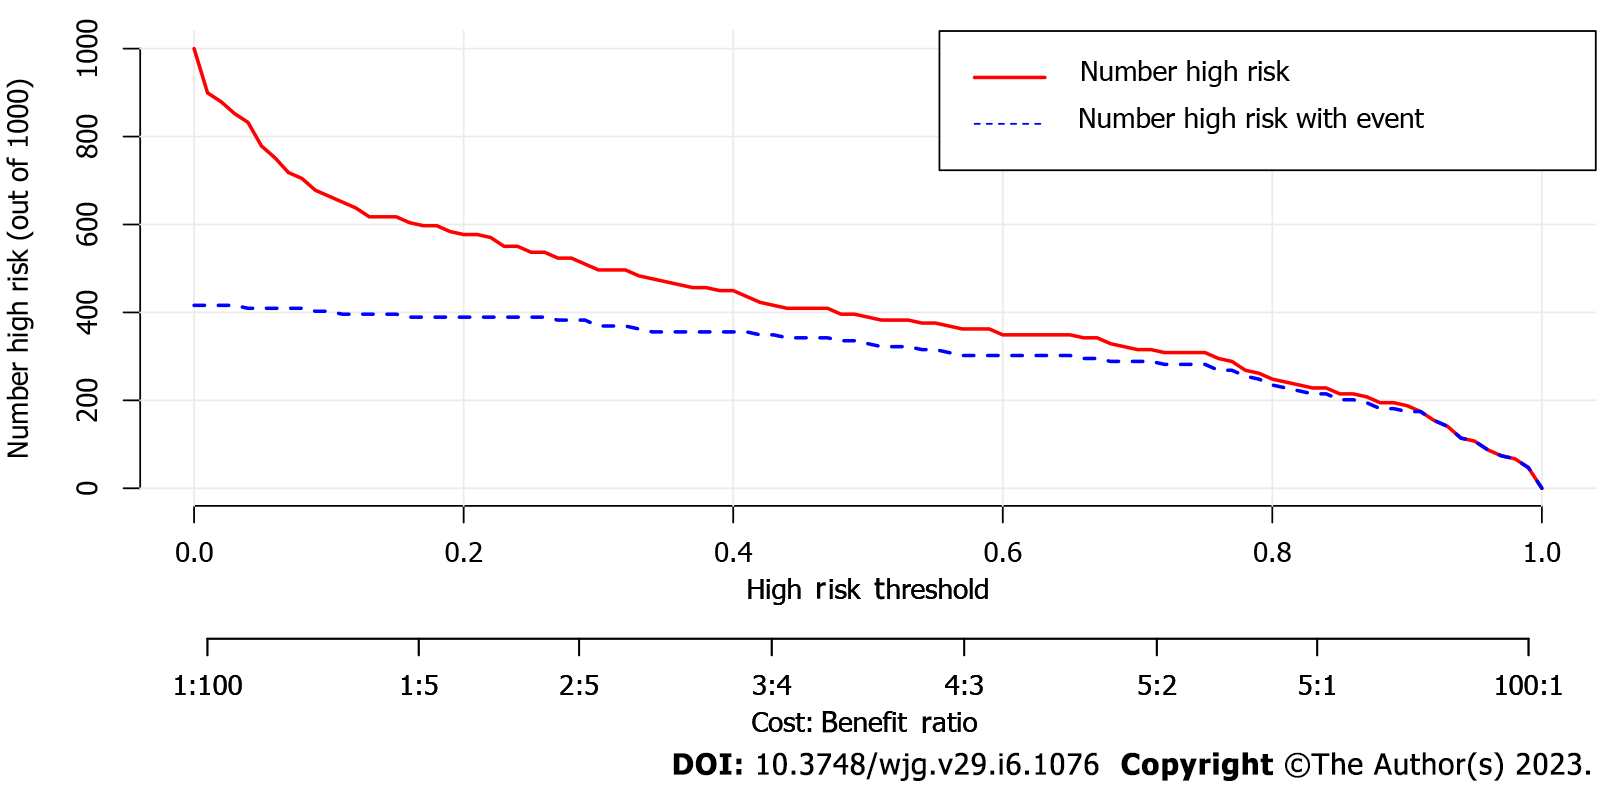
Figure 7 Clinical impact curve of the nomogram for 1,000 simulated samples.
The blue dashed line is the actual high-risk number, and the red line is the high-risk number based on the nomogram. The nomogram predicted a probability of the event that corresponded closely to its actual high risk when the risk threshold was between 0.4 and 0.8, and consistently when it exceeded 0.8.
- Citation: Luo R, Gao J, Gan W, Xie WB. Clinical-radiomics nomogram for predicting esophagogastric variceal bleeding risk noninvasively in patients with cirrhosis. World J Gastroenterol 2023; 29(6): 1076-1089
- URL: https://www.wjgnet.com/1007-9327/full/v29/i6/1076.htm
- DOI: https://dx.doi.org/10.3748/wjg.v29.i6.1076


