Copyright
©The Author(s) 2023.
World J Gastroenterol. Feb 7, 2023; 29(5): 879-889
Published online Feb 7, 2023. doi: 10.3748/wjg.v29.i5.879
Published online Feb 7, 2023. doi: 10.3748/wjg.v29.i5.879
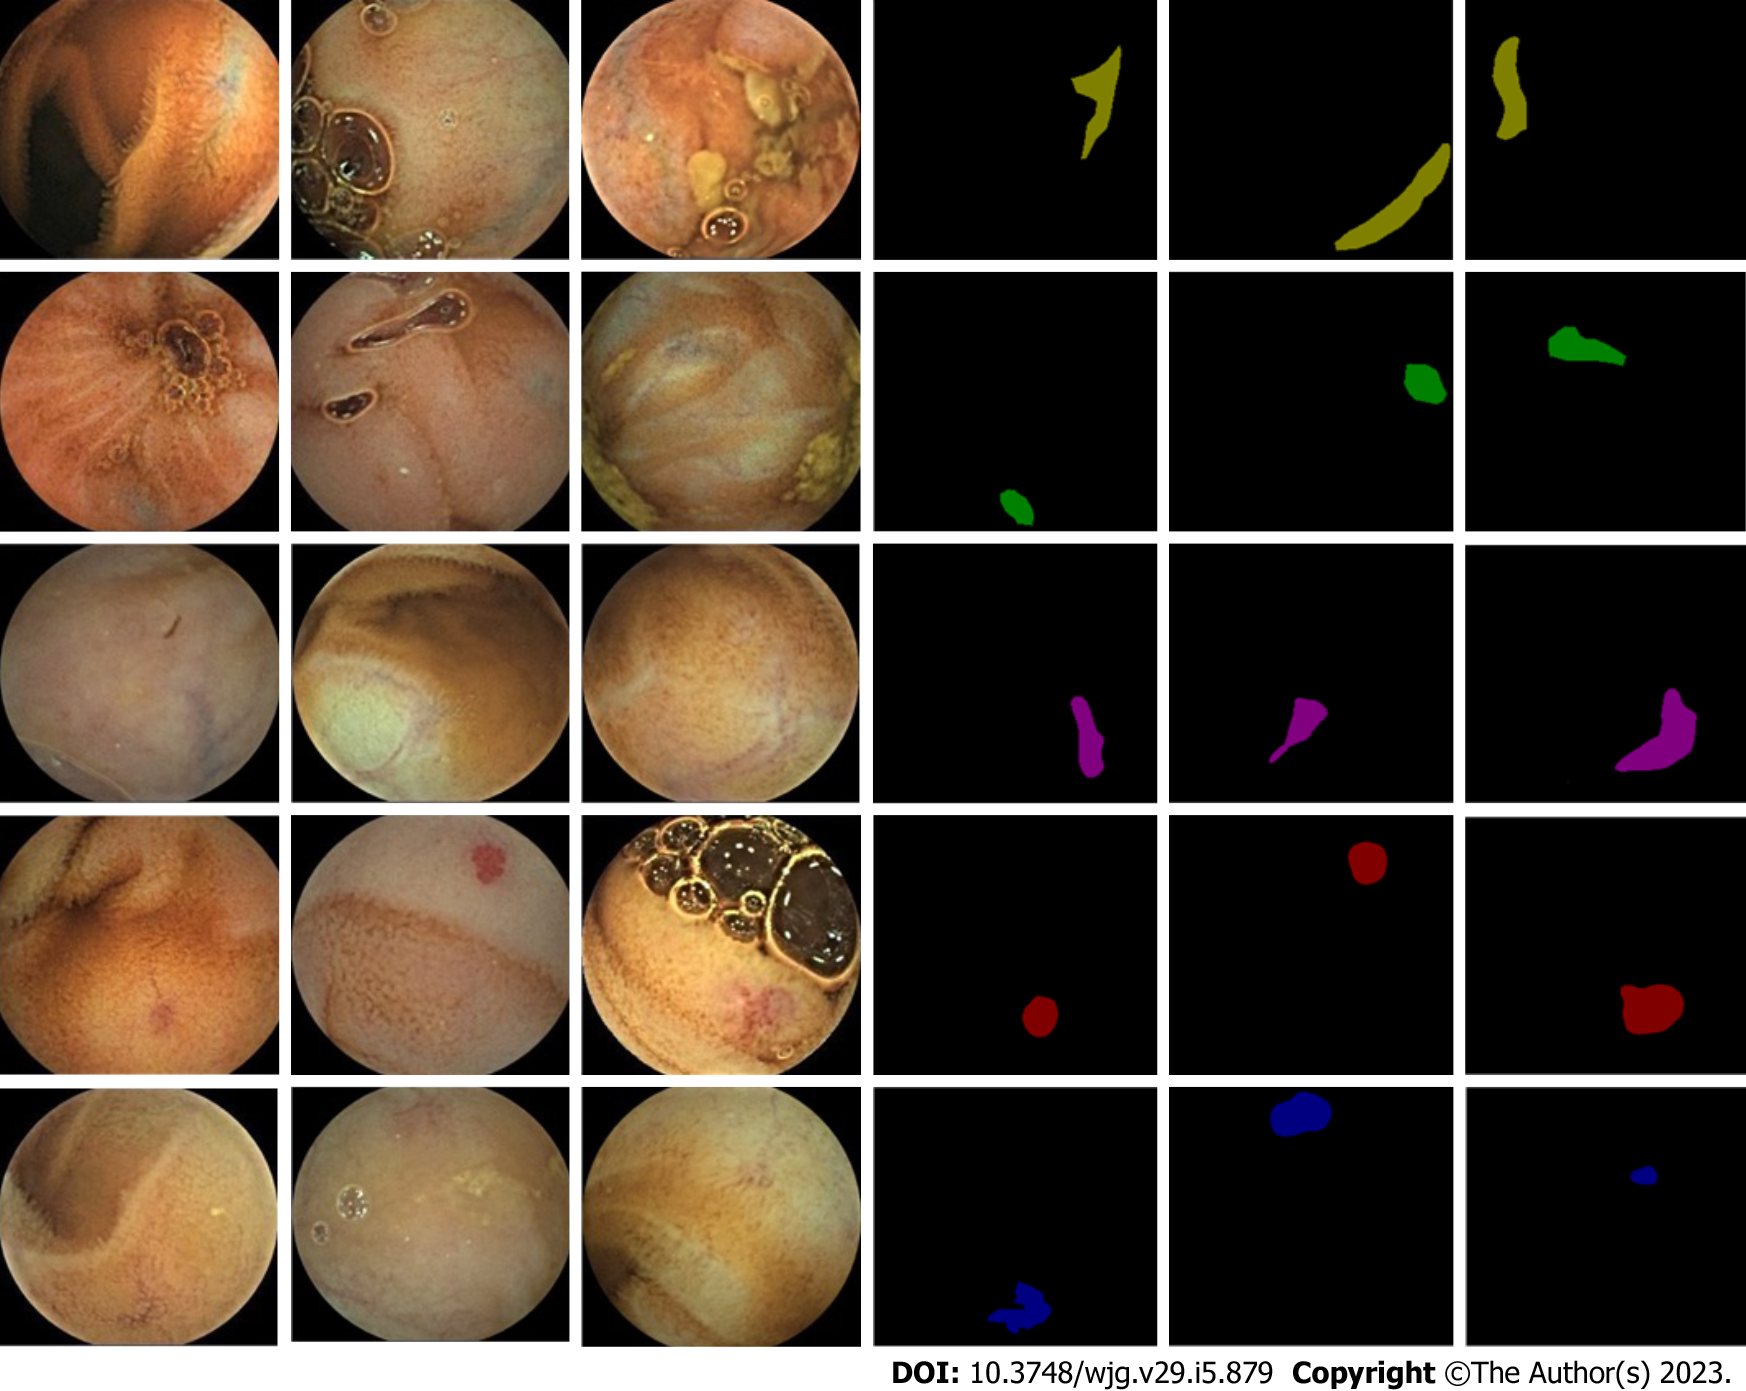
Figure 1 Sample image of training data.
The left three columns are the original image of the capsule, and the right three columns are the manual annotation results.
Figure 2 Network structure diagram.
This figure shows the structure of semantic segmentation network, in which the first two modules are shallow and deep feature fusion, the third module is pixel classifier, and finally the network output results.
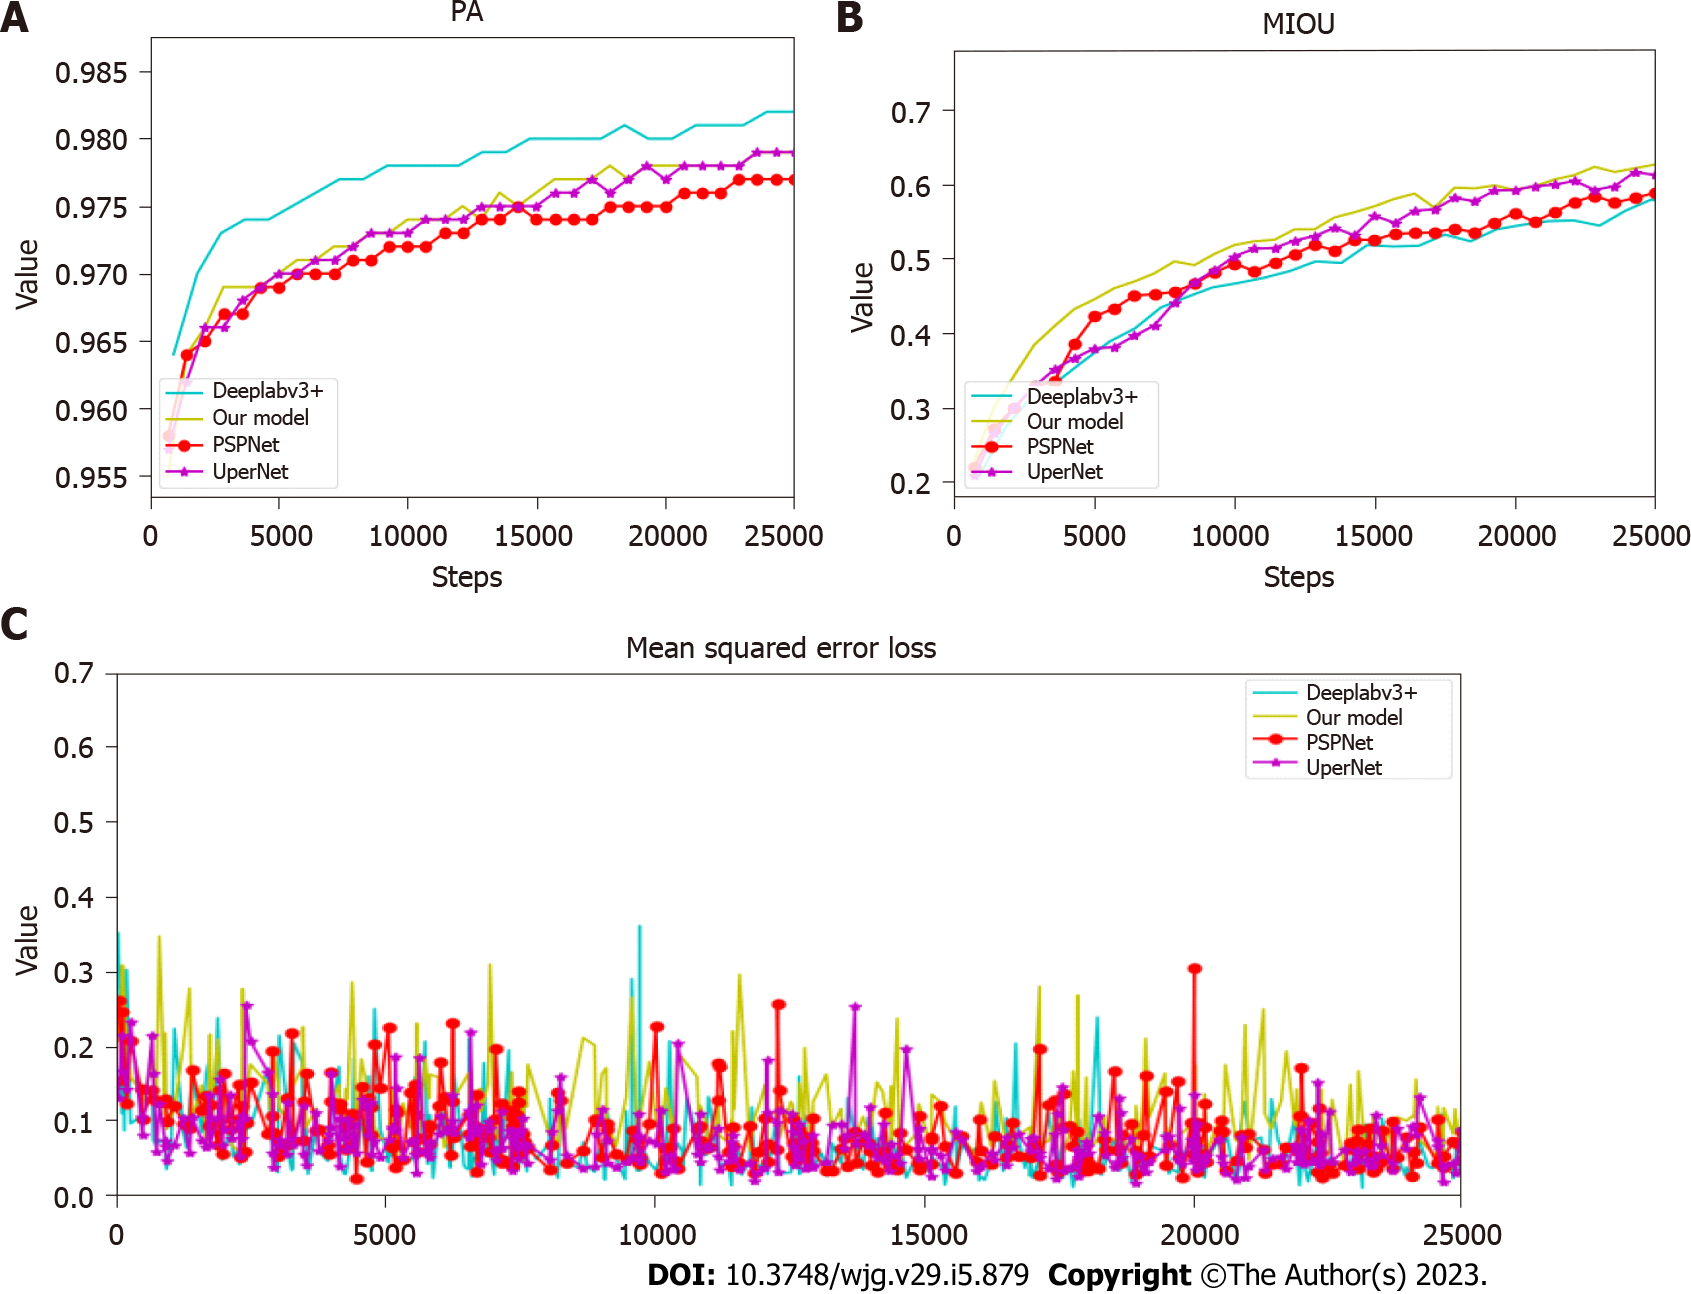
Figure 3 Change process of loss, pixel accuracy and mean intersection over union.
A: Comparation of the pixel accuracy (PA) values of each model during training. The abscissa represents the number of training iterations, and the ordinate represents the value of PA; B: Comparation of the mean intersection over union (mIOU) values of each model during training. The abscissa represents the number of training iterations, and the ordinate represents the value of mIOU; C: Comparation of the loss value of each model in the training process. The abscissa represents the number of training iterations, and the ordinate represents the loss value. PA: Pixel accuracy; mIOU: Mean intersection over union.
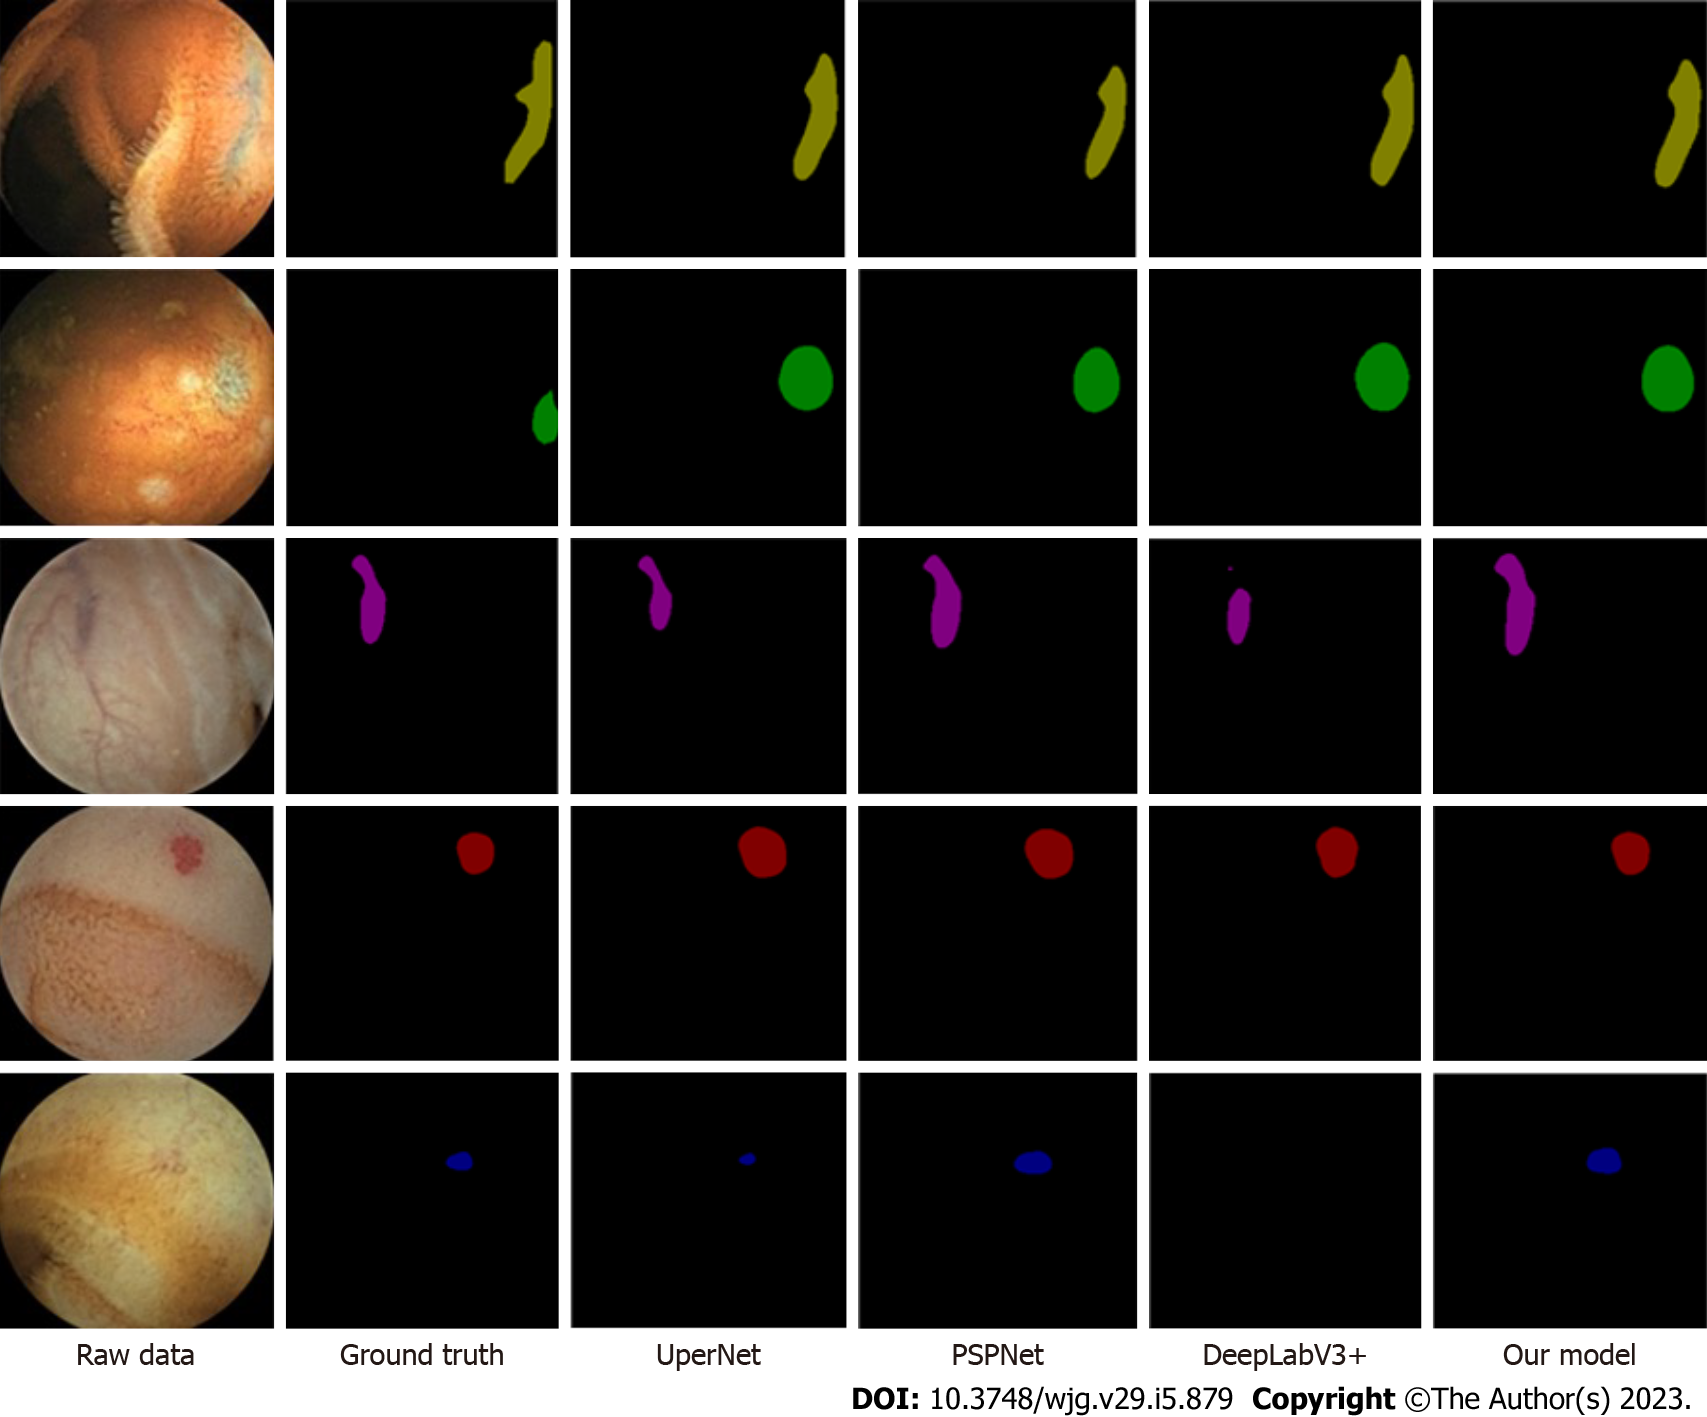
Figure 4 Five rows from top to bottom: blue branch, blue lumpy, red branch, red lumpy and red spider nevus.
The first column on the left is the original image, the middle four columns are the results of the current excellent segmentation network, and the last column is the results of the model we proposed.
- Citation: Chu Y, Huang F, Gao M, Zou DW, Zhong J, Wu W, Wang Q, Shen XN, Gong TT, Li YY, Wang LF. Convolutional neural network-based segmentation network applied to image recognition of angiodysplasias lesion under capsule endoscopy. World J Gastroenterol 2023; 29(5): 879-889
- URL: https://www.wjgnet.com/1007-9327/full/v29/i5/879.htm
- DOI: https://dx.doi.org/10.3748/wjg.v29.i5.879


