Copyright
©The Author(s) 2023.
World J Gastroenterol. Dec 28, 2023; 29(48): 6222-6234
Published online Dec 28, 2023. doi: 10.3748/wjg.v29.i48.6222
Published online Dec 28, 2023. doi: 10.3748/wjg.v29.i48.6222
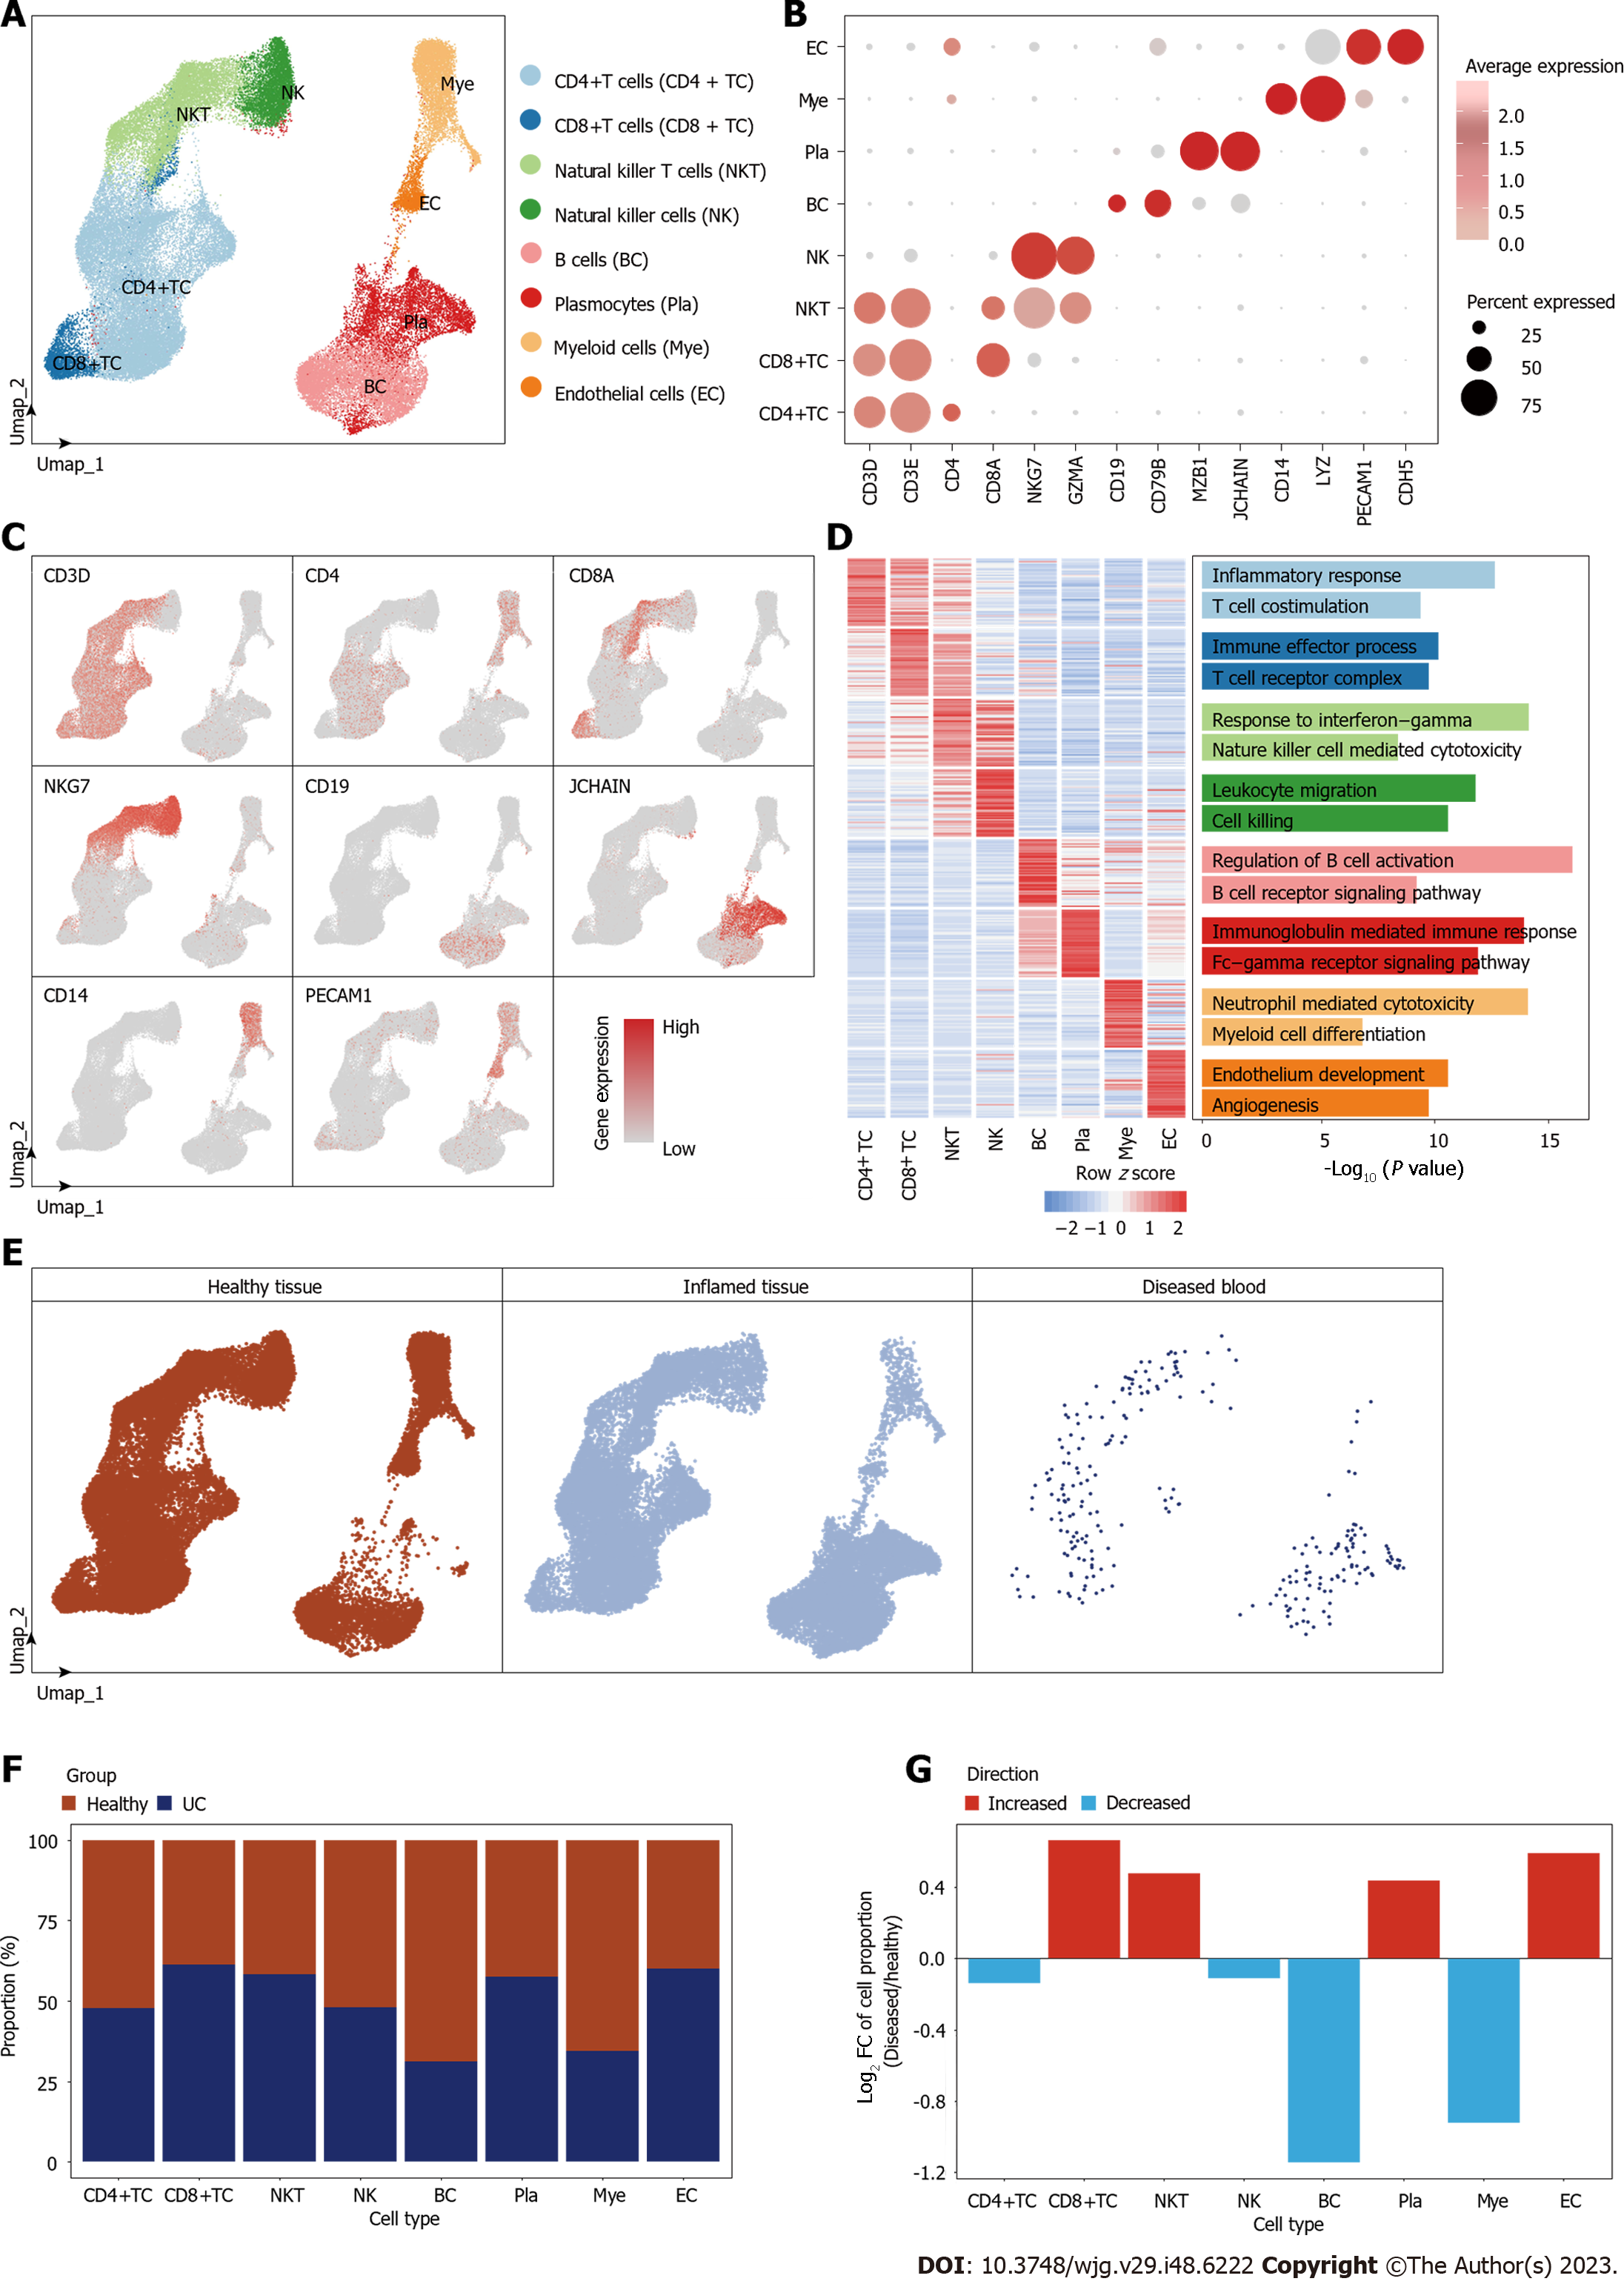
Figure 1 Cell type identification and cell proportion diversity during ulcerative colitis.
A: Umap plot showing different cell types distribution in human clonal tissues; B: Dot plot showing the gene expression levels of the classic marker genes of each cell type; C: Umap plots showing the expression profiles of indicated cell-type-specific marker genes. The color key from gray to red indicates low to high gene expression levels; D: Heatmap showing the gene expression levels of the top 50 cell-type-specific marker genes for each cell type, with corresponding functional annotations on the right. The color key from blue to red represents low to high gene expression levels; E: Umap plots showing distribution of each group of human clonal tissues; F: Bar plot showing the cell proportion distribution of each cell type in healthy and ulcerative colitis tissues; G: Bar plot showing the fold change level of cell proportion during lesion. CD4+ TC: CD4+ T cells; CD8+ TC: CD8+ T cells; NKT: Natural killer T cells; NK: Natural killer cells; BC: B cells; Pla: Plasmocytes; Mye: Myeloid cells; EC: Endothelial cells.
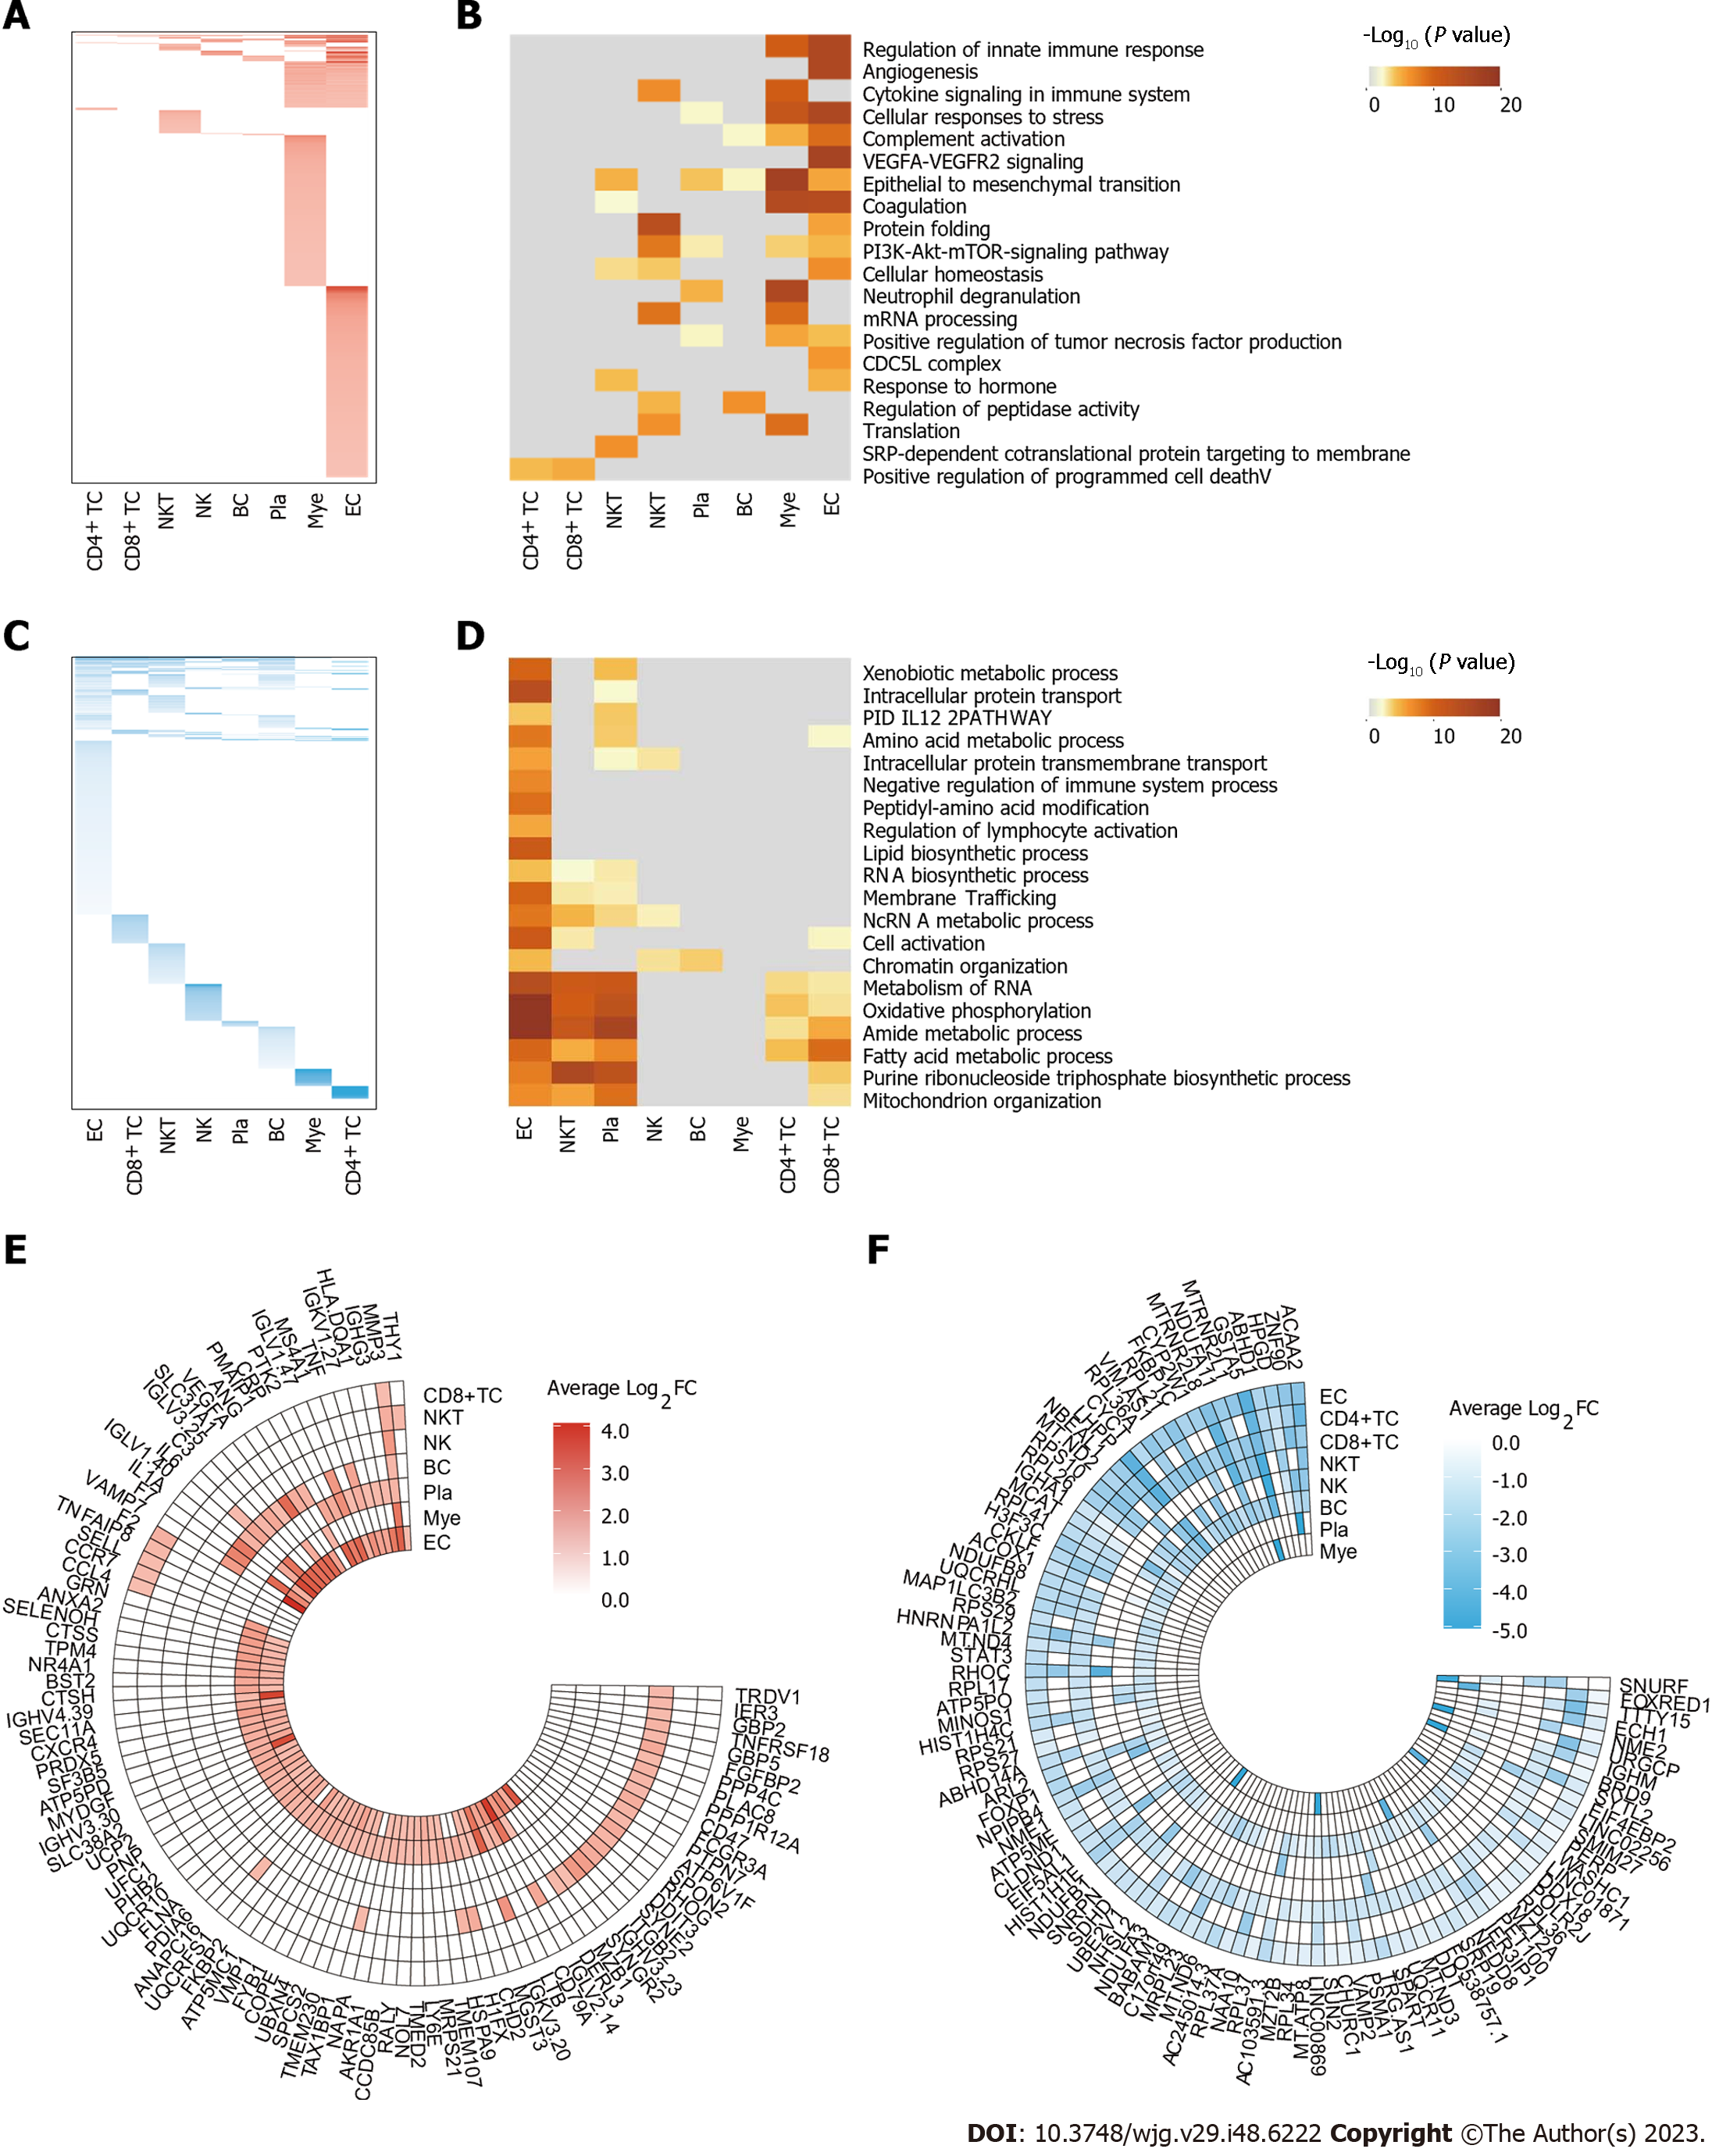
Figure 2 Alterations in transcriptional profiles across different cell types during ulcerative colitis.
A: Heatmap showing the distribution of upregulated differential expression genes (DEGs) (adjusted P value ≤ 0.05, Log2FC ≥ 0.25) for each cell type between healthy and ulcerative colitis groups (diseased/healthy); B: Heatmap showing the gene function annotations of upregulated DEGs; C: Heatmap showing the distribution of downregulated DEGs (adjusted P value ≤ 0.05, Log2FC ≤ 0.25) for each cell type between healthy and ulcerative colitis groups (diseased/healthy); D: Heatmap showing the gene function annotations of downregulated DEGs; E: Ring heatmap showing the top 100 upregulated DEGs during ulcerative colitis; F: Ring heatmap showing the top 100 downregulated DEGs during ulcerative colitis.
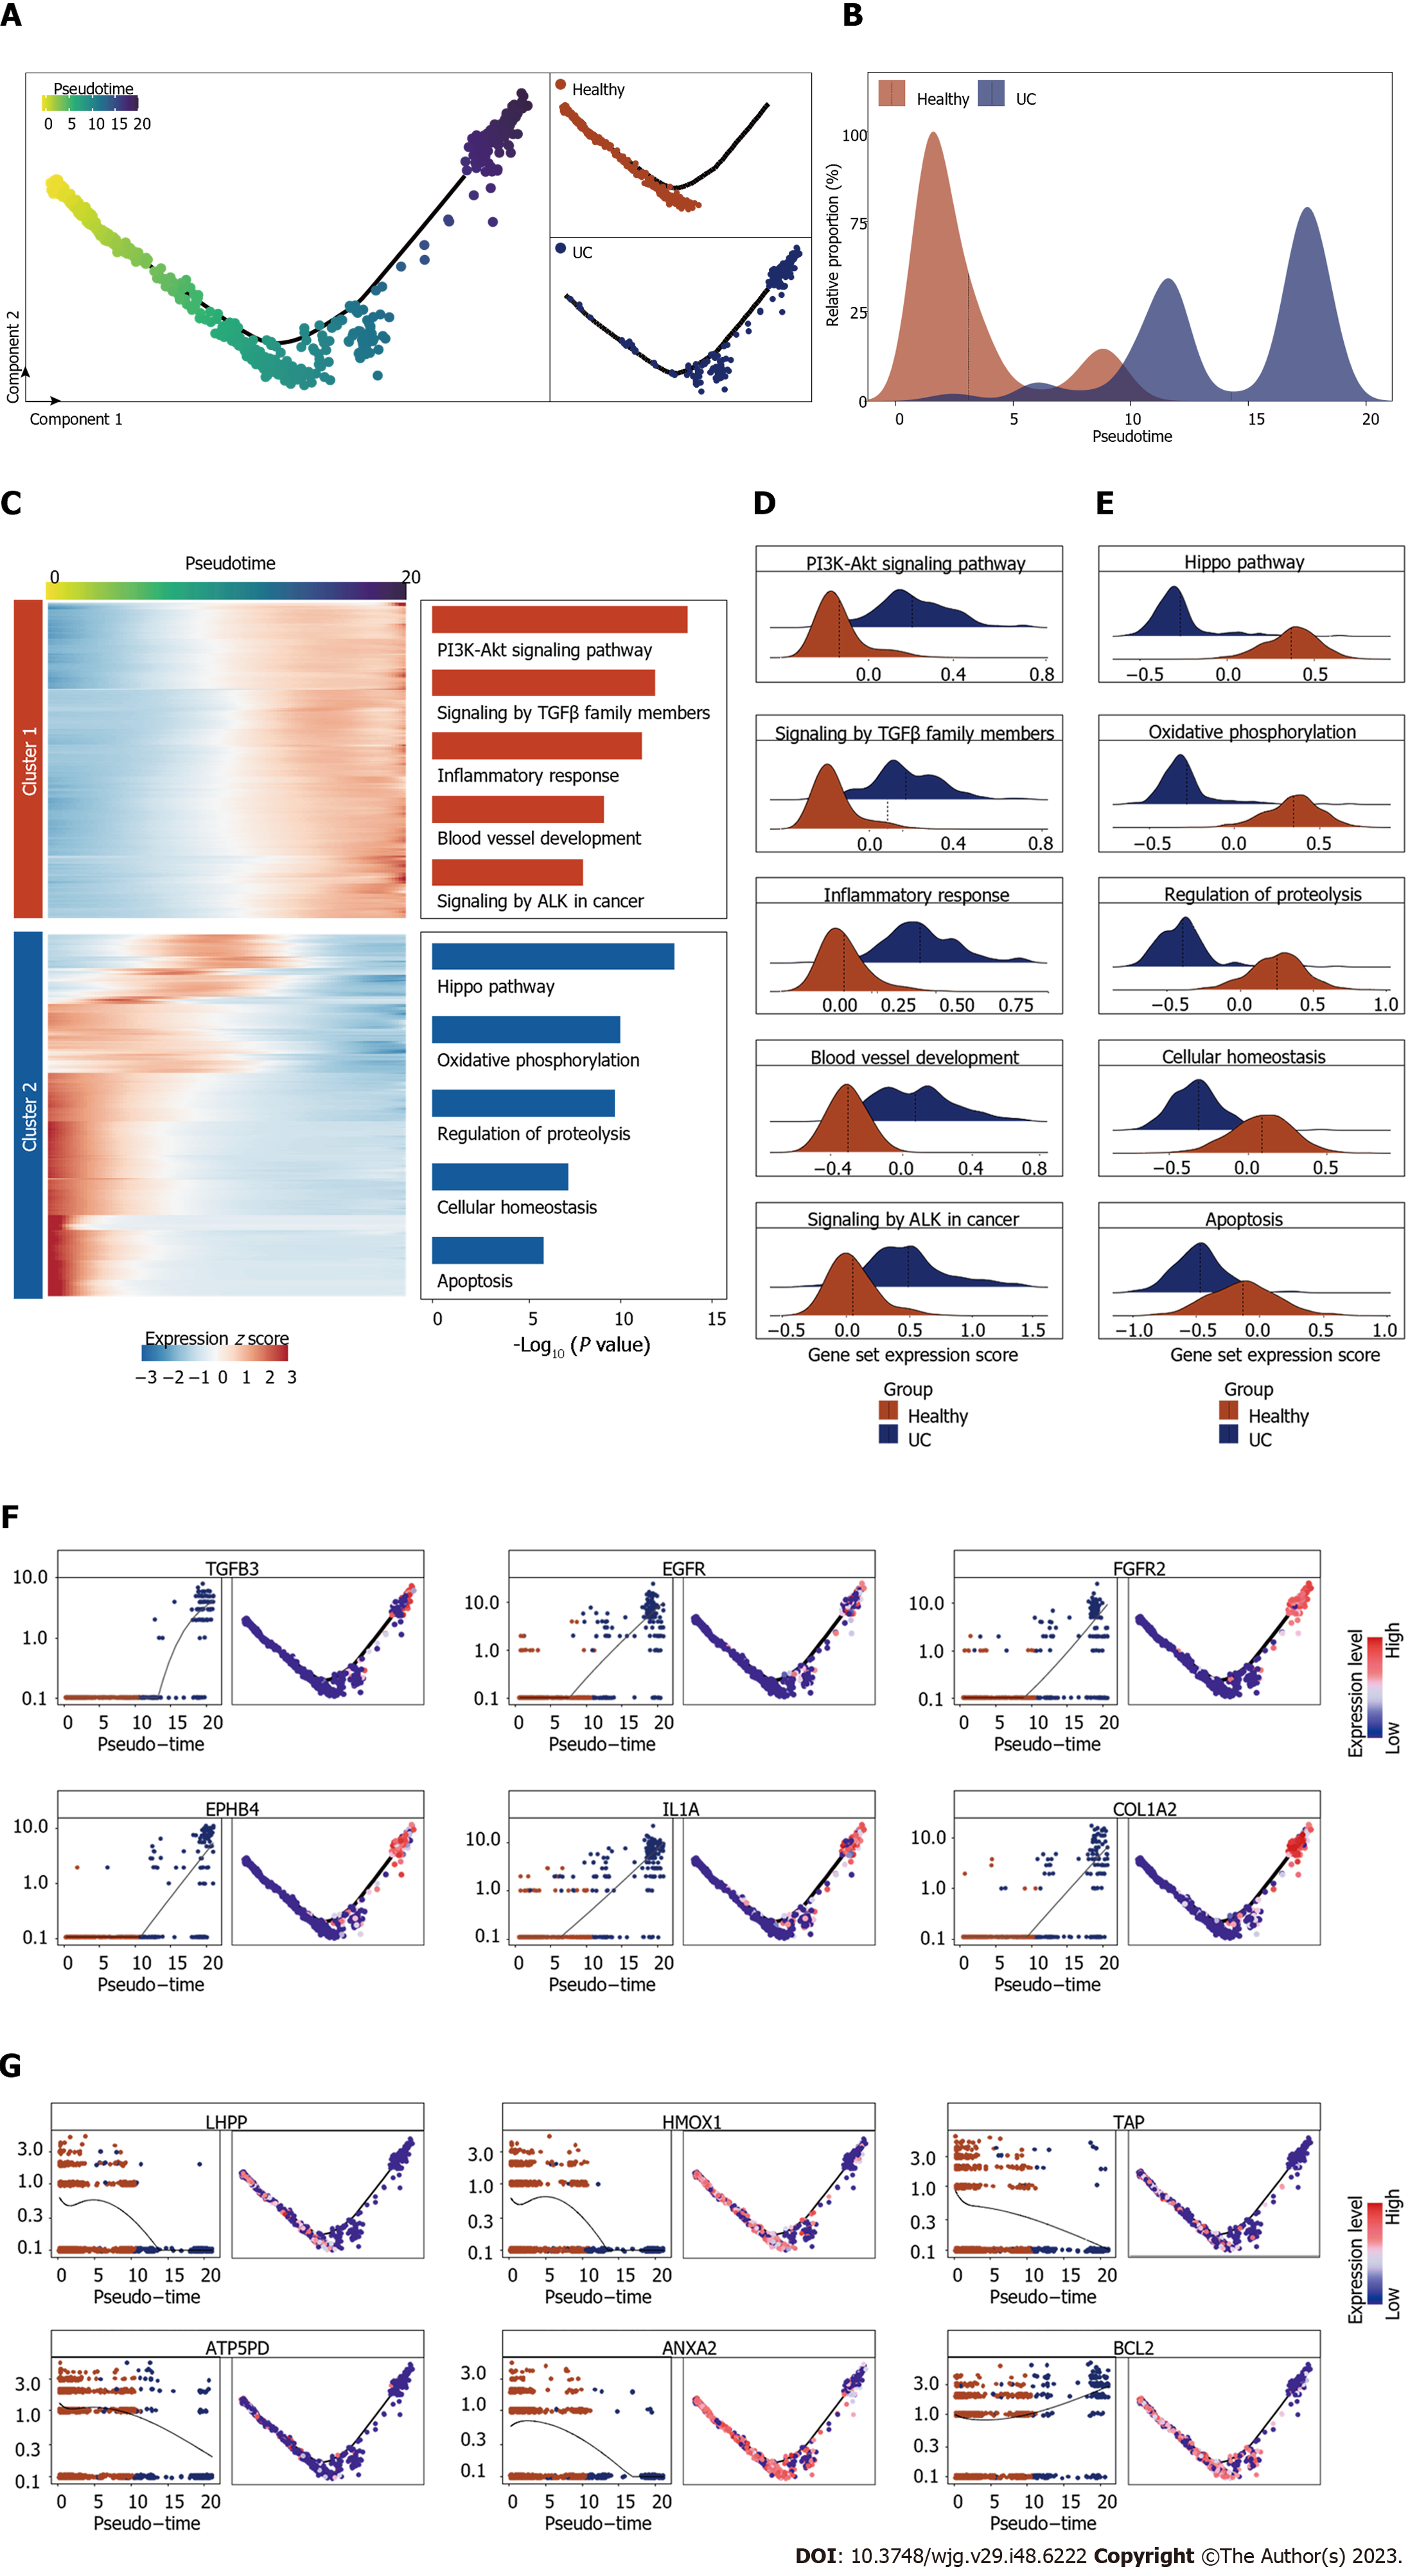
Figure 3 Cellular and molecular dynamics of endothelial cells during ulcerative colitis progression.
A: Pseudotime trajectory analysis of endothelial cell (EC). Left, pseudotime scores of EC. Top right, the distribution of ECs in healthy group. Bottom right, the distribution of ECs in ulcerative colitis group; B: Ridge plot showing the cell number distribution of EC in healthy and ulcerative colitis groups along pseudotime trajectory of Figure 3A; C: Heatmap showing the time-related gene expression profiles during ulcerative colitis, with gene function annotation on the right; D: Ridge plots showing the expression score of gene set from cluster 1 in Figure 3C of healthy and ulcerative colitis groups; E: Ridge plots showing the expression score of gene set from cluster 2 in Figure 3C of healthy and ulcerative colitis groups; F: Scatter plots and trajectory plots showing the expression level of top genes in cluster 1 of Figure 3C; G: Scatter plots and trajectory plots showing the expression level of top genes in cluster 2 of Figure 3C.
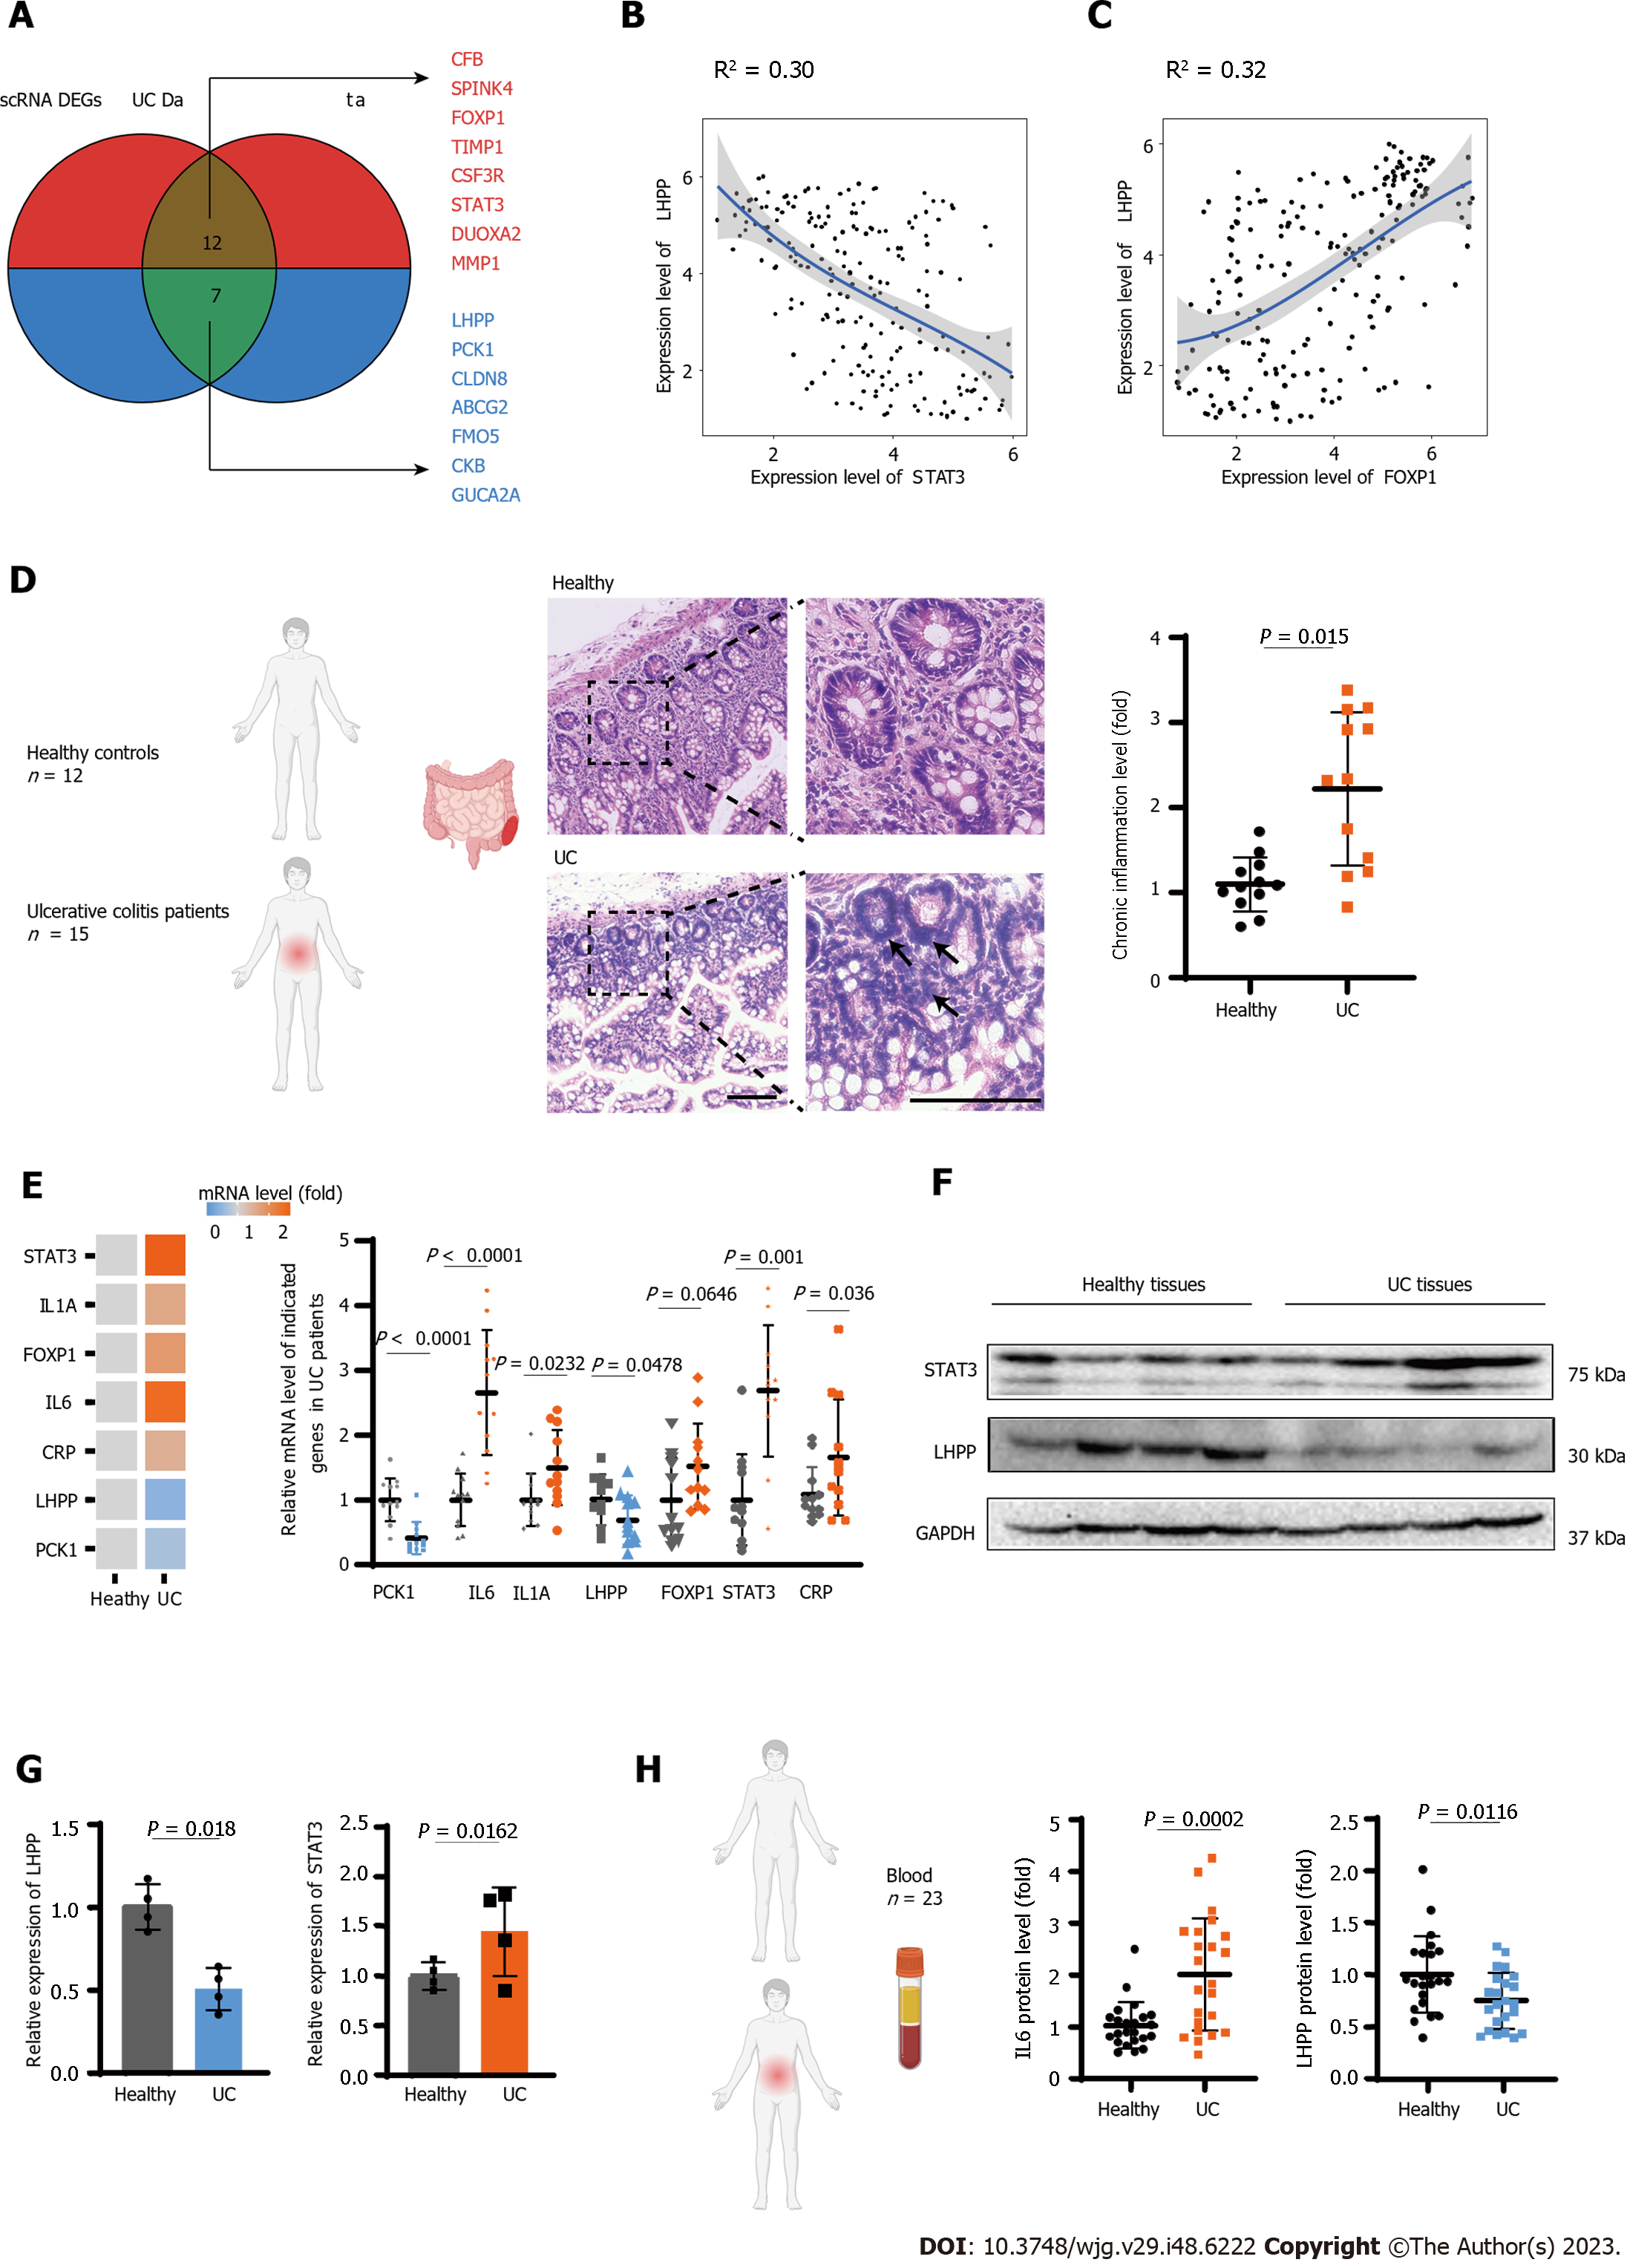
Figure 4 Phospholysine phosphohistidine inorganic pyrophosphate phosphatase was identified as a core regulator for ulcerative colitis.
A: Venn plot showing the overlap between differential expression genes and public ulcerative colitis data; B: Scatter plot showing the correlation of expression levels between phospholysine phosphohistidine inorganic pyrophosphate phosphatase (LHPP) and signal transducer and activator of transcription 3 (STAT3); C: Scatter plot showing the correlation of expression levels between LHPP and FOXP1; D: HE stained colon biopsy samples from healthy individuals and patients diagnosed with ulcerative colitis (UC). Representative images were captured at × 20 magnification. Black arrows: Increased chronic inflammatory infiltrate; E: The relative mRNA level of STAT3, FOXP1, IL6, IL1A, CRP, LHPP, and PCK1 was detected in 12 paired heathy and UC patient tissues; F: Western blot verifying differential STAT3 and LHHP expression in heathy and UC patient tissues; G: The relative expression analysis of STAT3 and LHHP in heathy and UC patient tissues; H: Enzyme-linked immunosorbent assay analysis of IL6 and LHPP levels in serum of heathy and UC patient.
- Citation: Wang YF, He RY, Xu C, Li XL, Cao YF. Single-cell analysis identifies phospholysine phosphohistidine inorganic pyrophosphate phosphatase as a target in ulcerative colitis. World J Gastroenterol 2023; 29(48): 6222-6234
- URL: https://www.wjgnet.com/1007-9327/full/v29/i48/6222.htm
- DOI: https://dx.doi.org/10.3748/wjg.v29.i48.6222


