Copyright
©The Author(s) 2023.
World J Gastroenterol. Nov 28, 2023; 29(44): 5919-5934
Published online Nov 28, 2023. doi: 10.3748/wjg.v29.i44.5919
Published online Nov 28, 2023. doi: 10.3748/wjg.v29.i44.5919
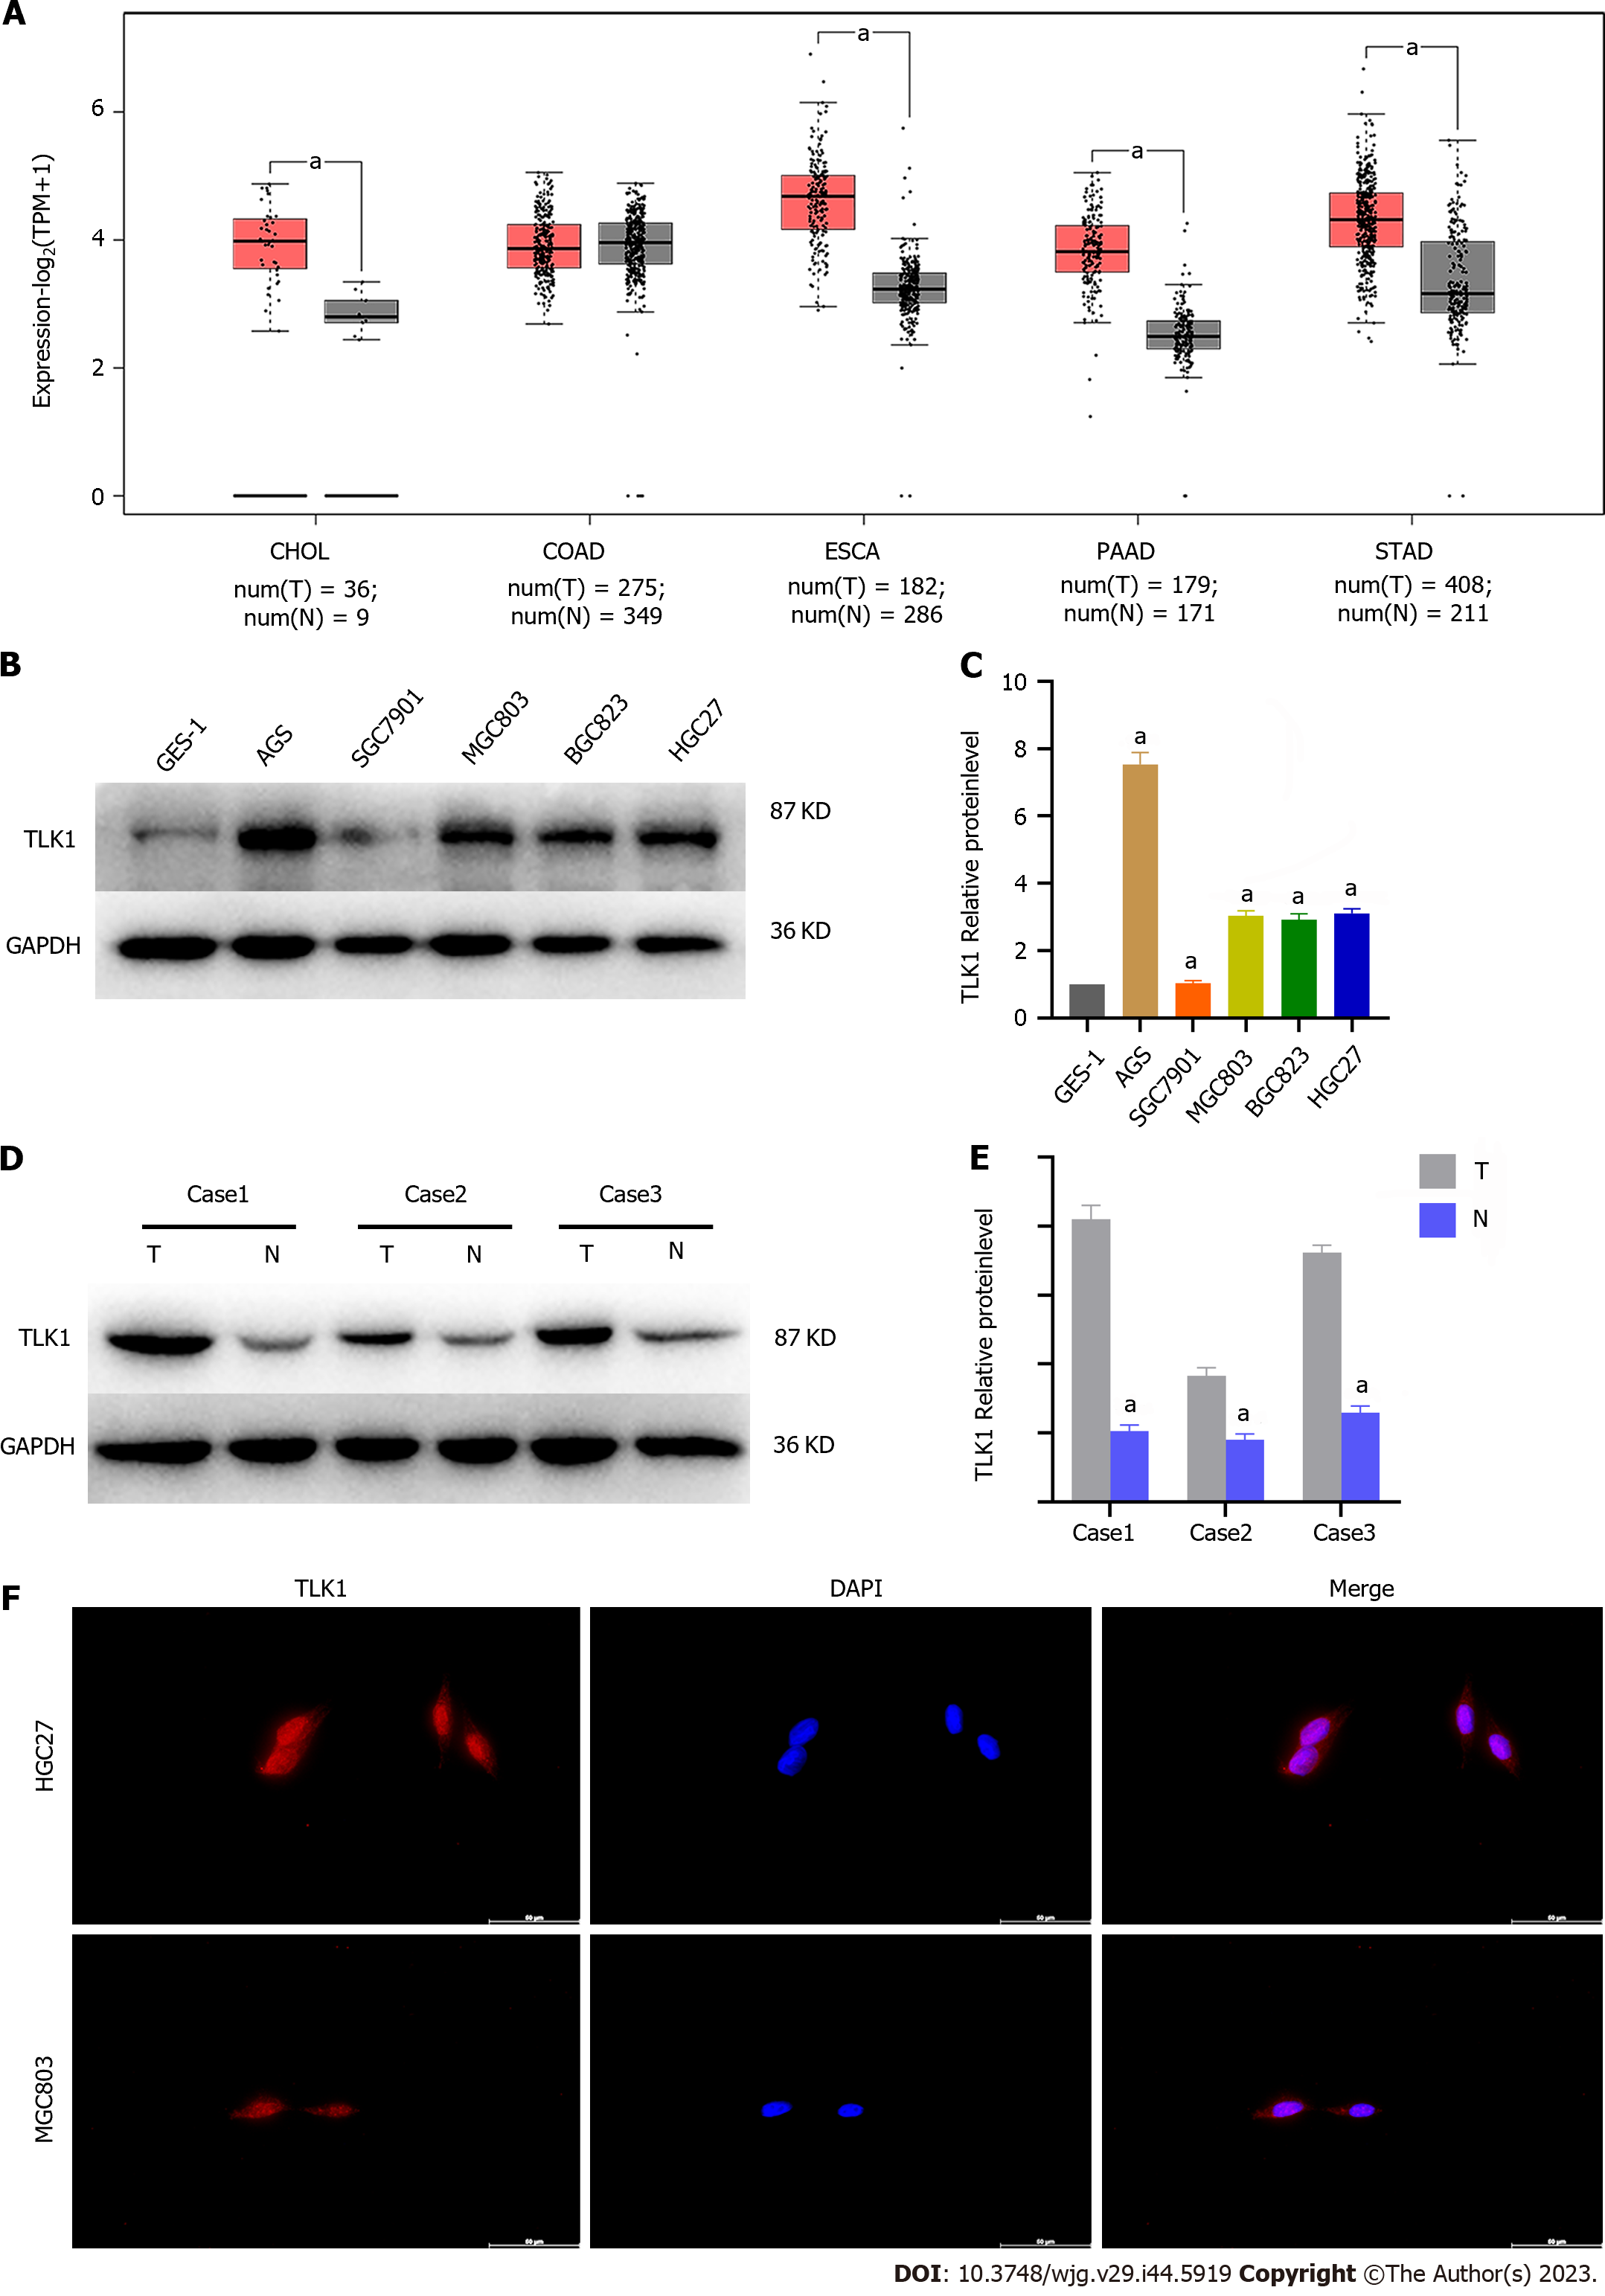
Figure 1 Tousled-like kinase 1 was upregulated and localized mainly to the nucleus in gastric cancers.
A: Tousled-like kinase 1 (TLK1) expression in various tumors was explored using The Cancer Genome Atlas database; B and C: Western blot measuring TLK1 expression in normal gastric epithelial cells GES-1 and in gastric cancer (GC) cell lines; D and E: Western blot detecting differential TLK1 expression between GC and adjacent non-neoplastic tissues; F: Immunofluorescence detecting subcellular TLK1 compartmentalization in HGC27 and MGC803 cell lines. aP < 0.05. TLK1: Tousled-like kinase 1; CHOL: Cholangiocarcinoma; COAD: Colon adenocarcinoma; ESCA: Esophageal carcinoma; PAAD: Pancreatic adenocarcinoma; STAD: Stomach adenocarcinoma.
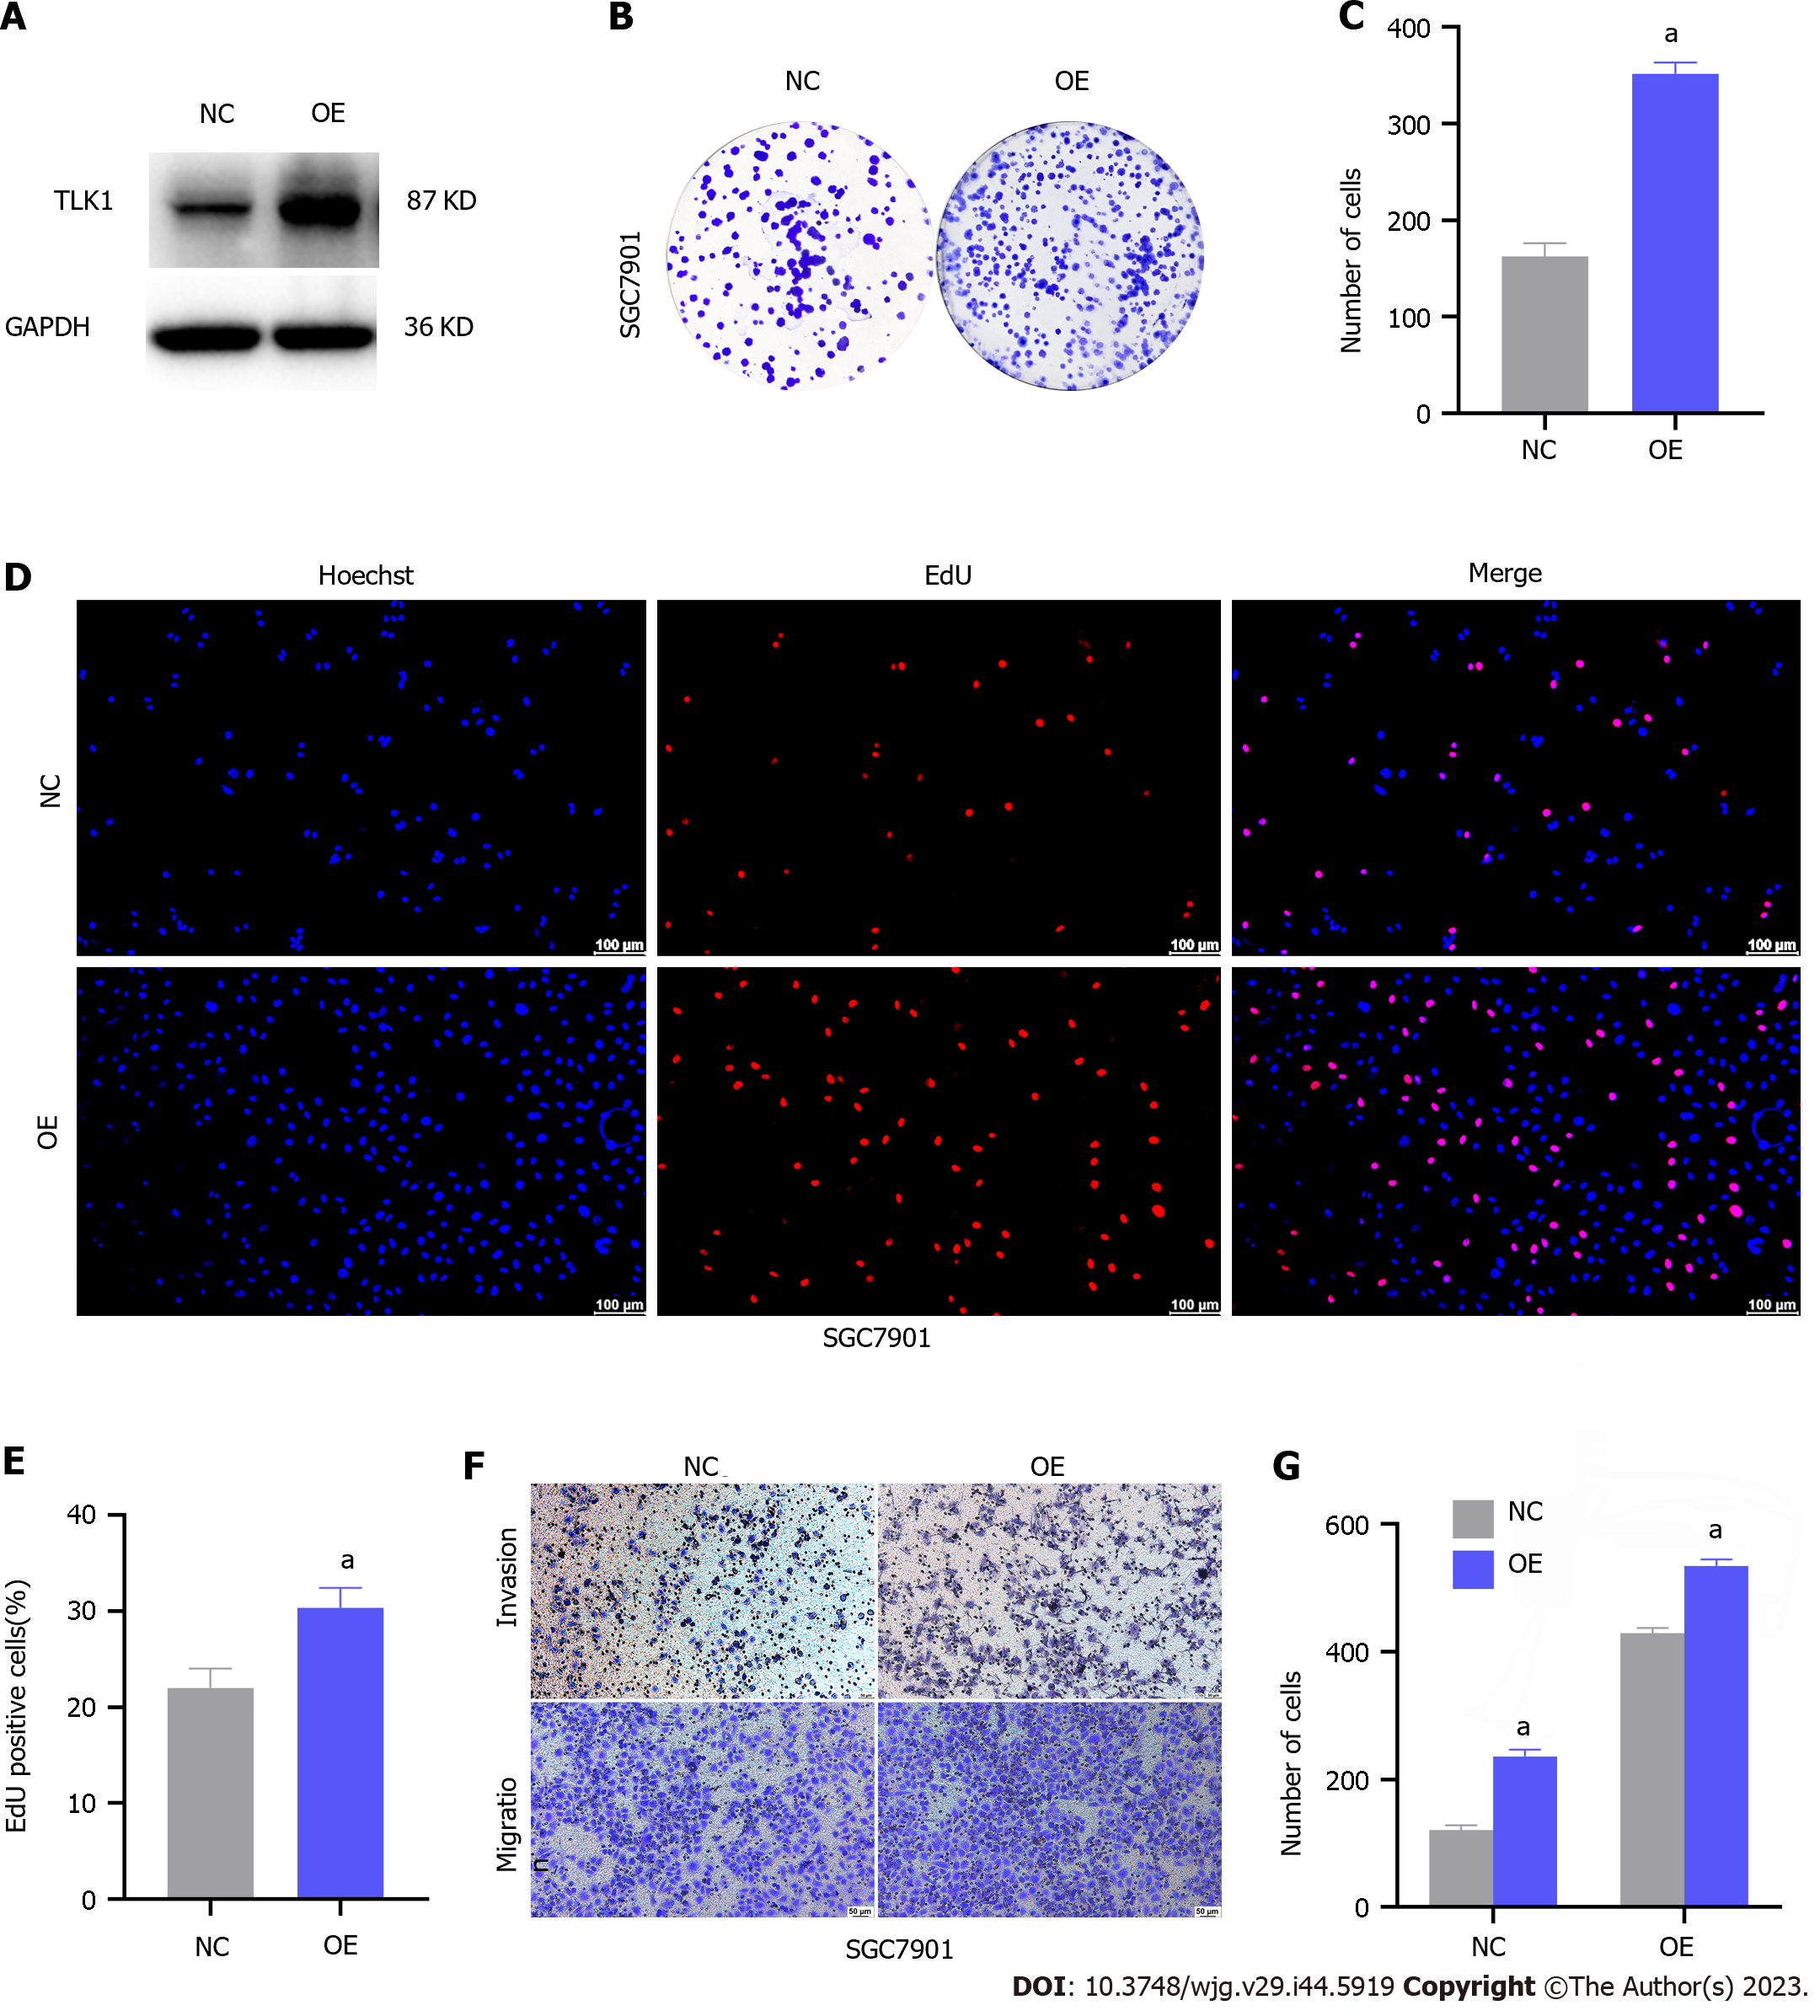
Figure 2 Tousled-like kinase 1 upregulation potentiated tumorigenesis in gastric cancer cell lines.
A: Western blot demonstrated the effects of Tousled-like kinase 1 (TLK1) overexpression in SGC7901 cells; B and C: Impact of TLK1 overexpression on clonogenesis in SGC7901 cells; D and E: 5-ethynyl-2`-deoxyuridine assay evaluating the influence of TLK1 overexpression on SGC7901 cell proliferation; F and G: Transwell assay showing the effects of TLK1 overexpression on SGC7901 cell invasion and migration. aP < 0.05. TLK1: Tousled-like kinase 1; NC: Negative control; OE: Overexpression; EdU: 5-ethynyl-2`-deoxyuridine.
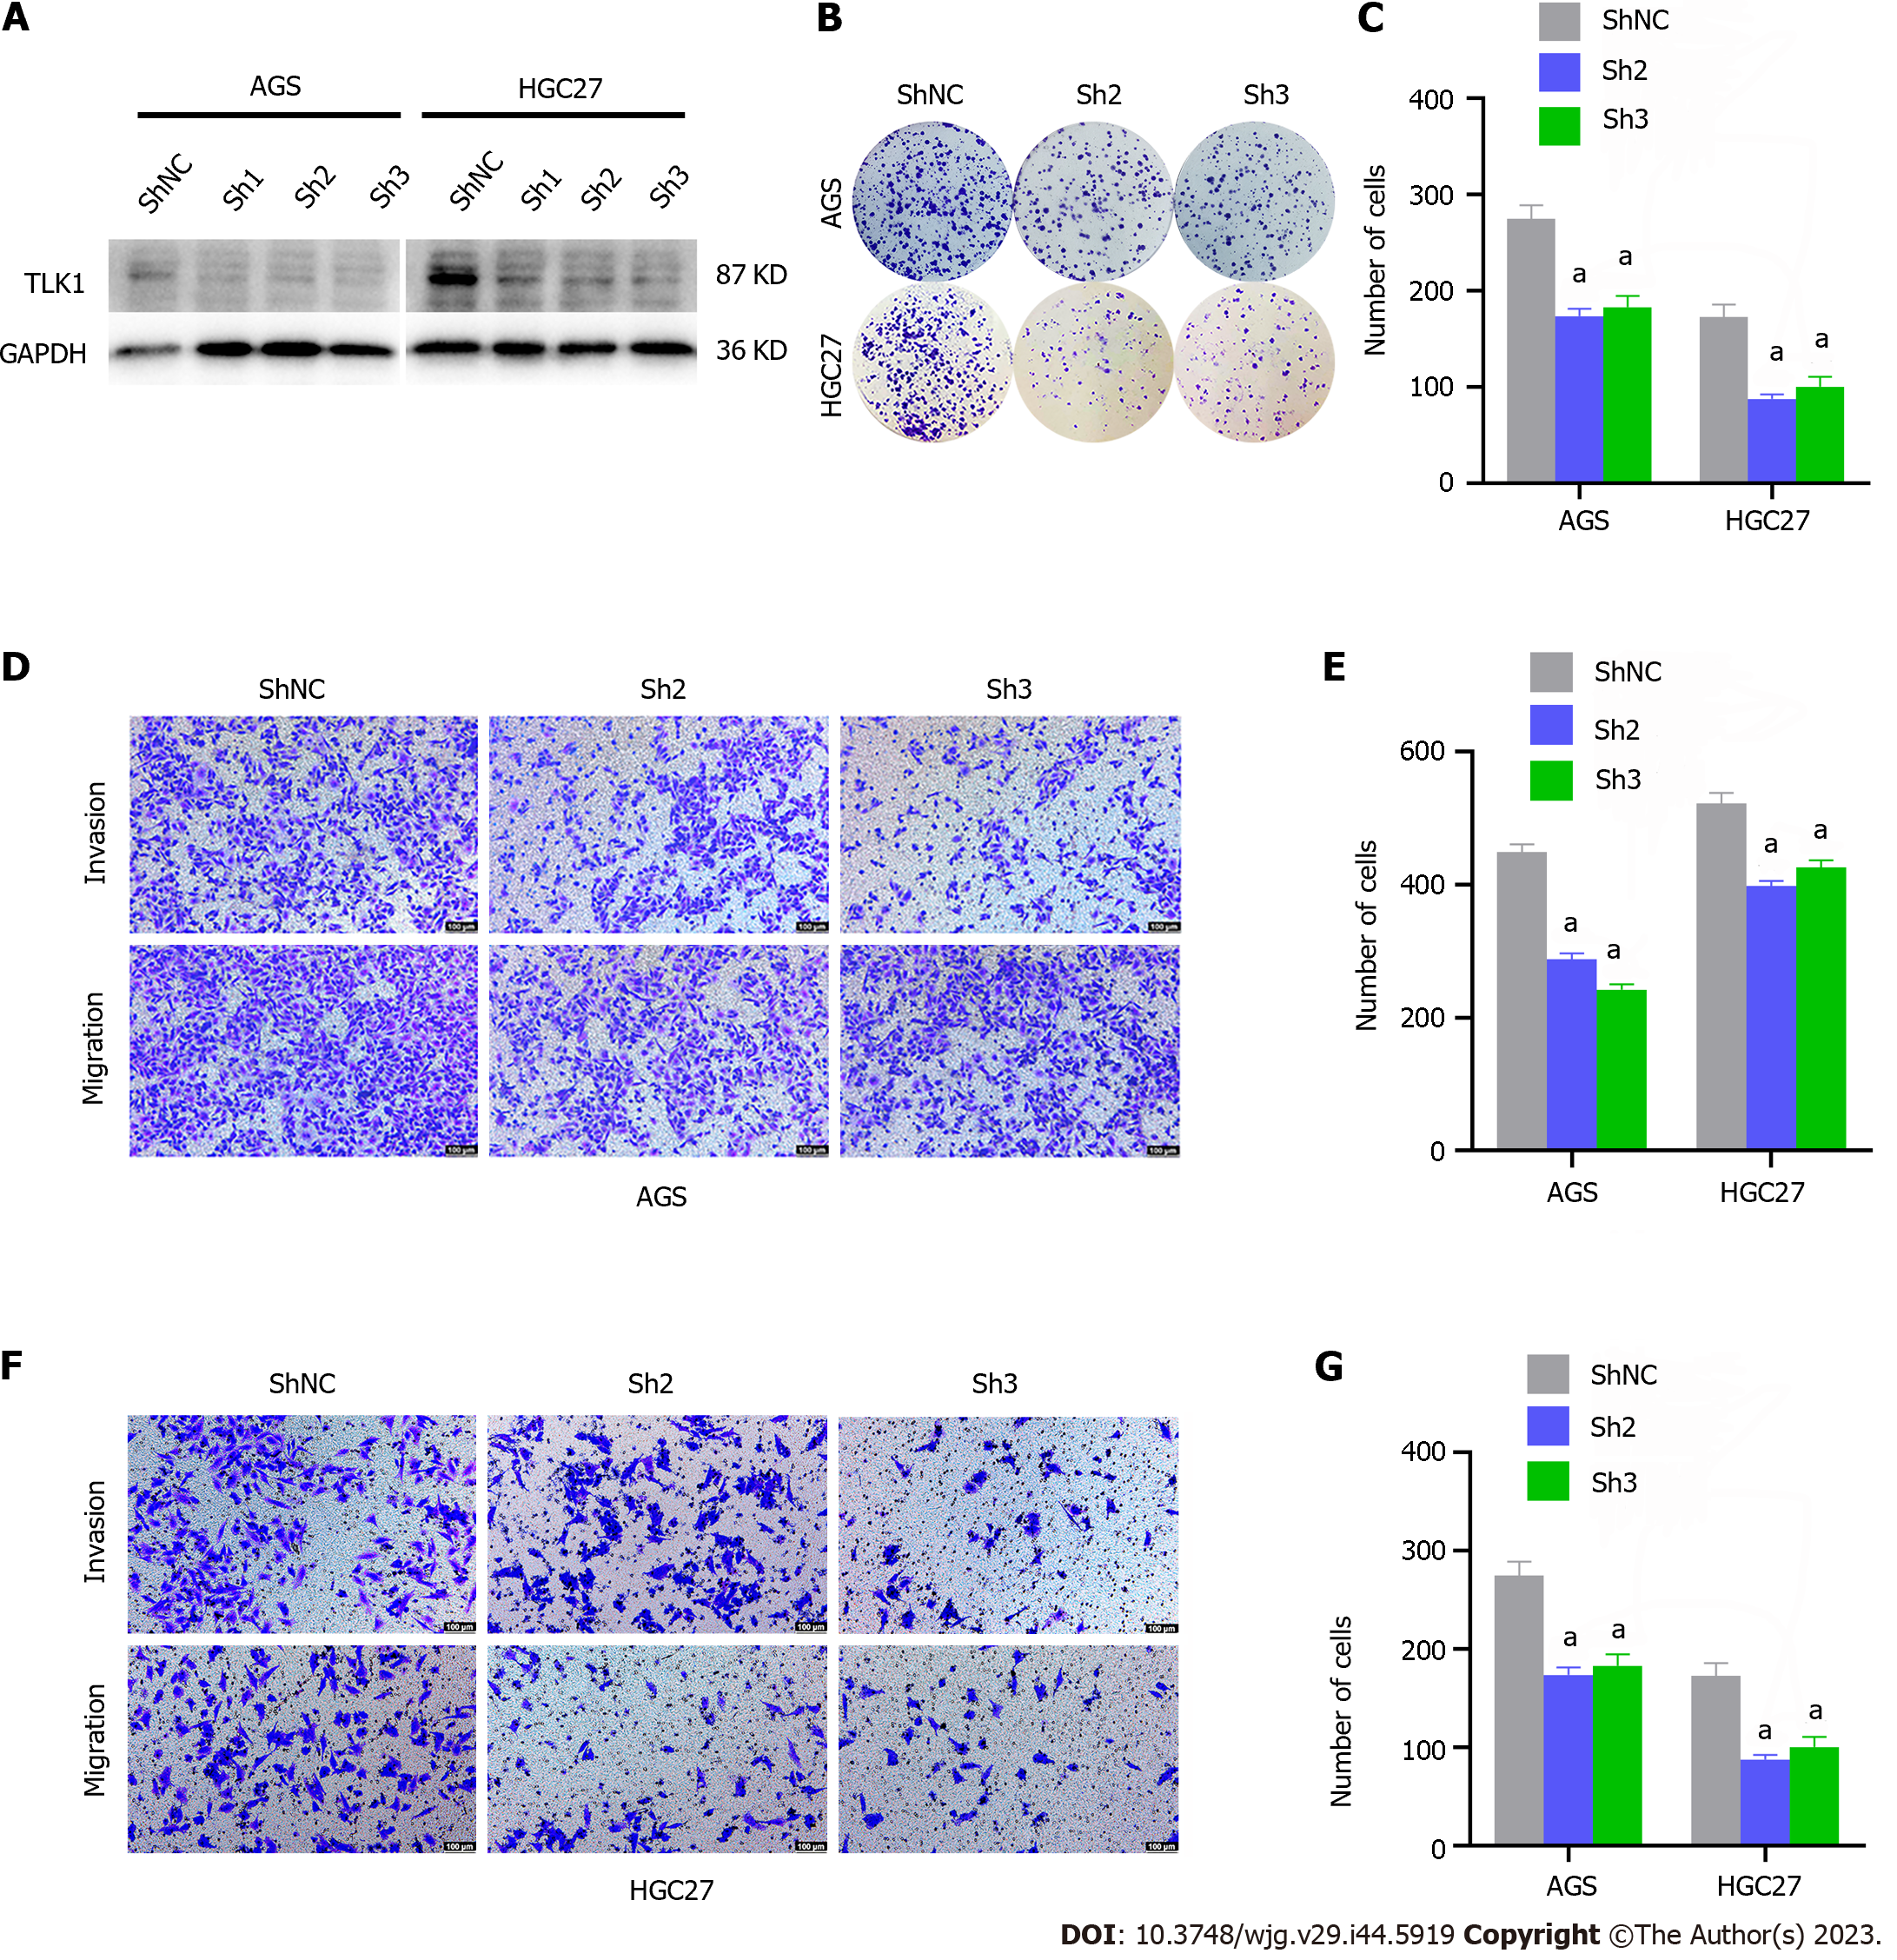
Figure 3 Tousled-like kinase 1 knockdown attenuated clonal formation, invasion, and migration in gastric cancer cell lines.
A: Western blot revealing the impact of Tousled-like kinase 1 (TLK1) knockdown on AGS and HGC27 cell lines; B and C: Effects of TLK1 suppression on clonogenesis in AGS and HGC27 cell lines; D and E: Transwell assay disclosing the effects of TLK1 knockdown on AGS cell invasion and migration; F and G: Transwell assay demonstrating the influences of TLK1 suppression on HGC27 cell invasion and migration. aP < 0.05. TLK1: Tousled-like kinase 1; shNC: Short hairpin RNA of negative control.
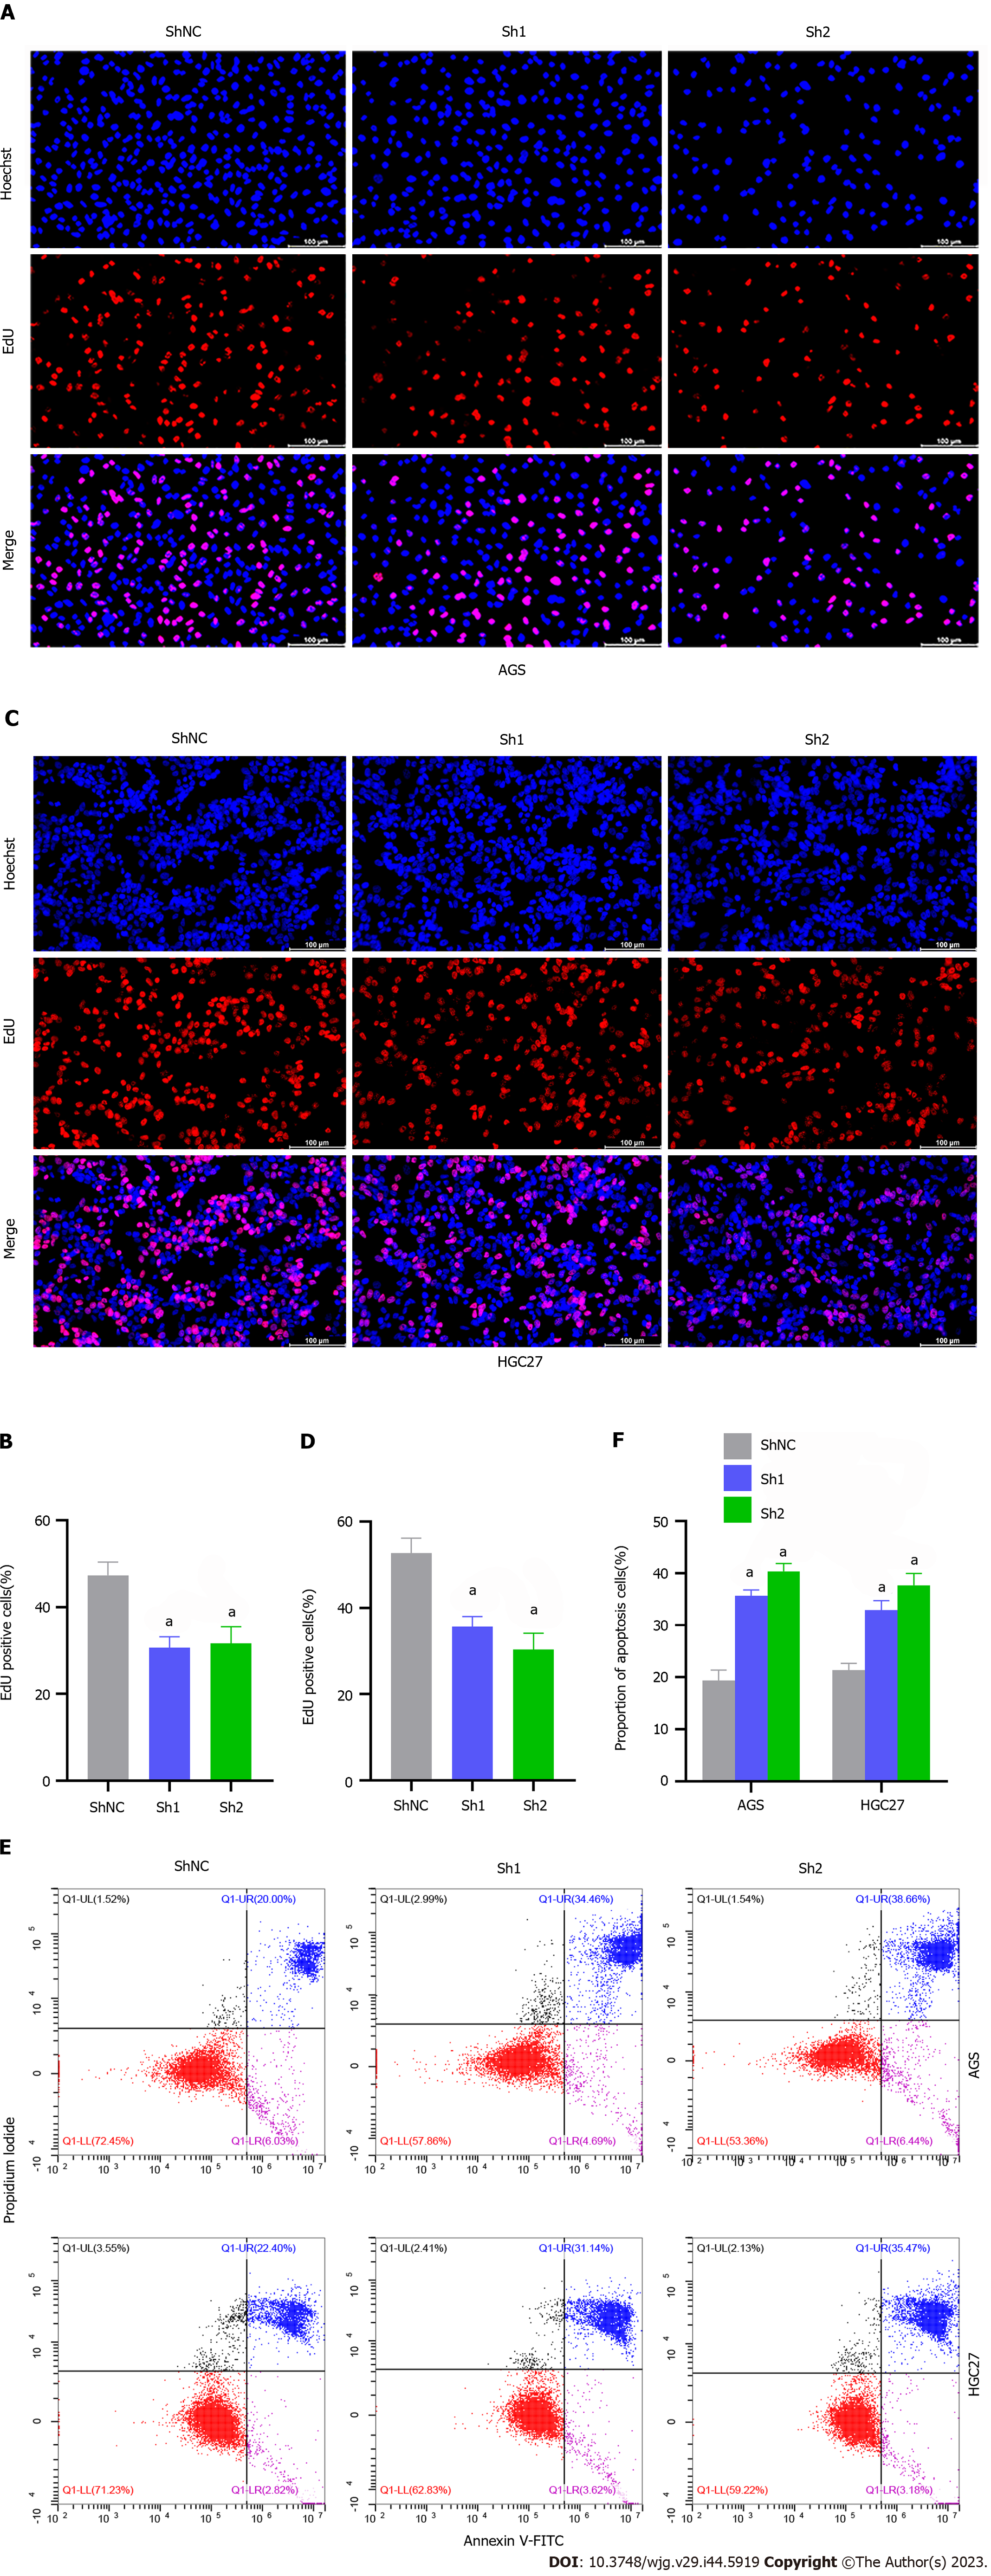
Figure 4 Tousled-like kinase 1 inhibition diminished proliferation and augmented apoptosis in gastric cancer cell lines.
A and B: 5-ethynyl-2`-deoxyuridine (EdU) assay showing the effects of Tousled-like kinase 1 (TLK1) suppression on AGS cell proliferation; C and D: EdU assay revealing the impact of TLK1 knockdown on HGC27 cell proliferation; E and F: Flow cytometry evaluating the effects of TLK1 inhibition on apoptosis in AGS and HGC27 cell lines. aP < 0.05. EdU: 5-ethynyl-2`-deoxyuridine; shNC: Short hairpin RNA of negative control.
Figure 5 Tousled-like kinase 1 drives gastric cancer progression by modulating the tumor growth factor-beta signaling pathway.
A and B: Genes positively and negatively correlated with Tousled-like kinase 1 (TLK1) were identified from The Cancer Genome Atlas database; C: Kyoto Encyclopedia of Genes and Genomes analysis identifying the differentially expressed genes and their associated enriched pathways; D: Gene set enrichment analysis of pathway enrichment; E–G: Western blot evaluating tumor growth factor-beta expression in gastric cancer cell lines in response to TLK1 knockdown or overexpression. aP < 0.05. TGF-beta: Tumor growth factor-beta; shNC: Short hairpin RNA of negative control; NC: Negative control; OE: Overexpression.
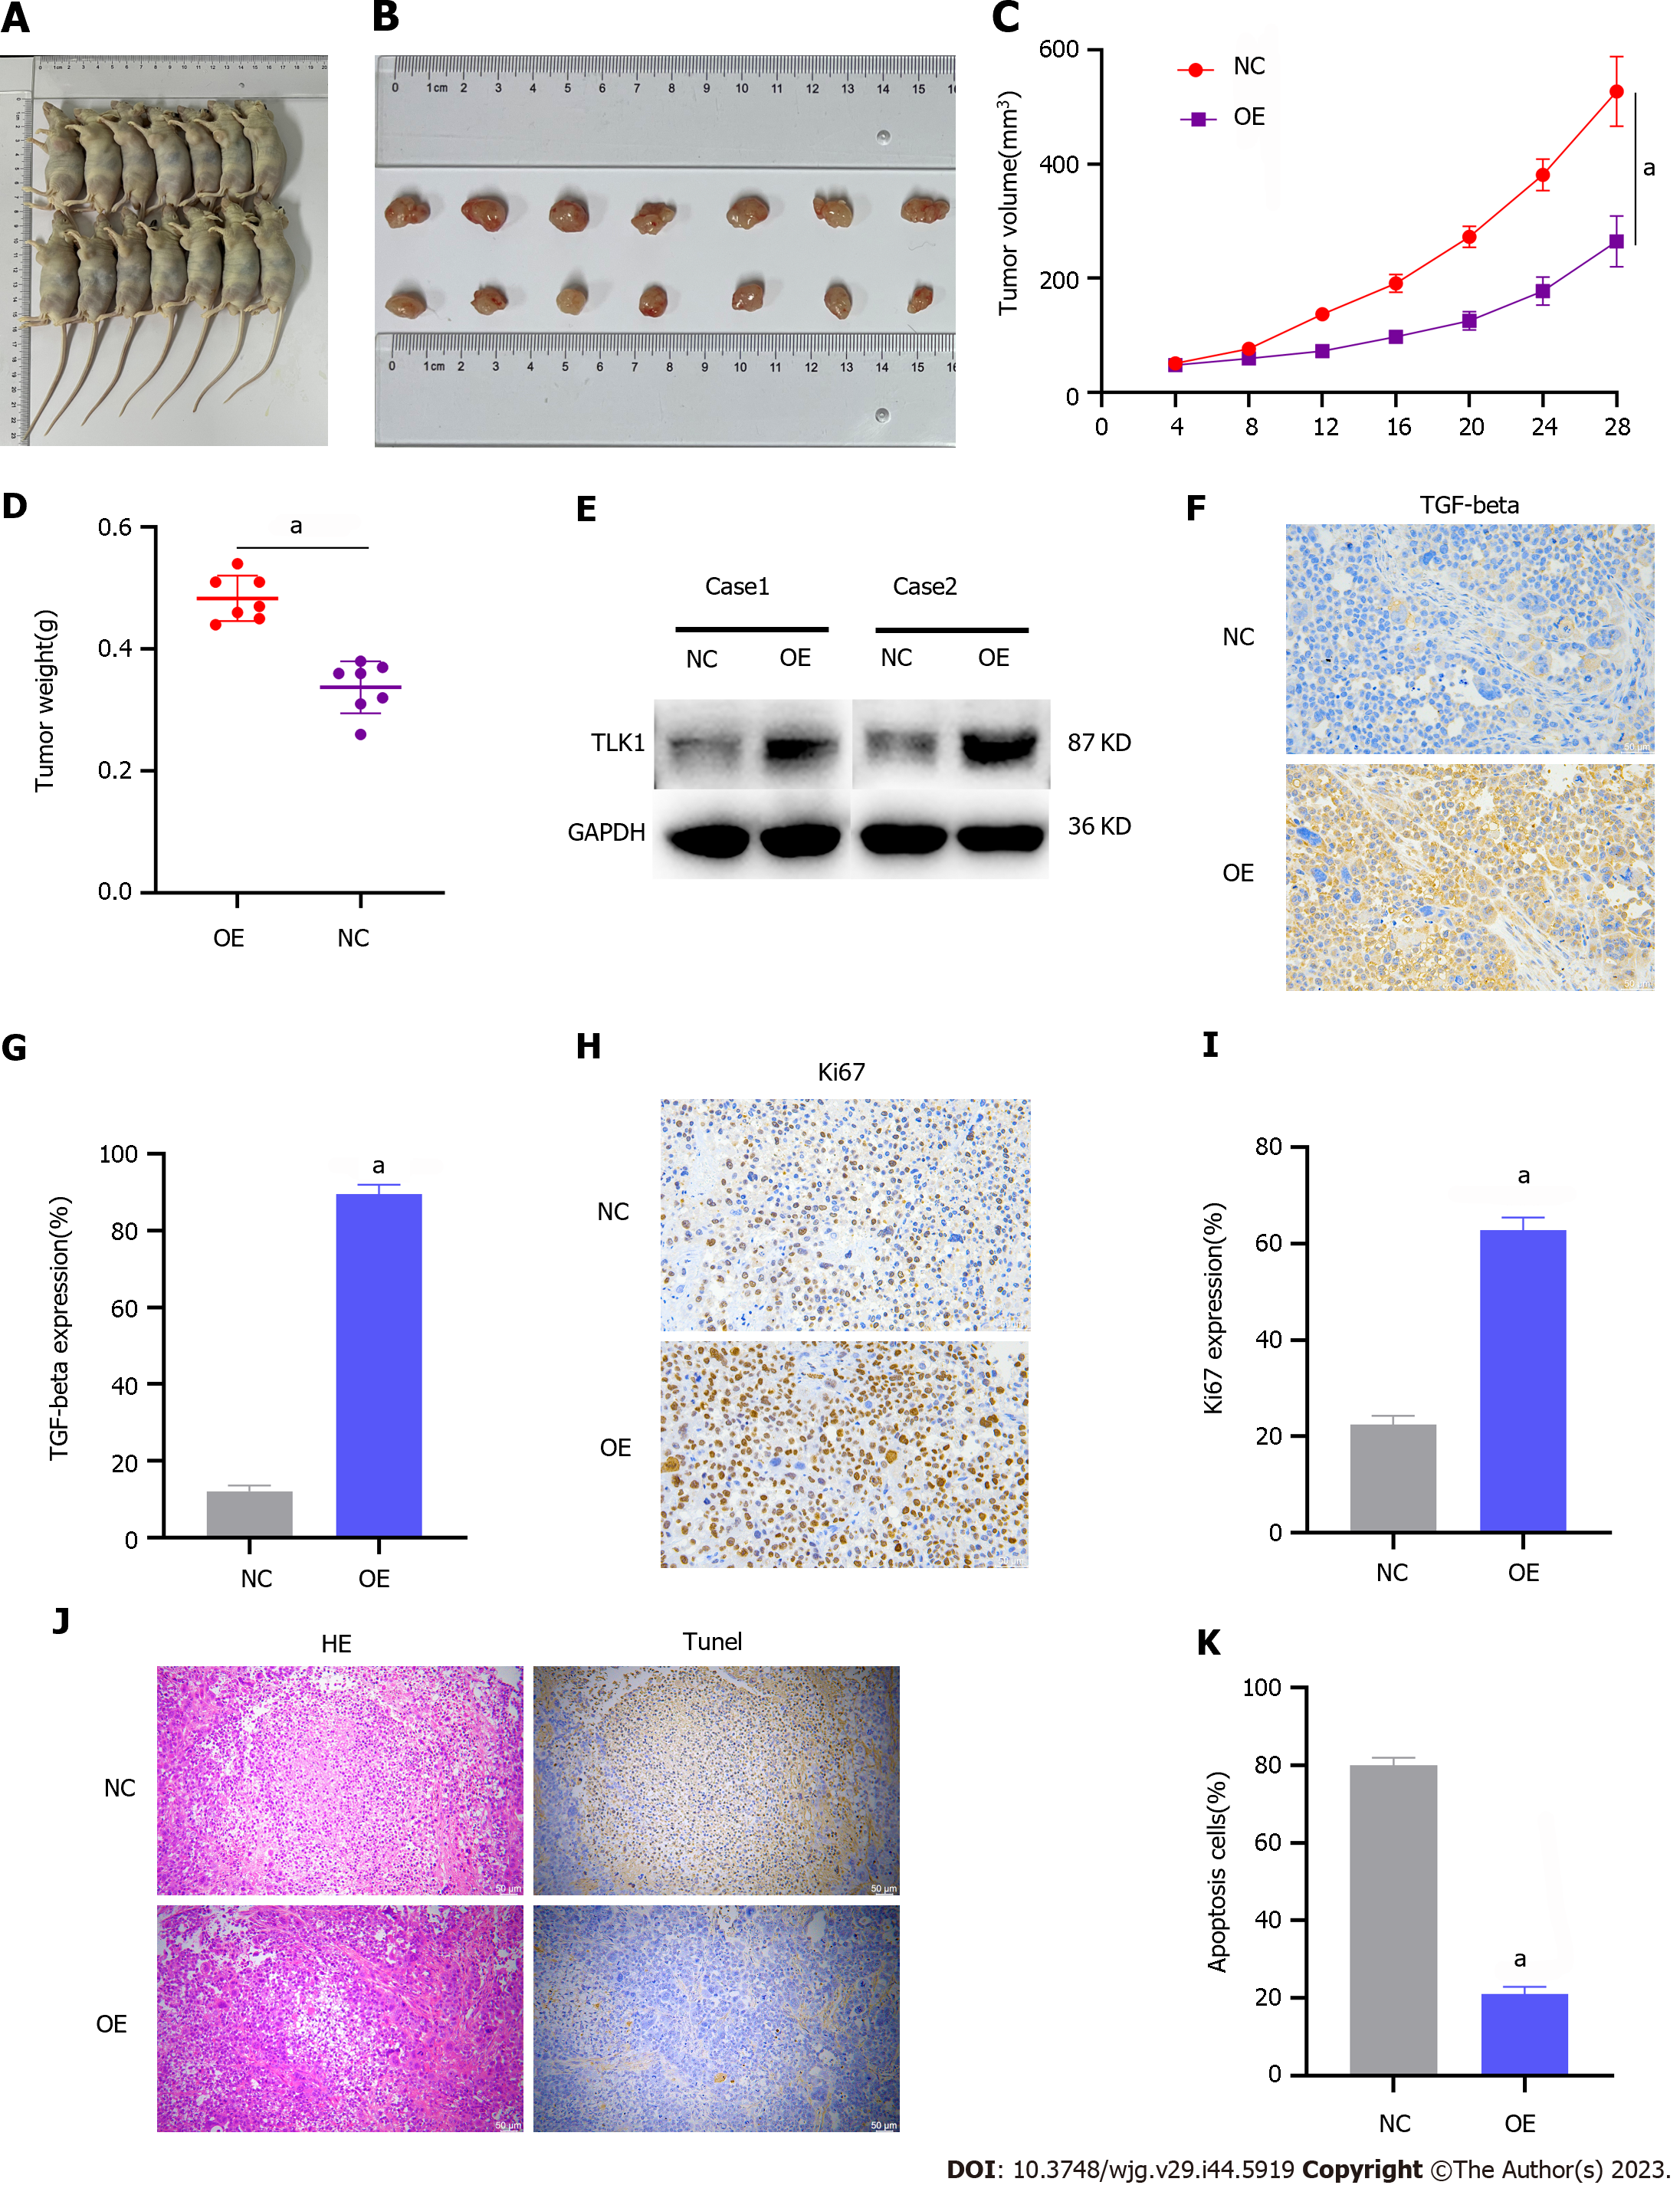
Figure 6 In vivo confirmation of the role of Tousled-like kinase 1 in gastric cancer progression.
A and B: Relative tumorigenesis between the control and Tousled-like kinase 1 (TLK1) overexpression groups; C and D: Differences in tumor volume and mass between the control and TLK1 overexpression groups; E: Western blot verifying differential TLK1 expression in tumor tissues; F and G: Immunohistochemical (IHC) staining detecting the differences in tumor growth factor-beta expression between the control and TLK1 overexpression groups; H and I: IHC staining showing the differences in Ki-67 expression between the control and TLK1 overexpression groups; J and K: IHC and HE staining disclosing the differences in apoptosis between the control and TLK1 overexpression groups. aP < 0.05. TGF-beta: Tumor growth factor-beta; NC: Negative control; OE: Overexpression.
- Citation: Sun RC, Li J, Li YX, Wang HZ, Dal E, Wang ML, Li YX. Tousled-like kinase 1 promotes gastric cancer progression by regulating the tumor growth factor-beta signaling pathway. World J Gastroenterol 2023; 29(44): 5919-5934
- URL: https://www.wjgnet.com/1007-9327/full/v29/i44/5919.htm
- DOI: https://dx.doi.org/10.3748/wjg.v29.i44.5919


