Copyright
©The Author(s) 2023.
World J Gastroenterol. Nov 14, 2023; 29(42): 5751-5767
Published online Nov 14, 2023. doi: 10.3748/wjg.v29.i42.5751
Published online Nov 14, 2023. doi: 10.3748/wjg.v29.i42.5751
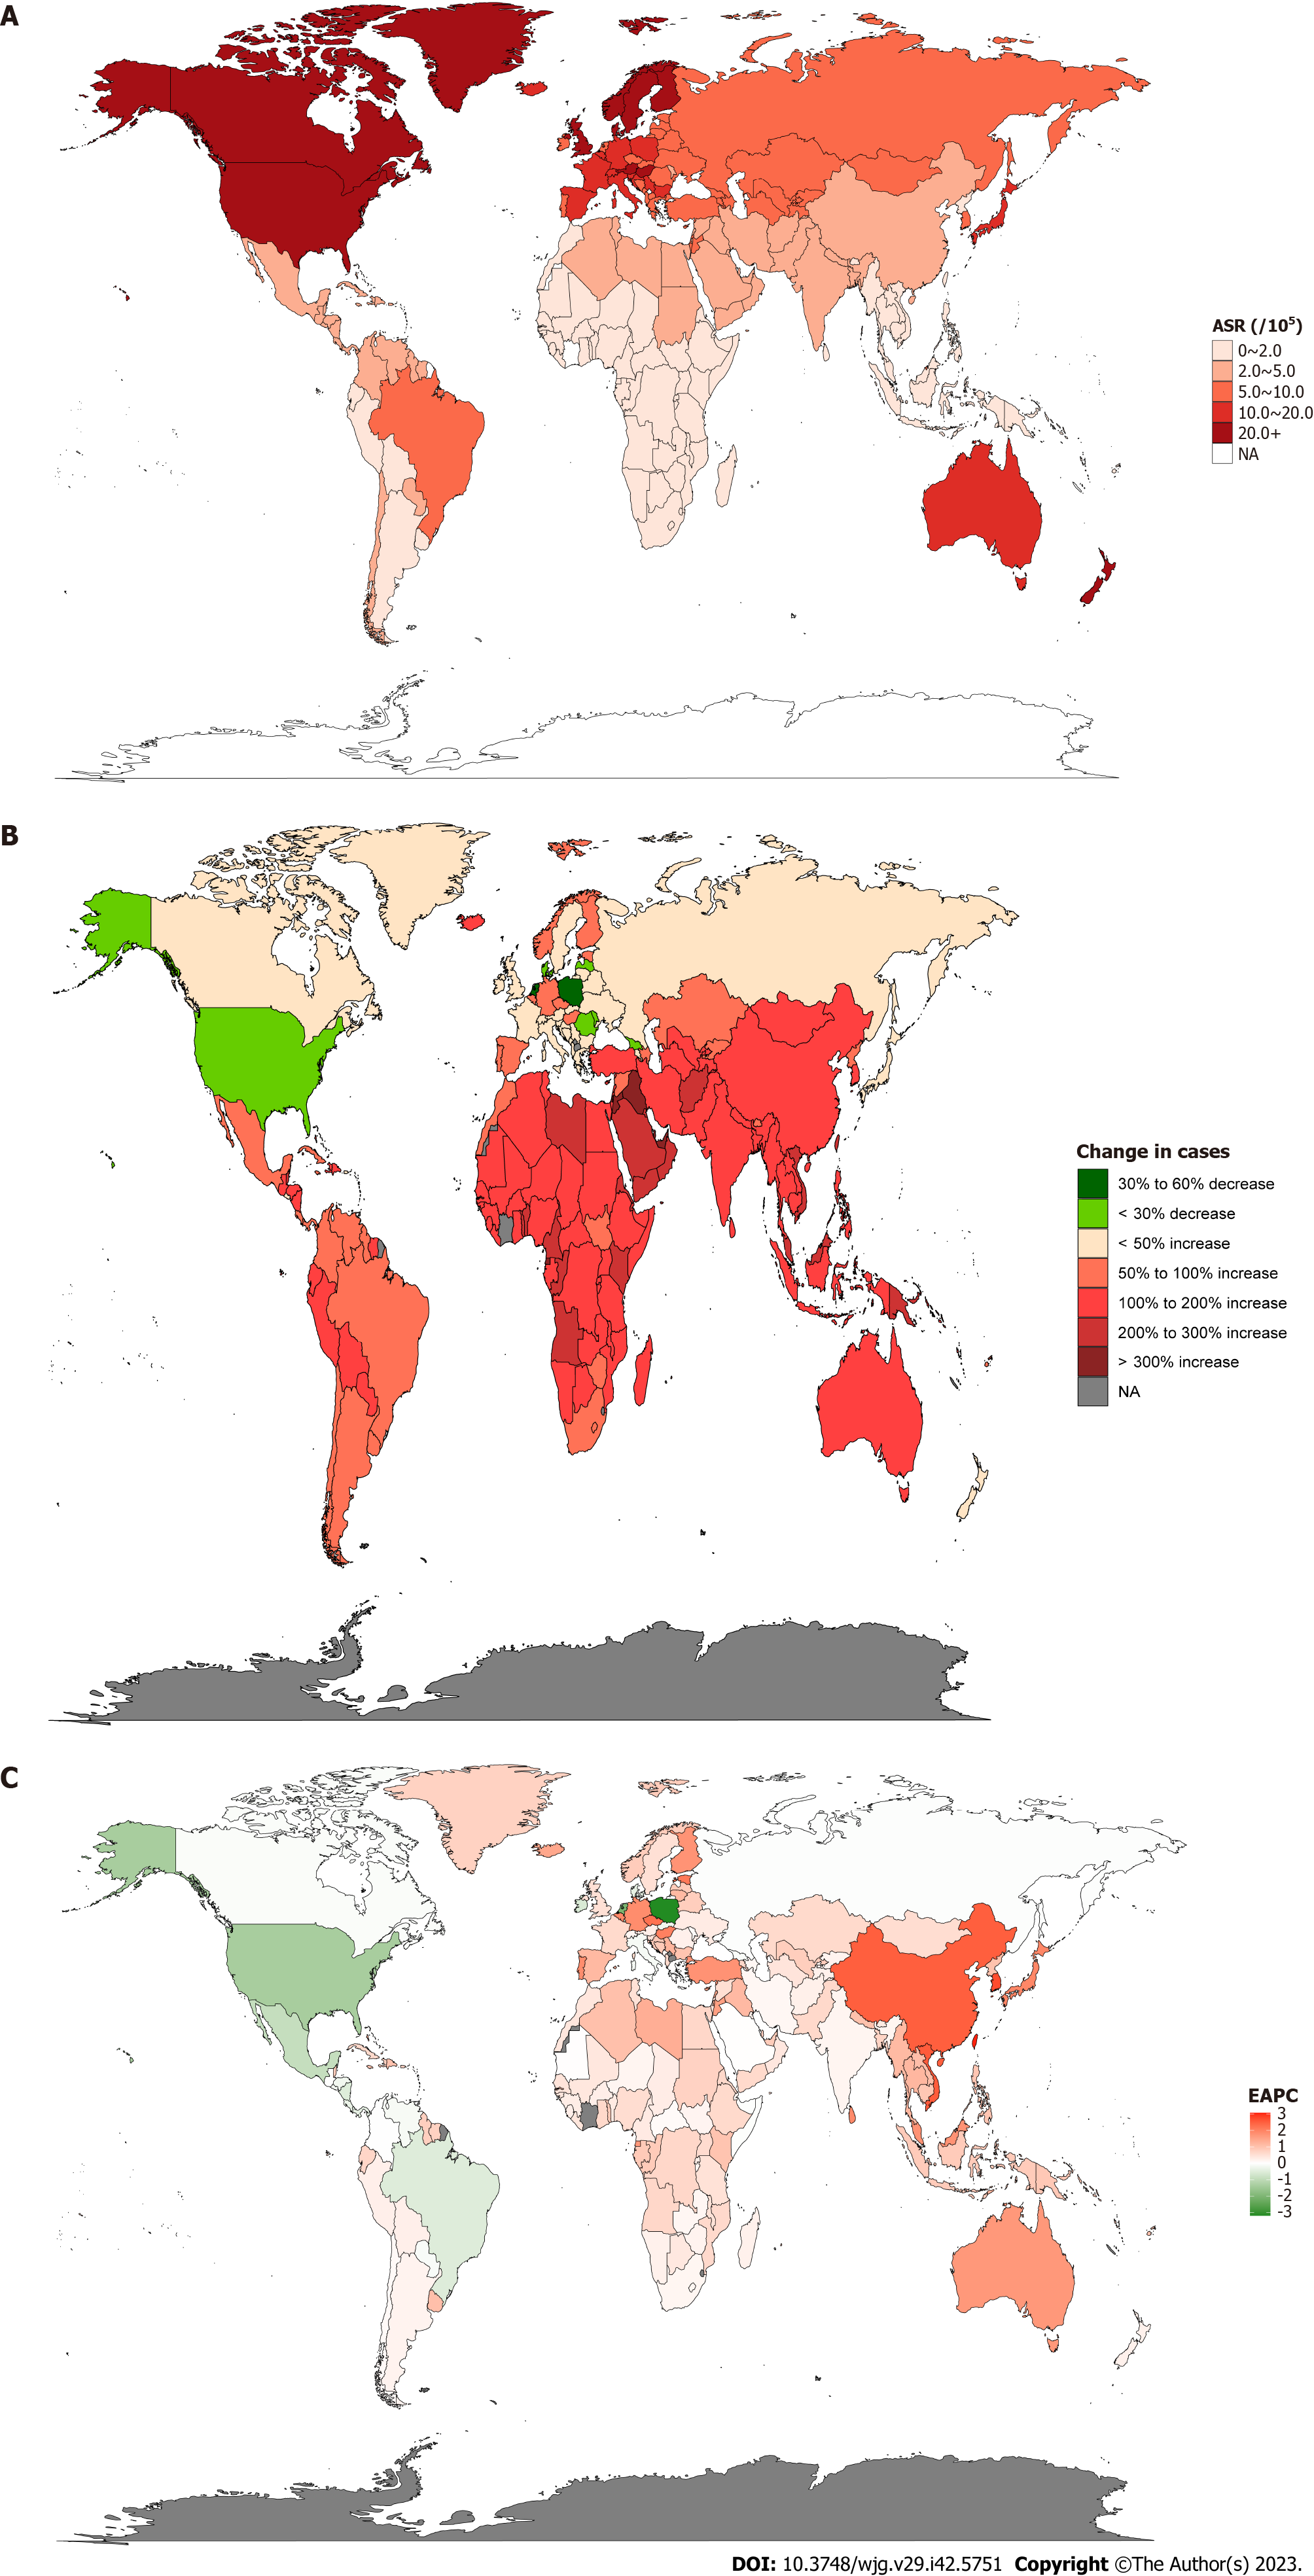
Figure 1 Inflammatory bowel disease burden in 204 countries and territories worldwide.
A: Inflammatory bowel disease (IBD) age standardized rate (ASR) in 2019; B: Changes in the incidence of IBD from 1990-2019; C: Estimated annual percent change analysis of IBD ASR from 1990-2019. IBD: Inflammatory bowel disease; ASR: Age-standardized rate; EAPC: Estimated annual percent change.
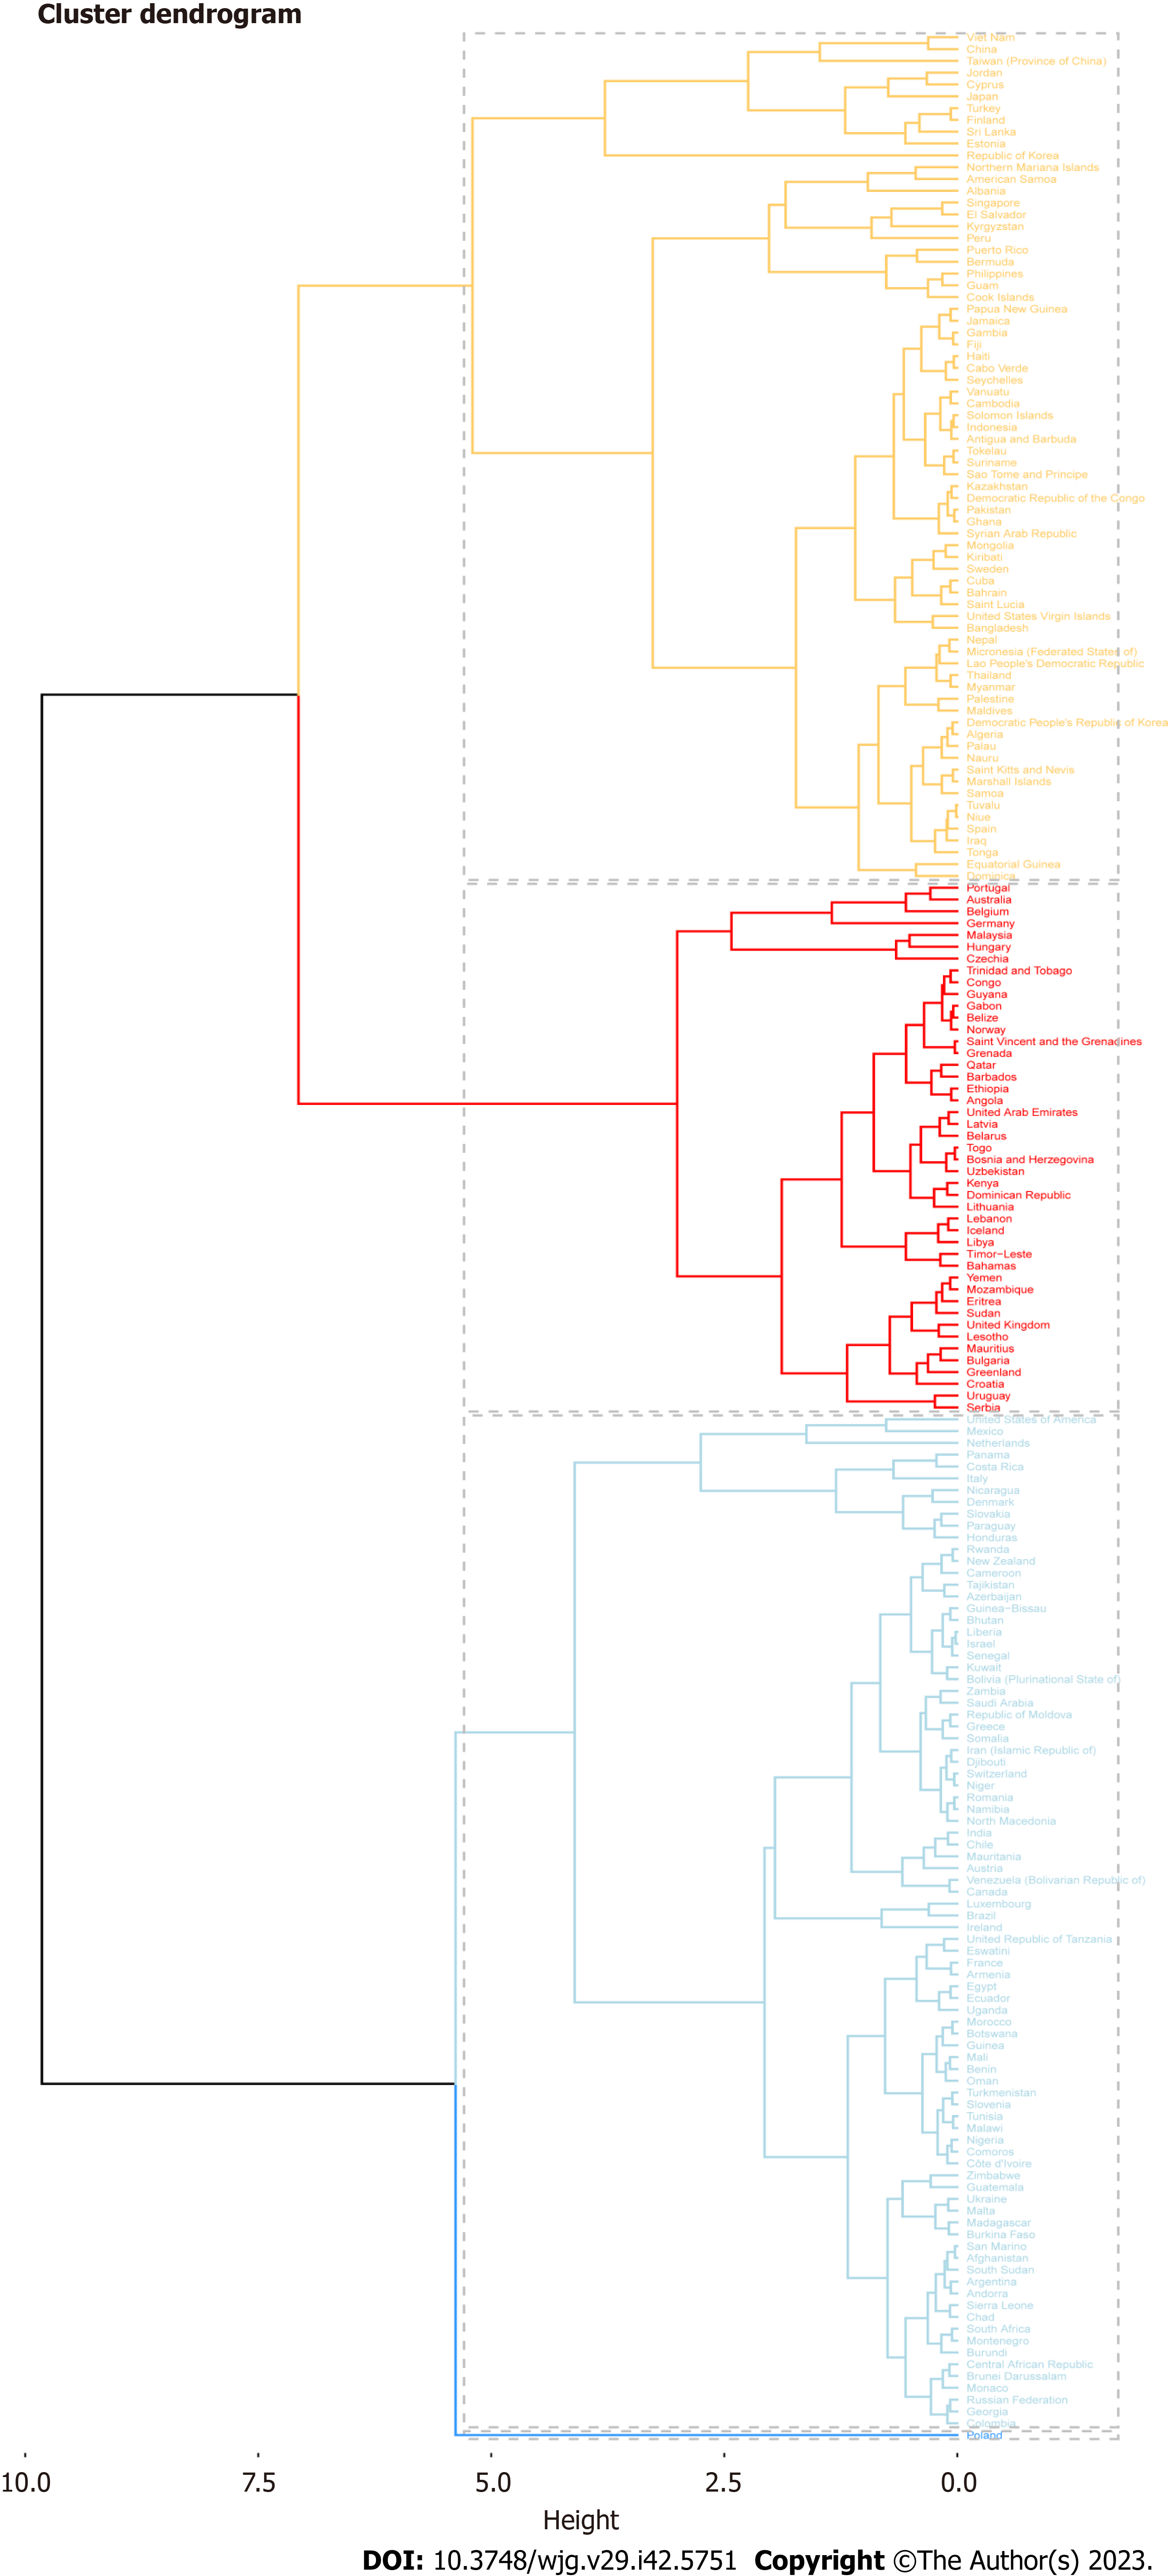
Figure 2 Cluster analysis: Estimated annual percent change data combining incidence and deaths.
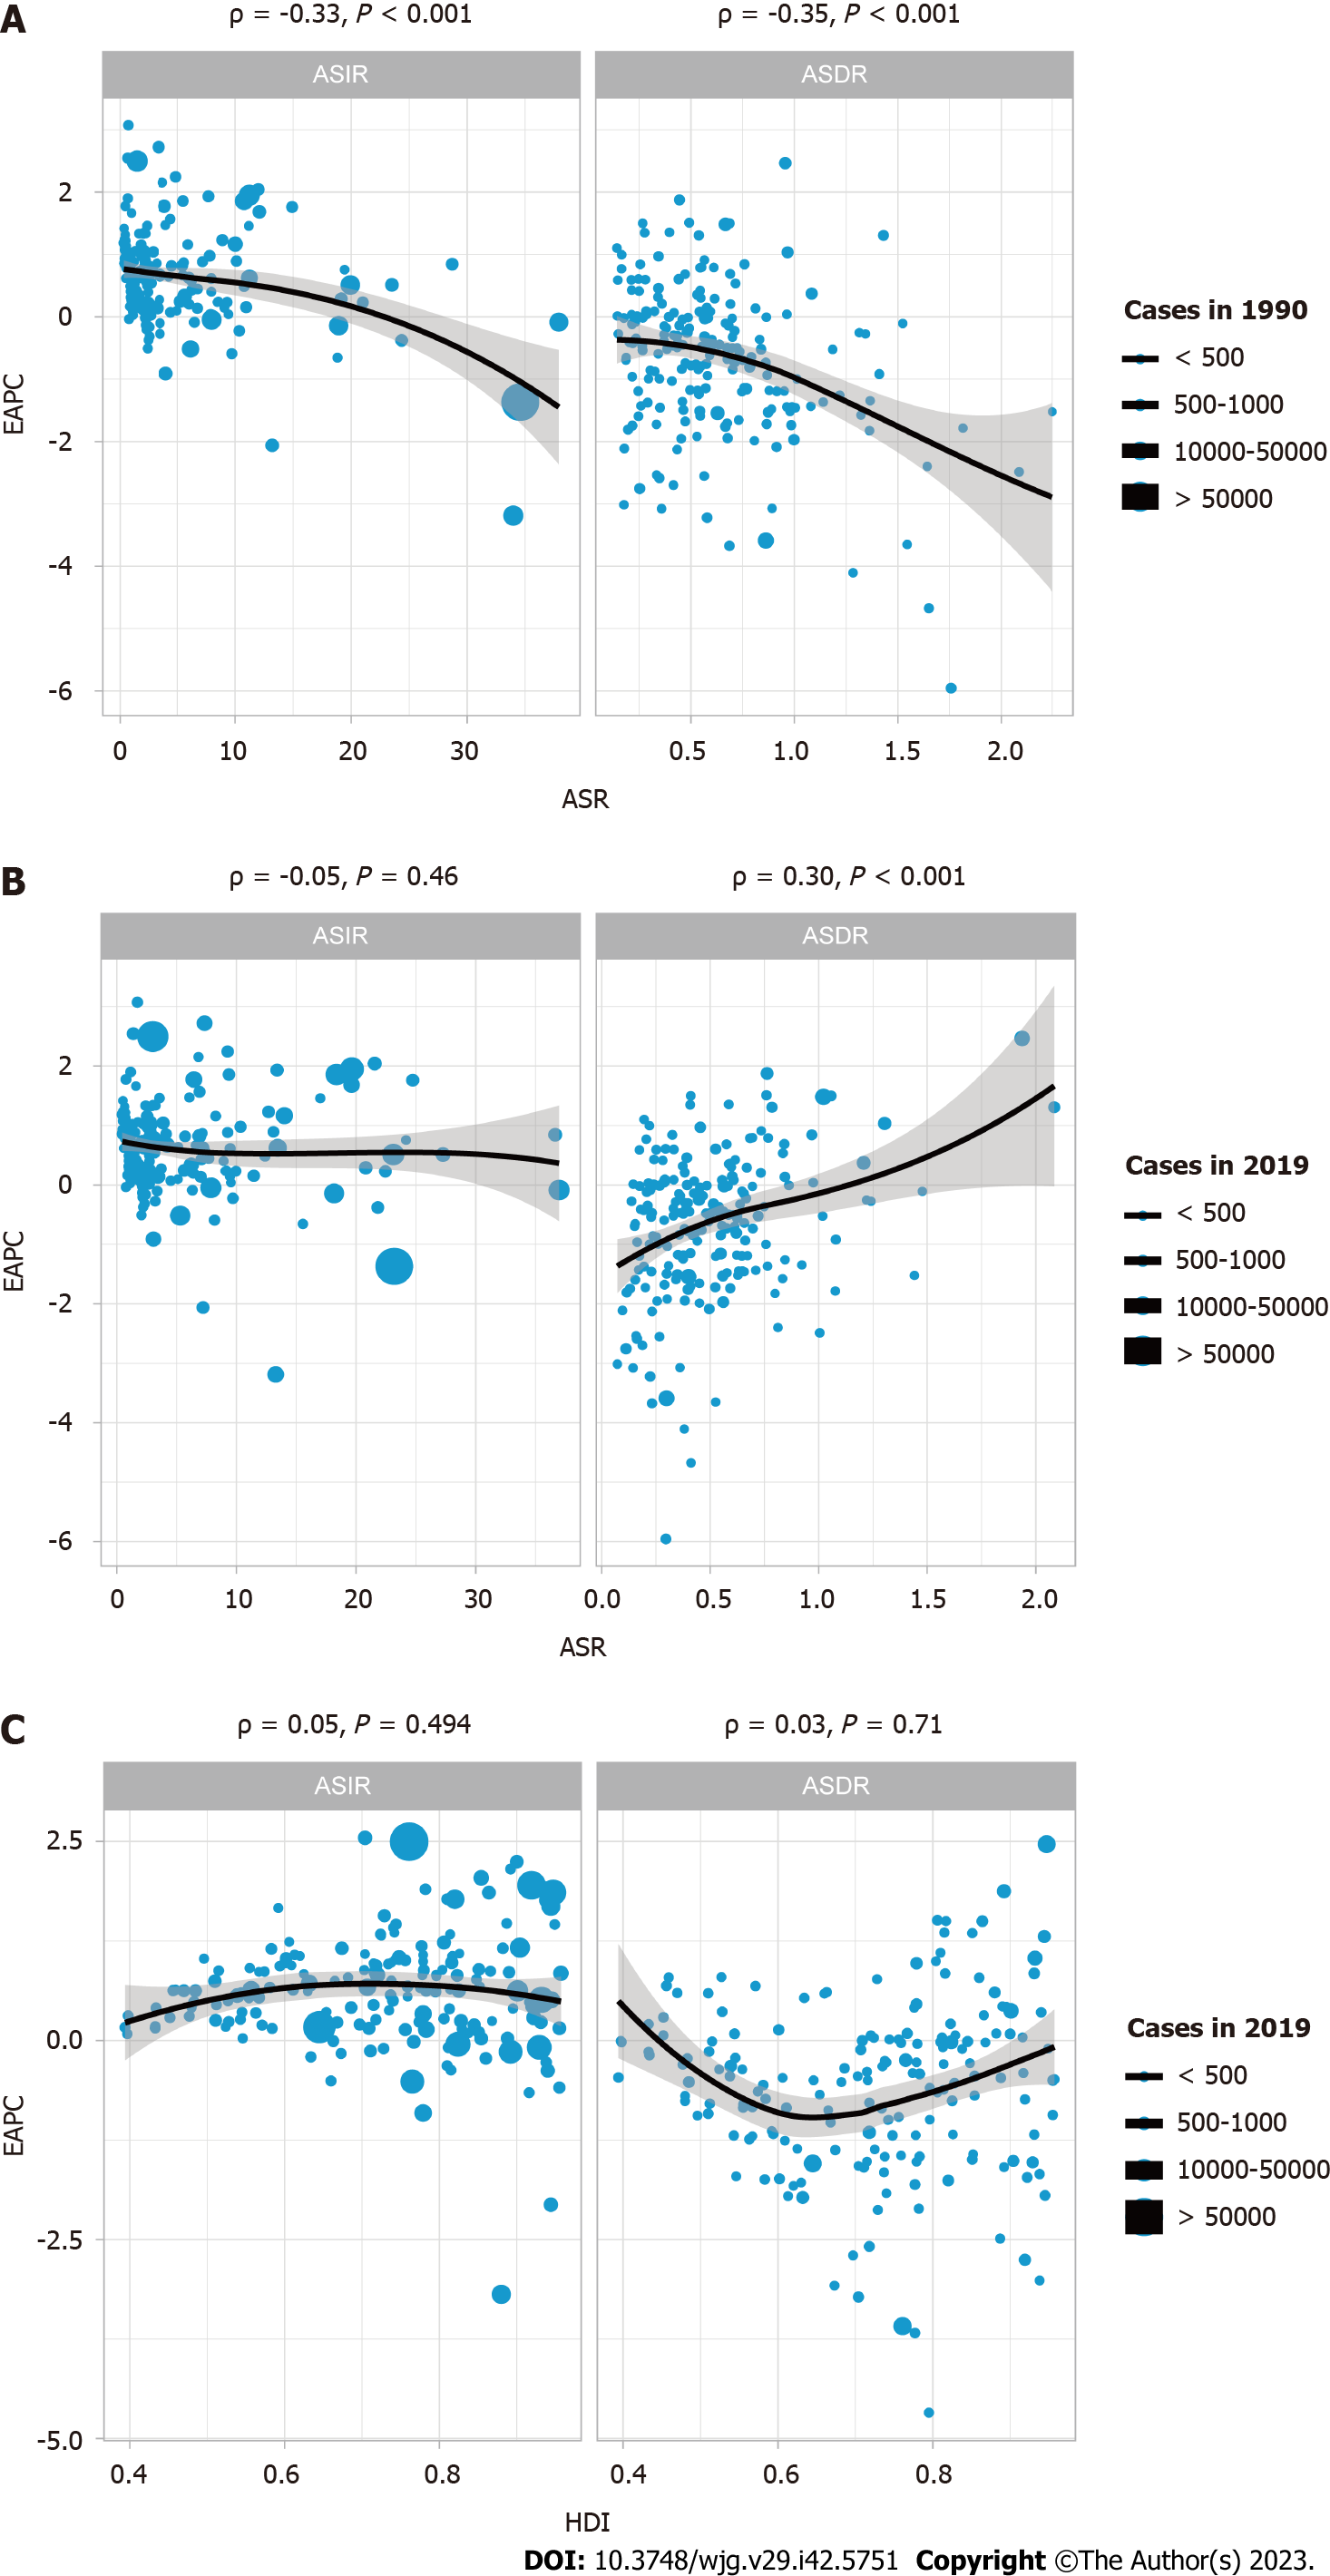
Figure 3 Correlation of estimated annual percent change with inflammatory bowel disease age standardized rate and human development index.
A: Correlation of estimated annual percent change (EAPC) with inflammatory bowel disease (IBD) age-standardized incidence rates (ASIR) and age-standardized death rates (ASDR) in 1990; B: Correlation of EAPC with IBD ASIR and ASDR in 2019; C: Correlation of EAPC with human development index in 2019. The circles in the figure represent countries, and the size of the circles represents the number of IBD cases. ρ and P values were obtained using the Pearson correlation coefficient analysis. EAPC: Estimated annual percent change; ASR: Age standardized rate; HDI: Human development index.
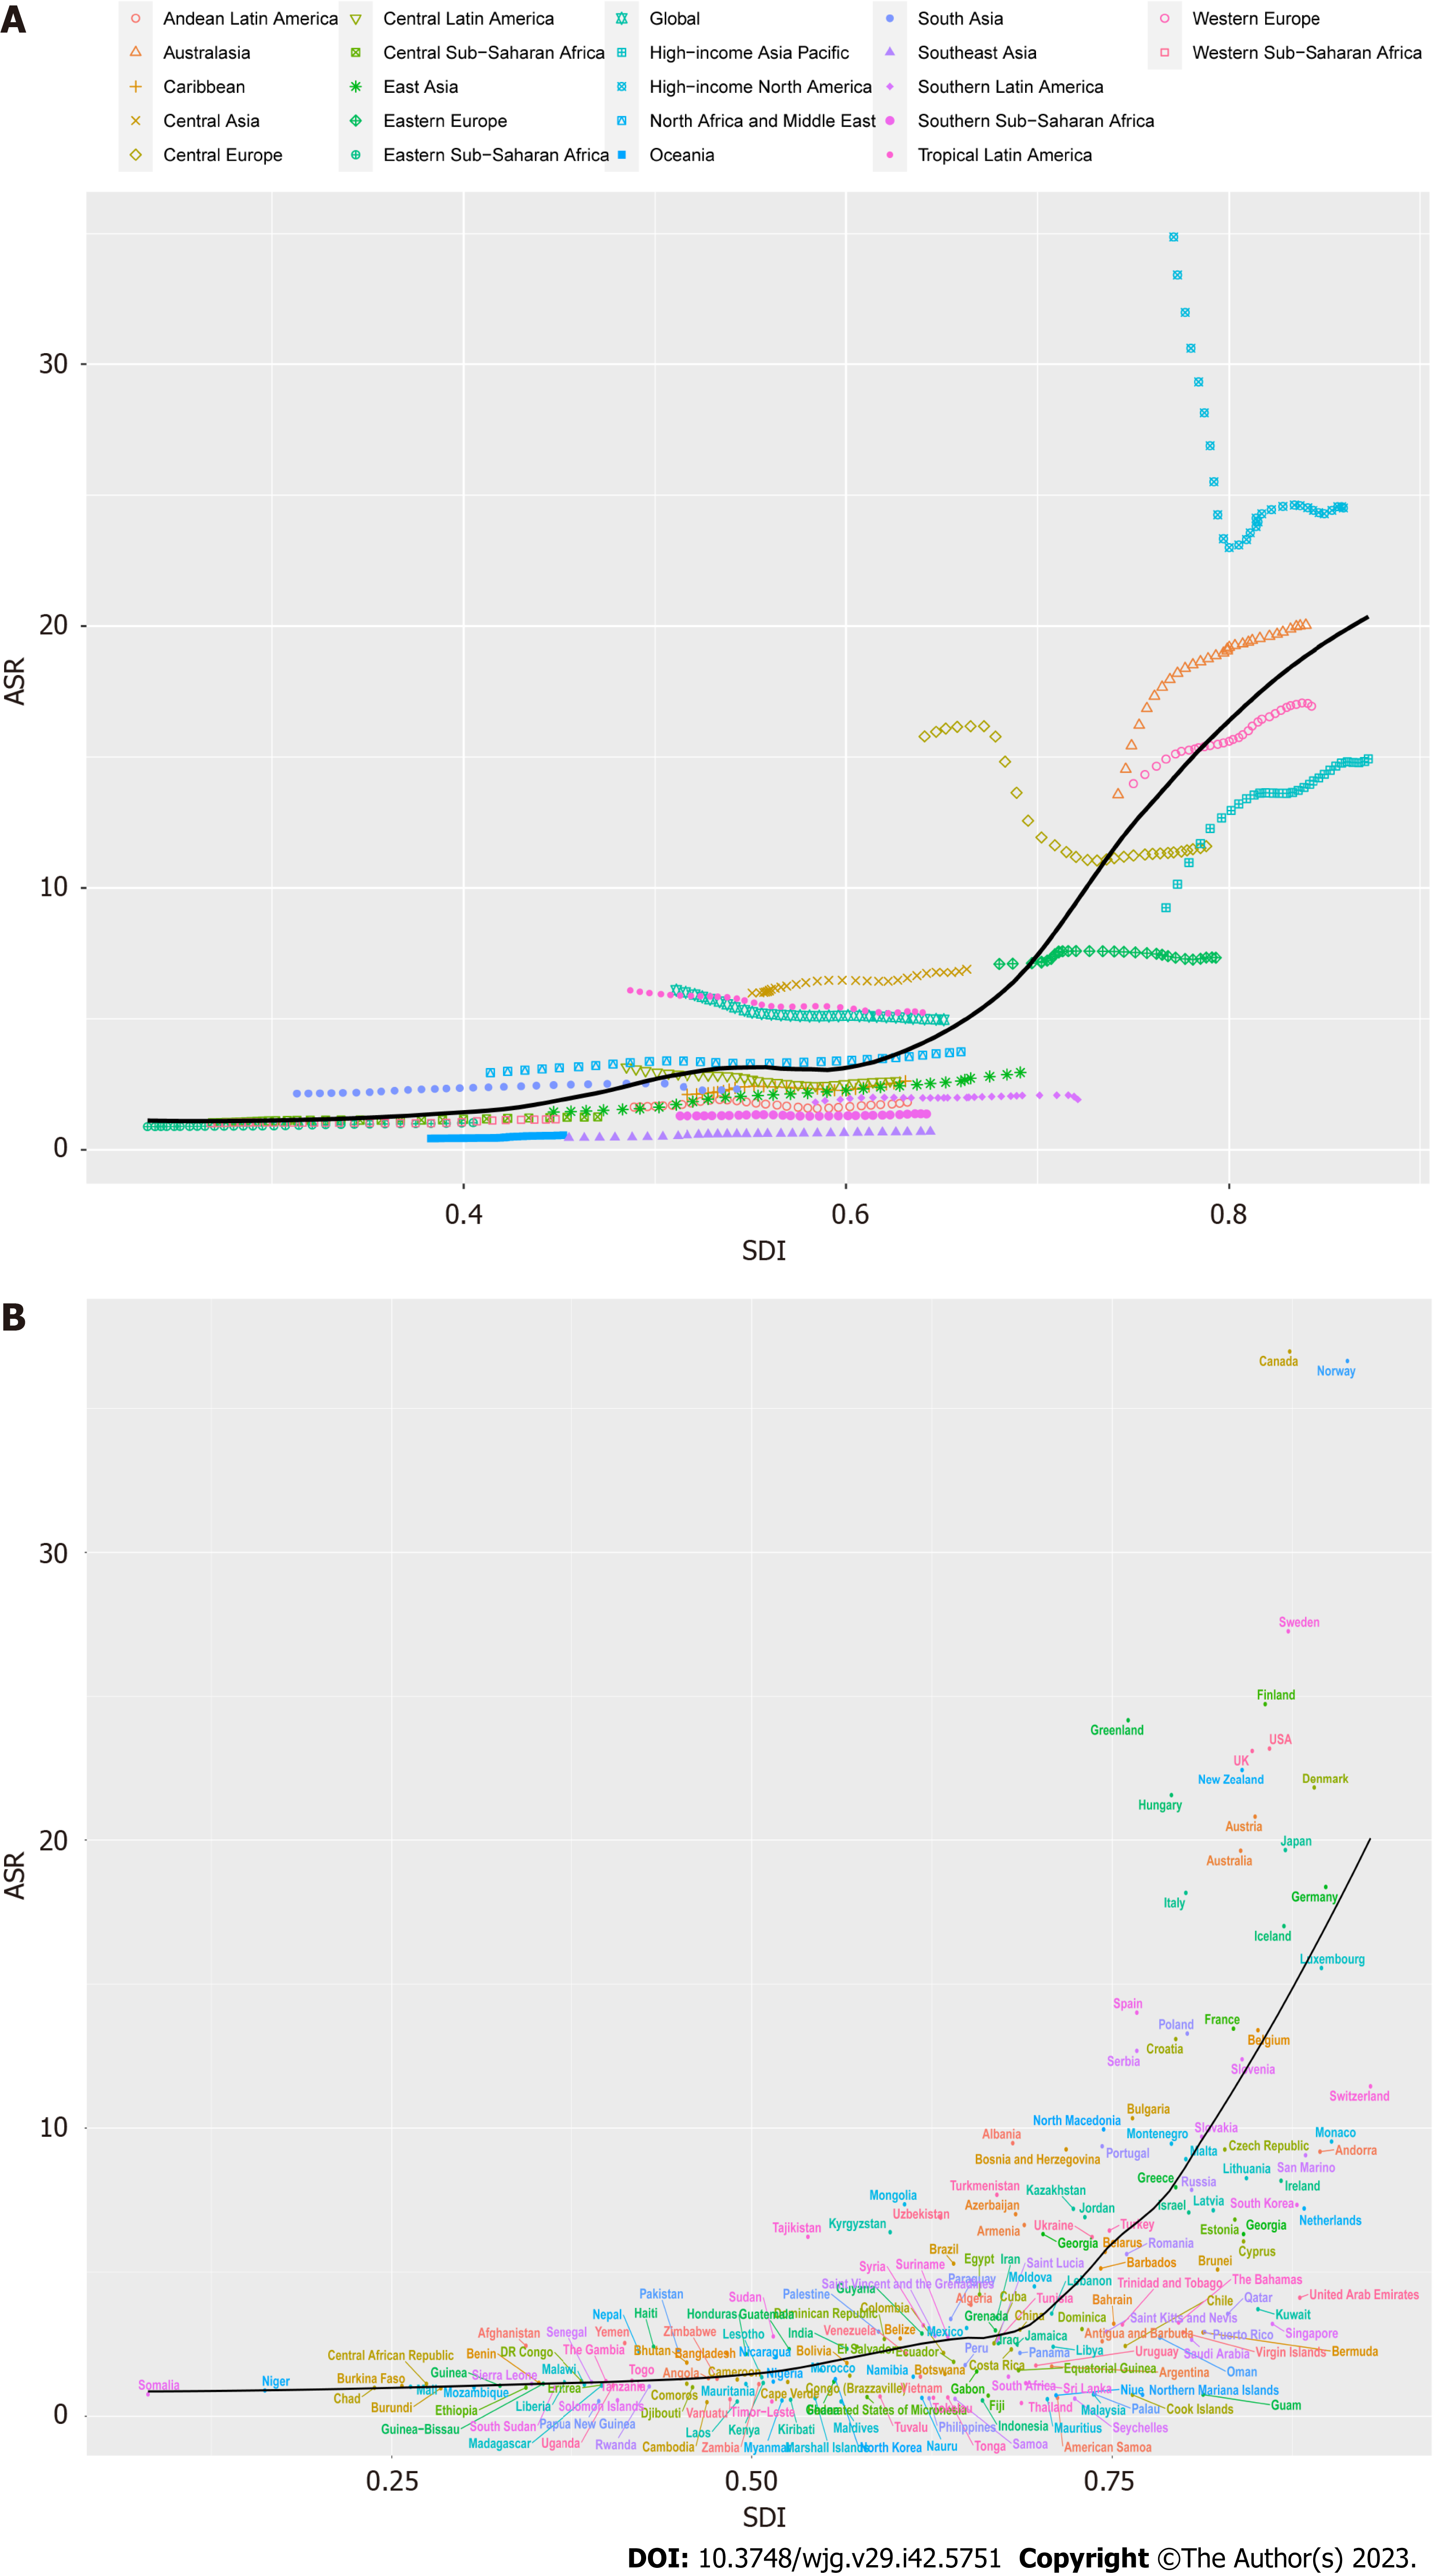
Figure 4 Trends in inflammatory bowel disease age standardized rate by sociodemographic index from 1990-2019.
A: Twenty-one Global Burden of Diseases regions are shown; B: 204 countries and territories are shown. The expected values for sociodemographic indices and disease incidence based on all sites are shown as black lines. ASR: Age standardized rate; SDI: Socio-demographic index.
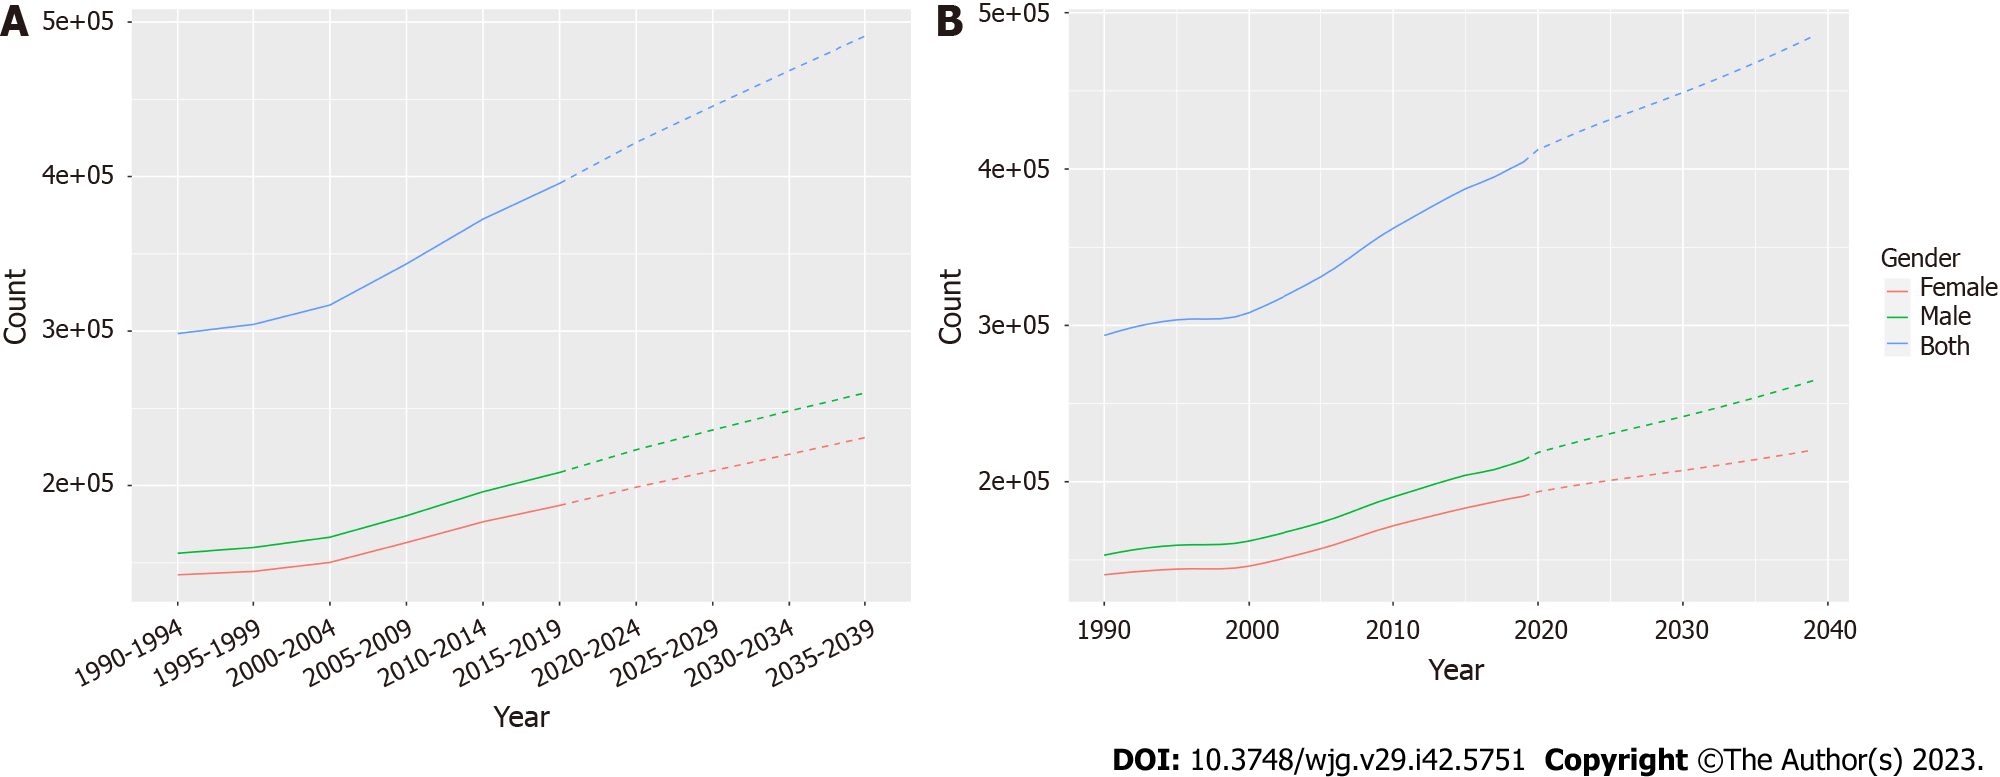
Figure 5 Statistics and predictions of the number of cases in all age groups.
A: Prediction based on Nordpred model; B: Prediction based on Bayesian age-period-cohort model.
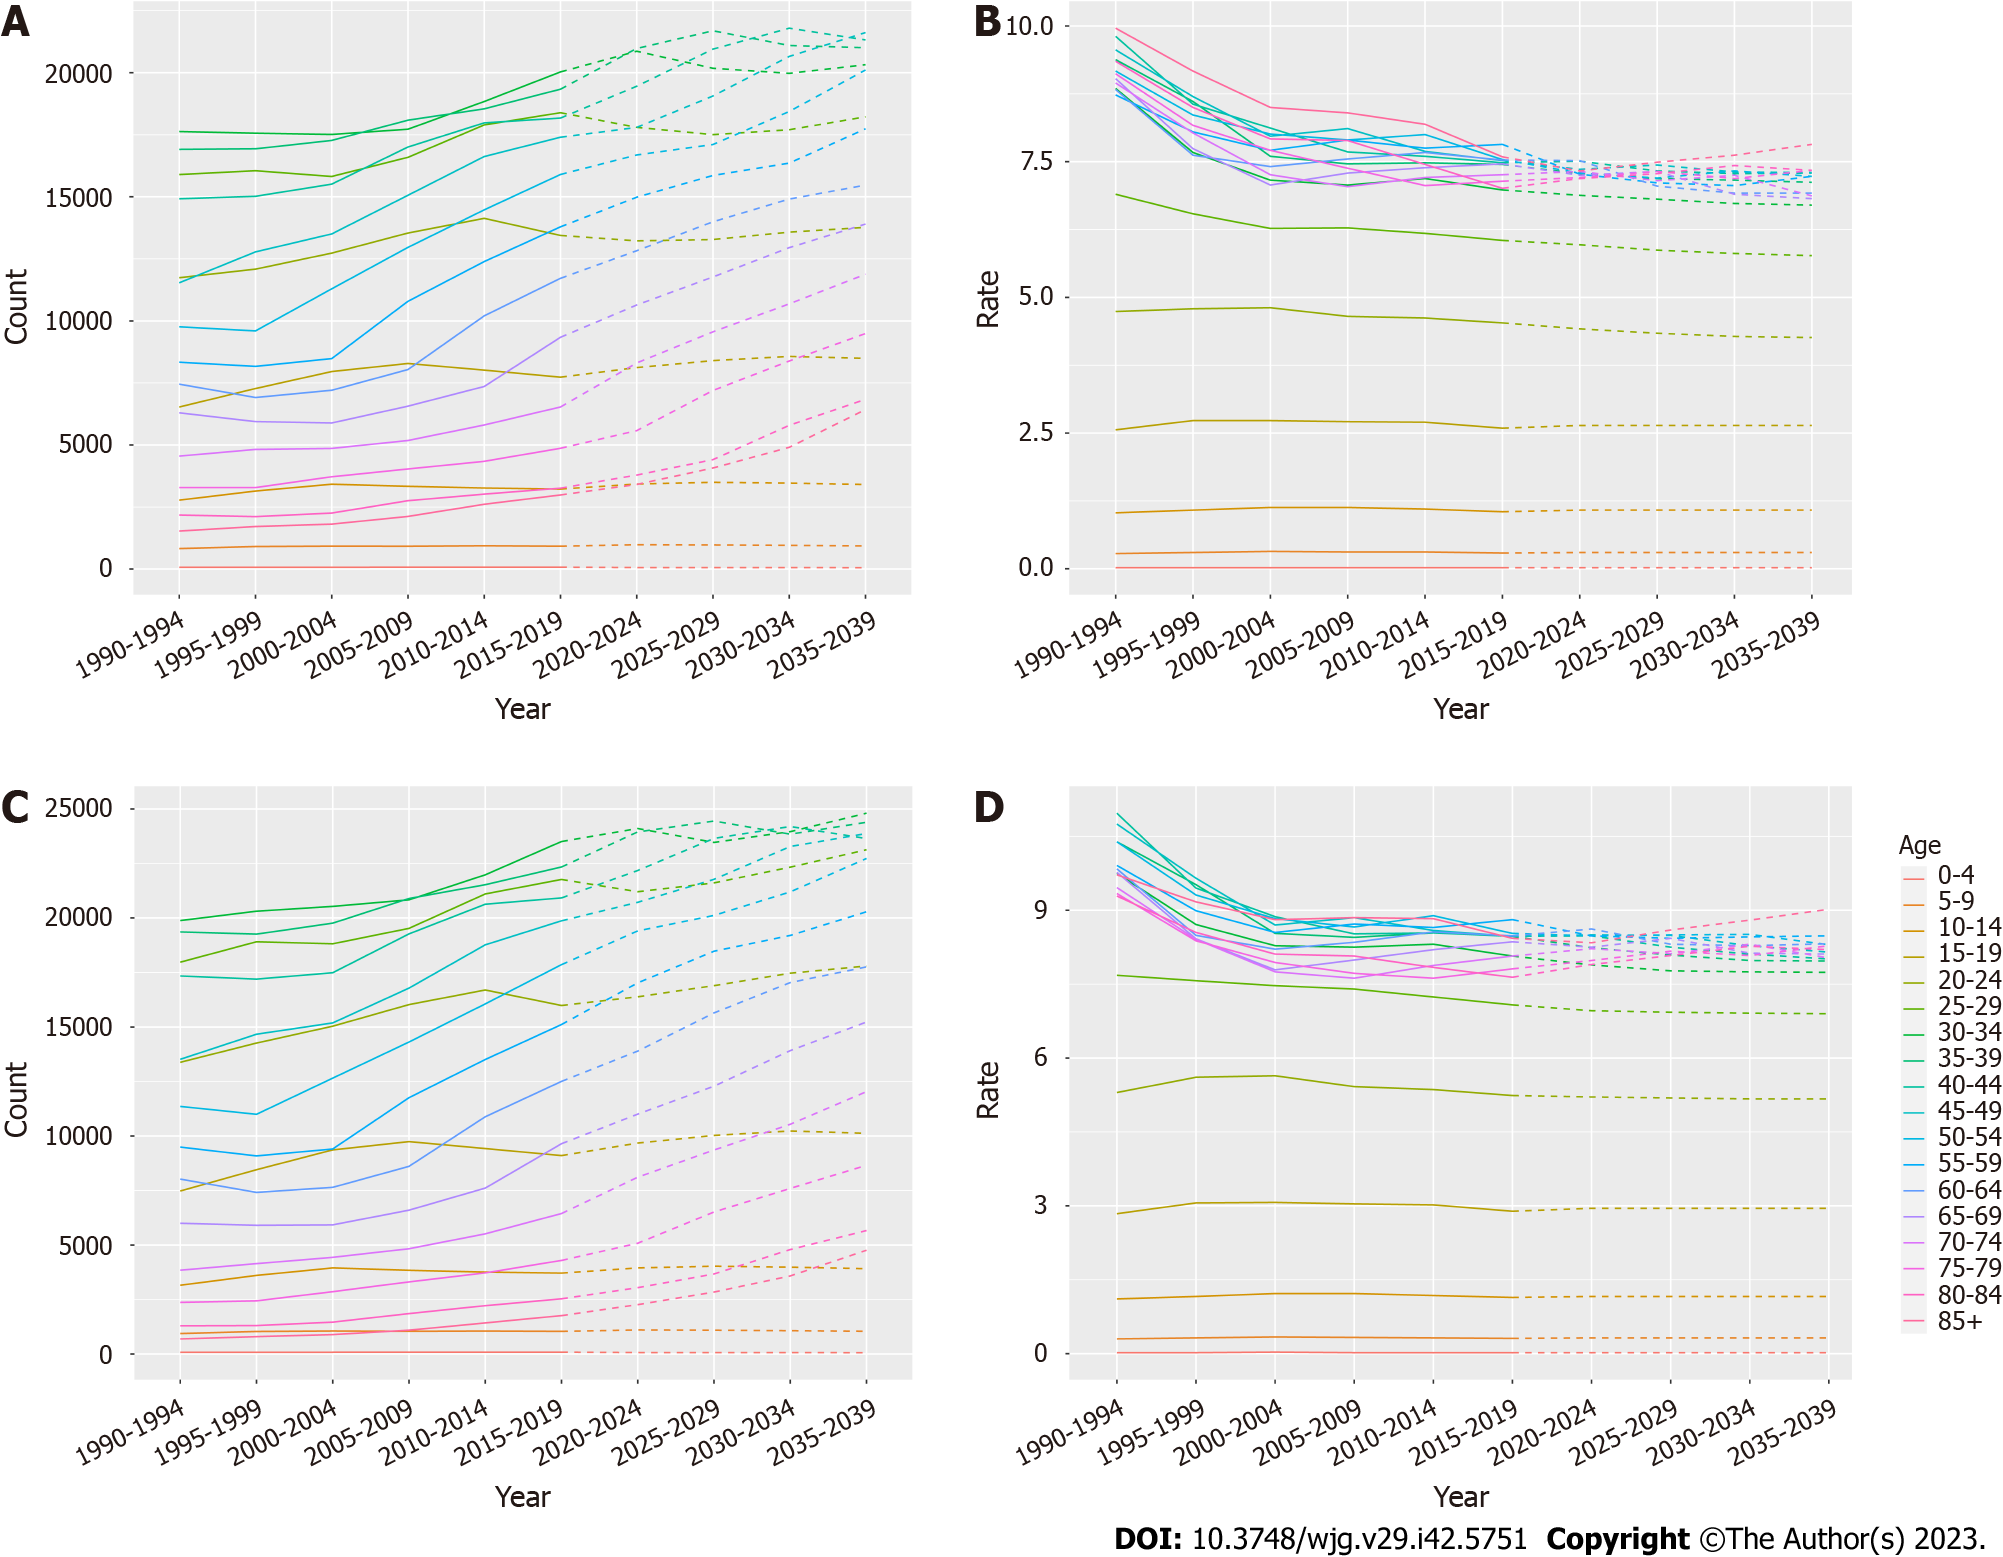
Figure 6 Inflammatory bowel disease incidence from 1990-2019 and projections for the next 20 years, stratified by gender.
A: Statistics and projections of the number of female patients with inflammatory bowel disease (IBD) are shown; B: Statistics and predictions of the female incidence of IBD are shown; C: Statistics and projections of the number of male patients with IBD are shown; D: Statistics and predictions of the male incidence of IBD are shown. Prediction of changes over the next 20 years are based on the Nordpred model.
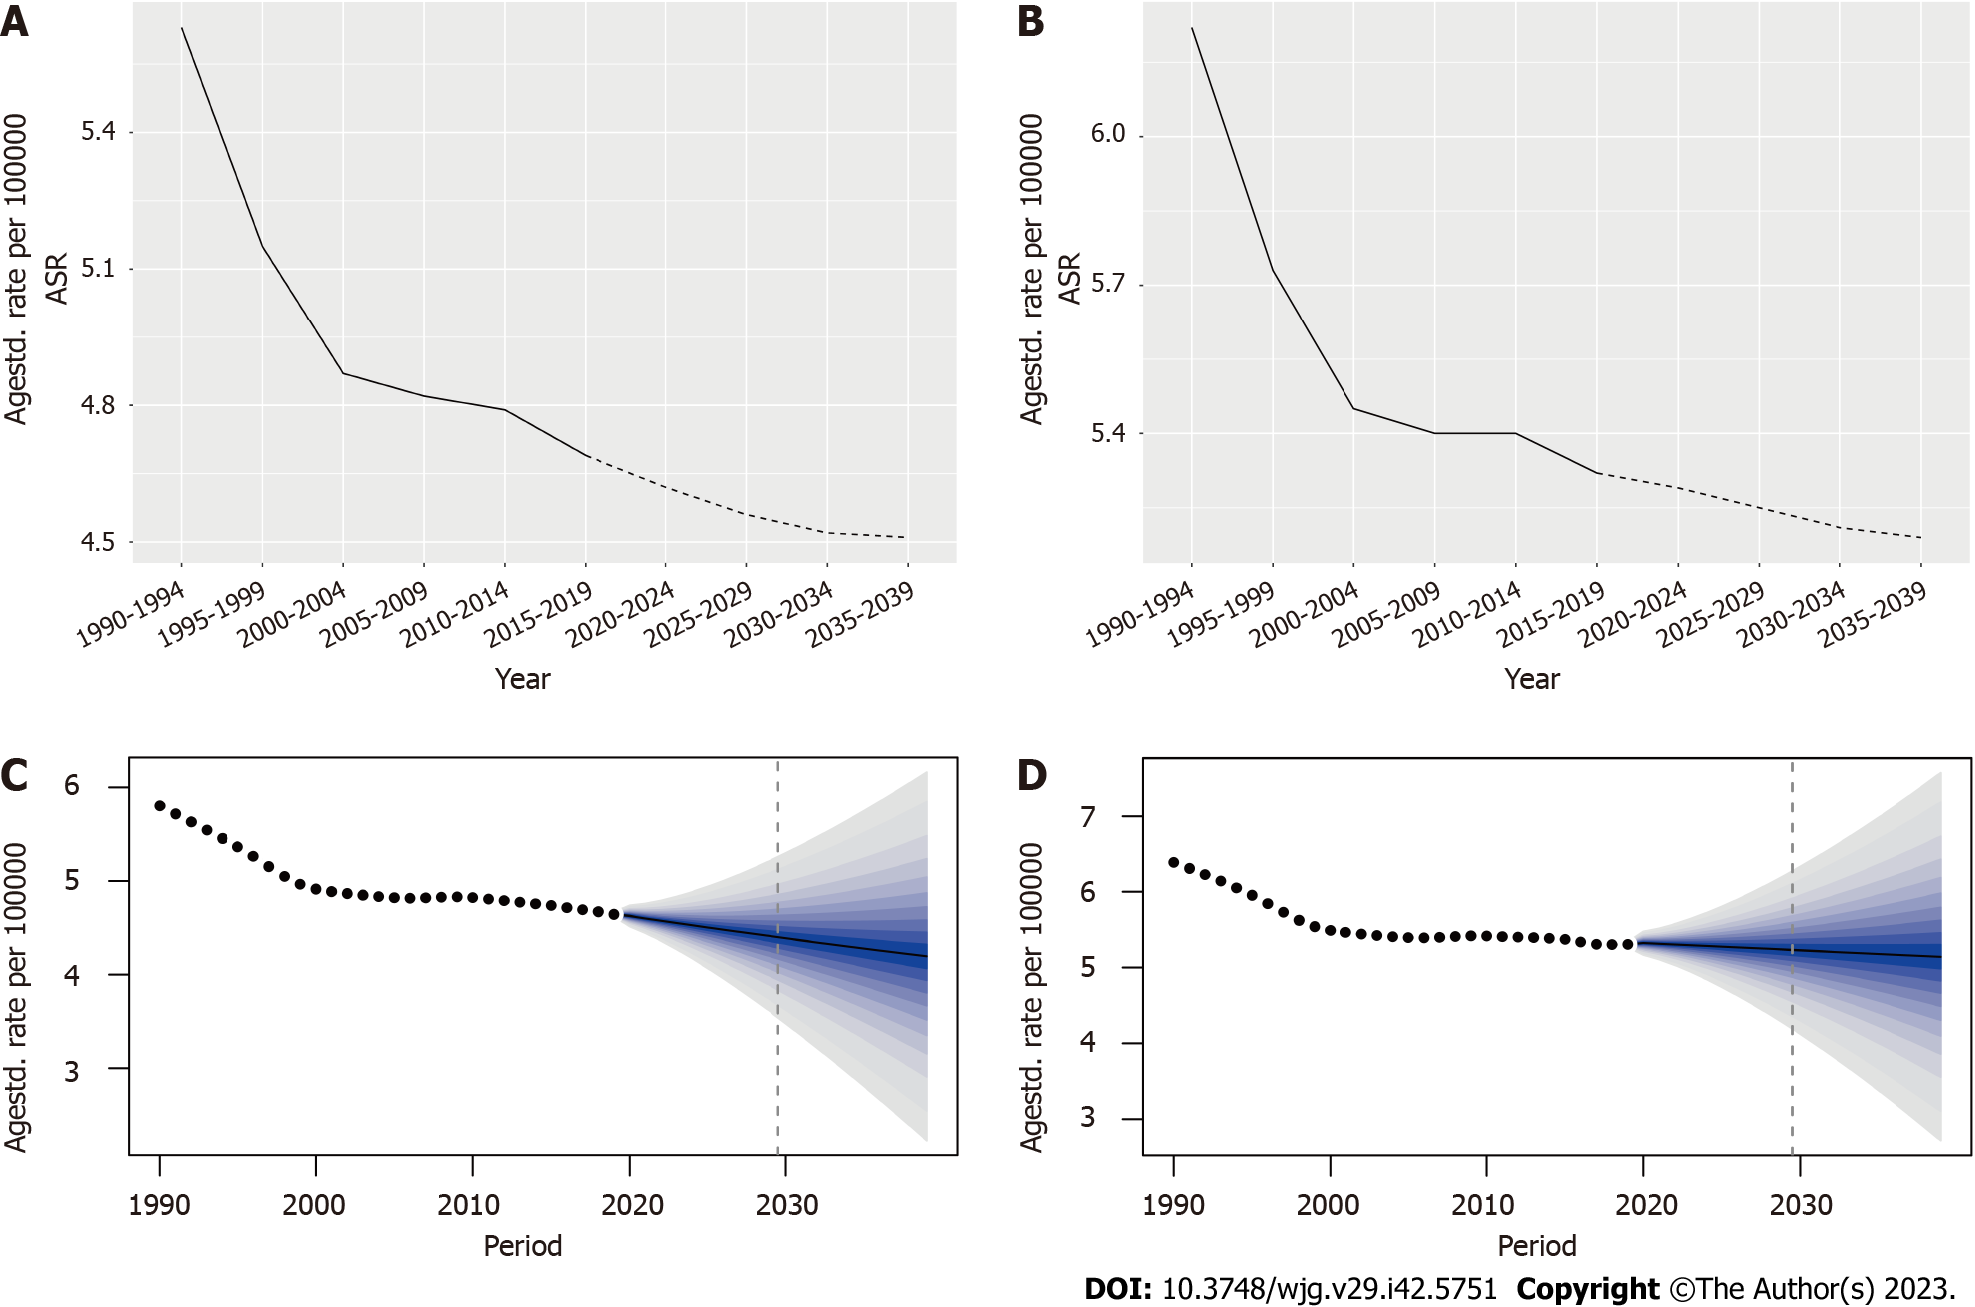
Figure 7 Statistics and predictions of inflammatory bowel disease age standardized rate for different genders.
A and B: The age standardized rate (ASR) statistics and predictions based on the Nordpred model for female and male, respectively; C and D: The ASR statistics and predictions for female and male based on the Bayesian age-period-cohort model, respectively. ASR: Age standardized rate.
- Citation: Li CJ, Wang YK, Zhang SM, Ren MD, He SX. Global burden of inflammatory bowel disease 1990-2019: A systematic examination of the disease burden and twenty-year forecast. World J Gastroenterol 2023; 29(42): 5751-5767
- URL: https://www.wjgnet.com/1007-9327/full/v29/i42/5751.htm
- DOI: https://dx.doi.org/10.3748/wjg.v29.i42.5751


