Copyright
©The Author(s) 2023.
World J Gastroenterol. Oct 28, 2023; 29(40): 5543-5556
Published online Oct 28, 2023. doi: 10.3748/wjg.v29.i40.5543
Published online Oct 28, 2023. doi: 10.3748/wjg.v29.i40.5543
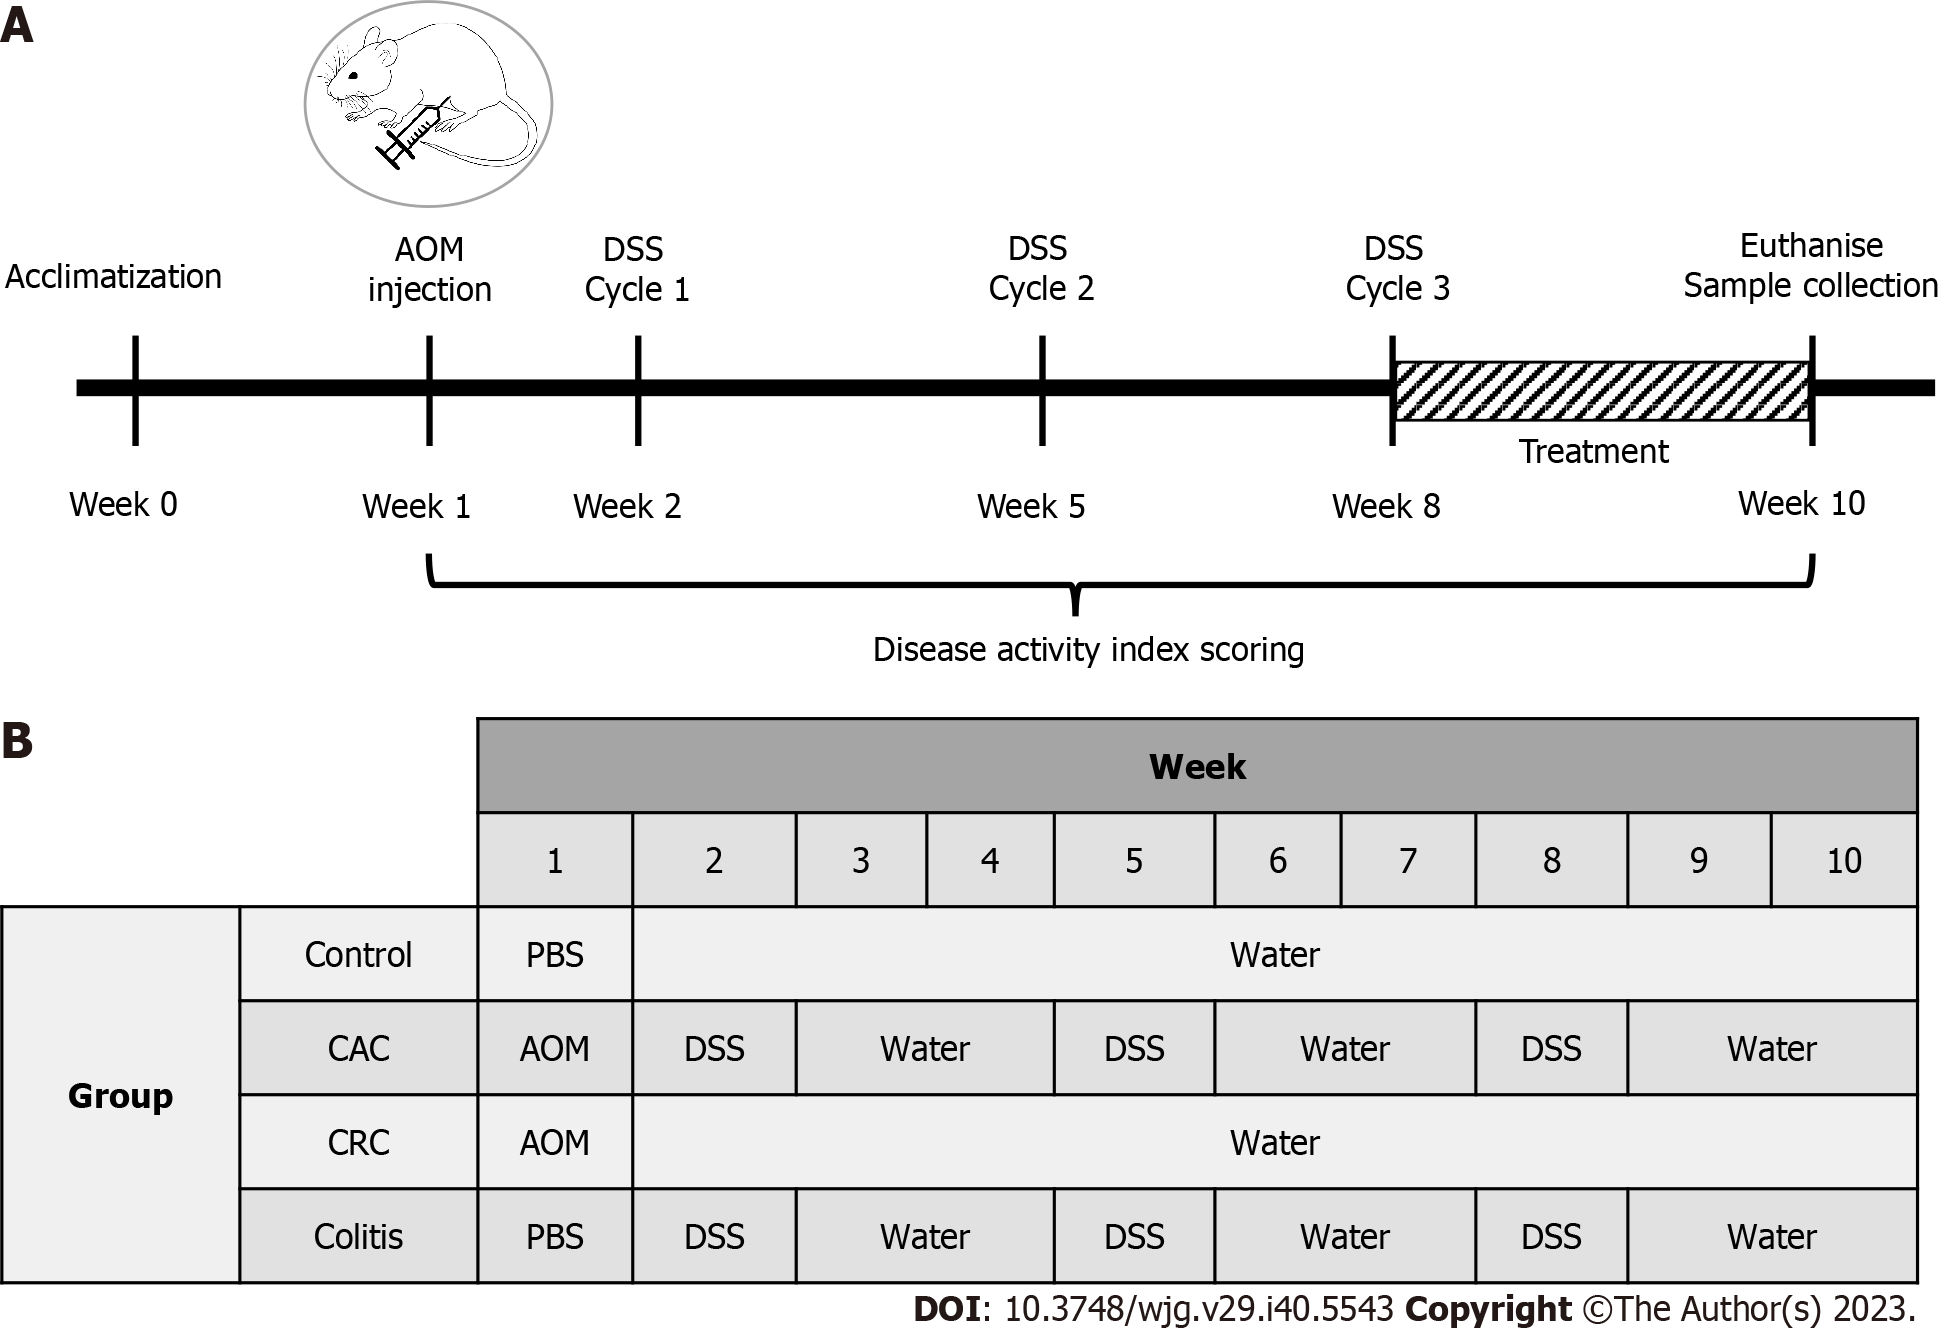
Figure 1 Animal induction procedure.
A: The experimental design for the chemical induction procedure; B: The schematic diagram of mice model grouping. DSS: Dextran sodium sulphate; AOM: Azoxymethane; CAC: Colitis-associated cancer; CRC: Colorectal cancer.
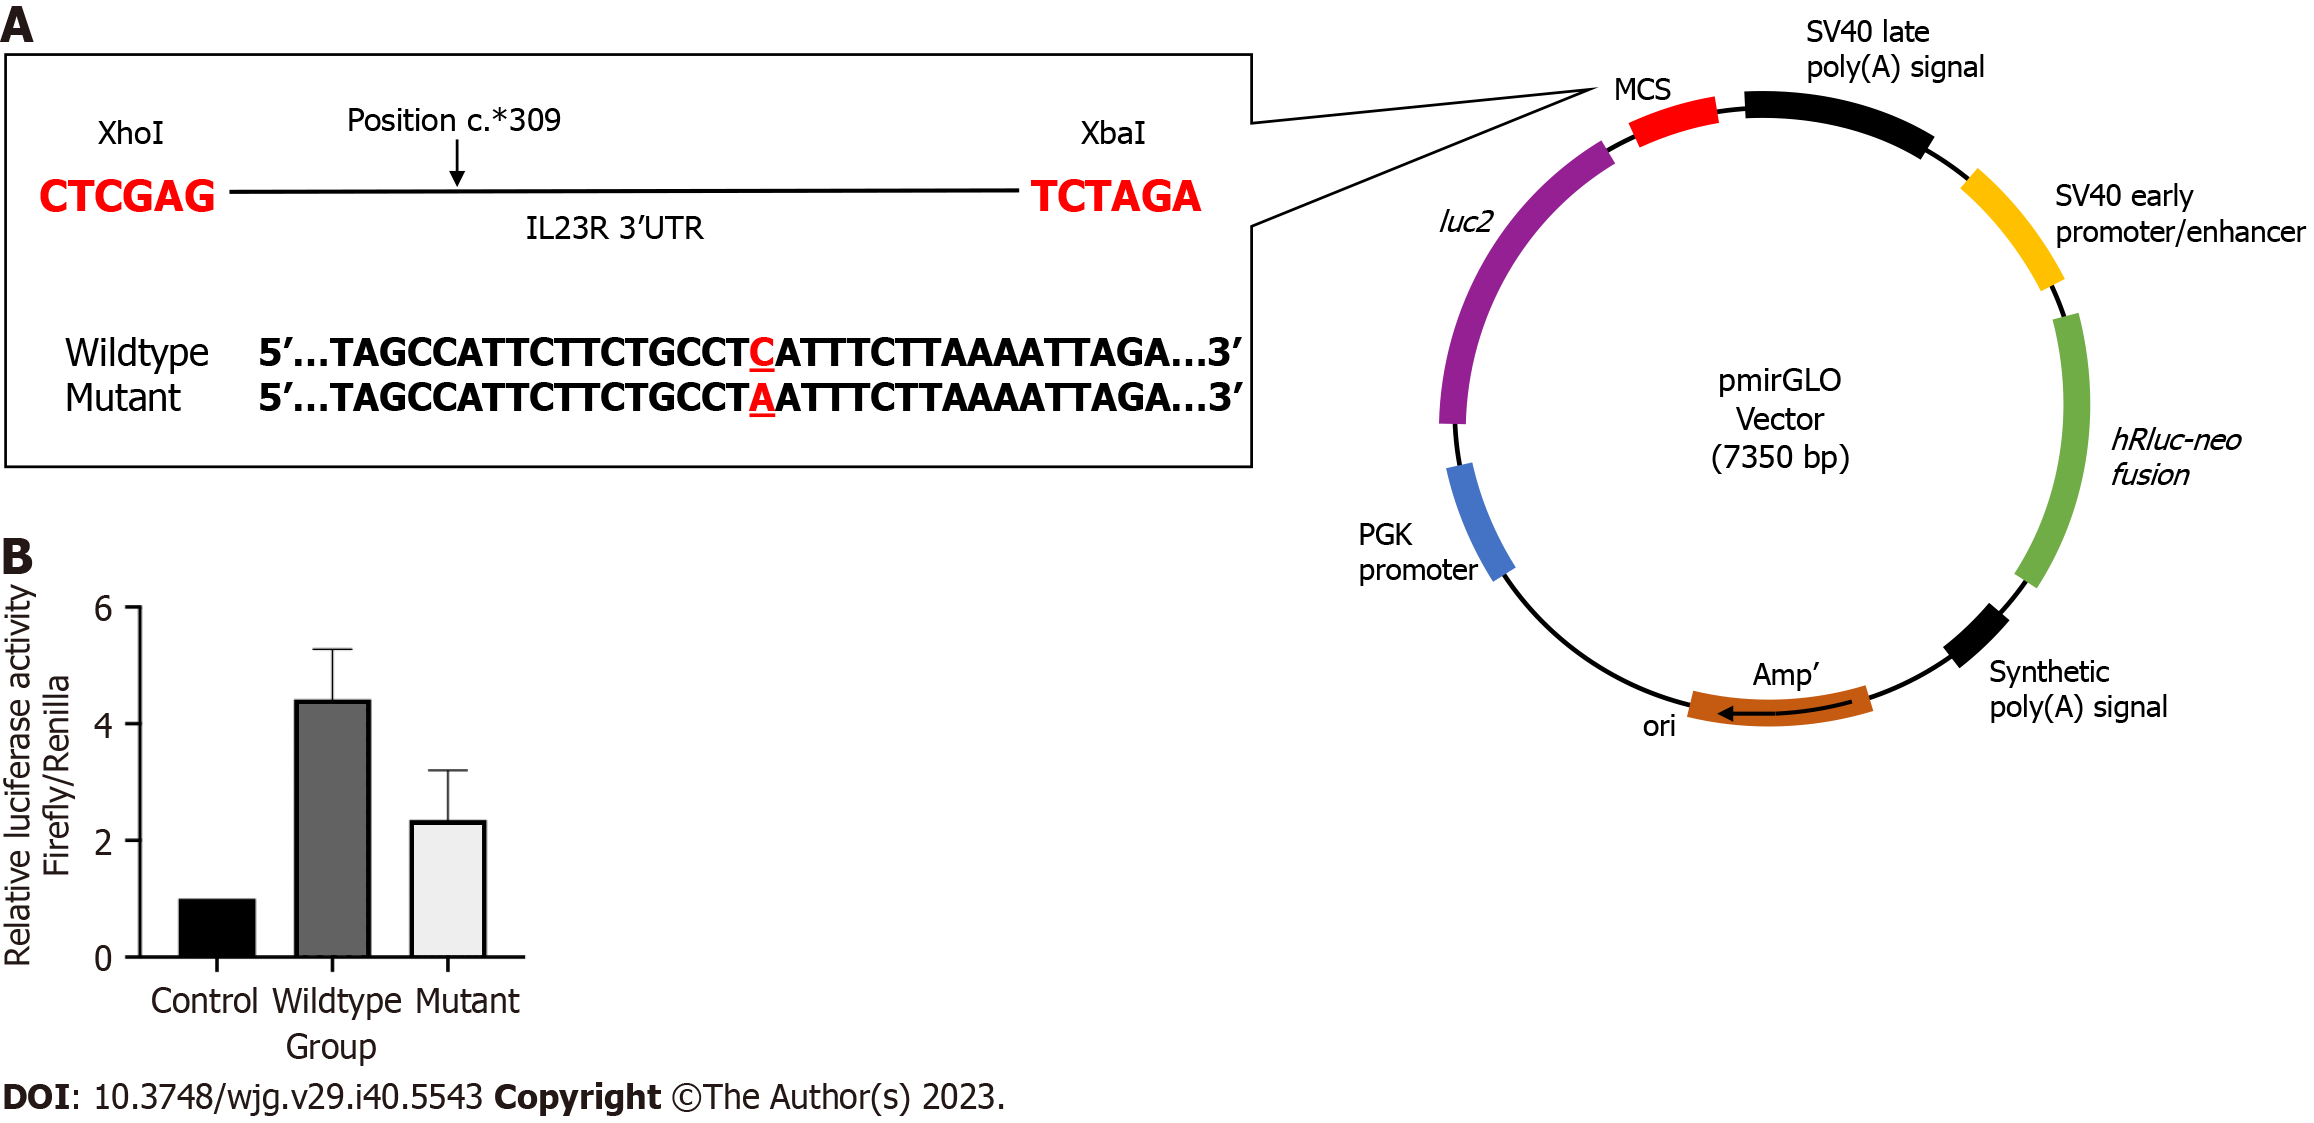
Figure 2 Dual-luciferase reporter assay for rs10889677 construct.
A: The structure of luciferase vector, pmirGLO, with wildtype and mutant constructs; B: Luciferase activity of HT29 cell line transfected with a construct containing wildtype and mutant variant of rs10889677. Data are presented as mean ± SEM; one-way ANOVA was employed; n = 3.
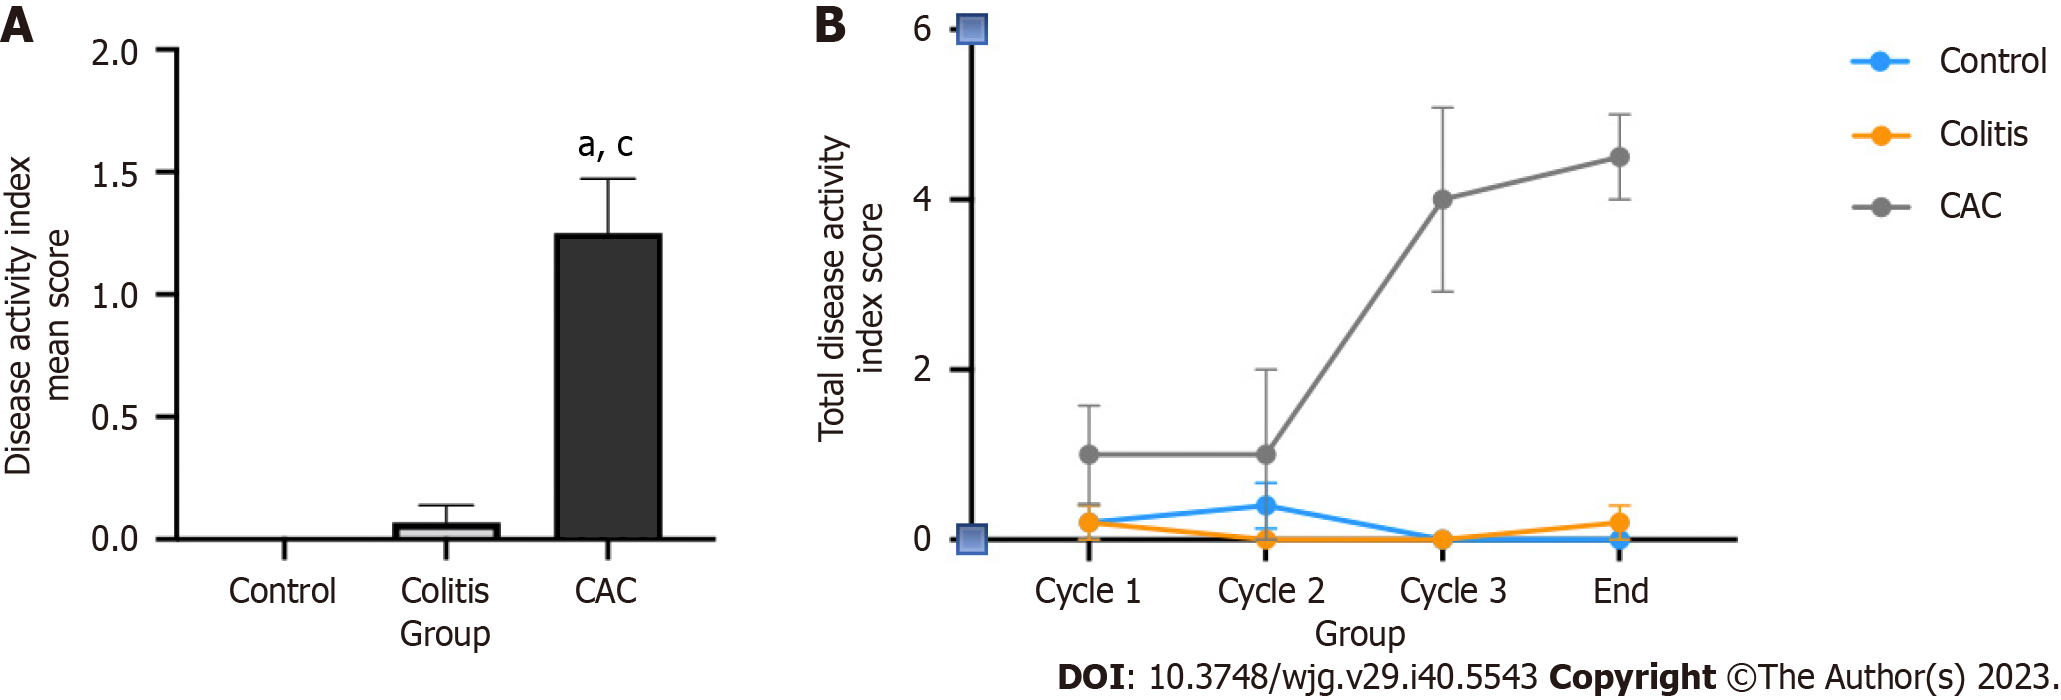
Figure 3 The disease activity index score.
A: The total average disease activity index (DAI) score per group at the end of treatment. aP < 0.05 (compared to the control group); cP < 0.05 (compared to the colitis group); data are presented as mean ± SEM; one-way ANOVA was used; n = 8; B: The total average DAI score per group at each dextran sodium sulphate-induction cycle. Two-way ANOVA was used. CAC: Colitis-associated cancer.
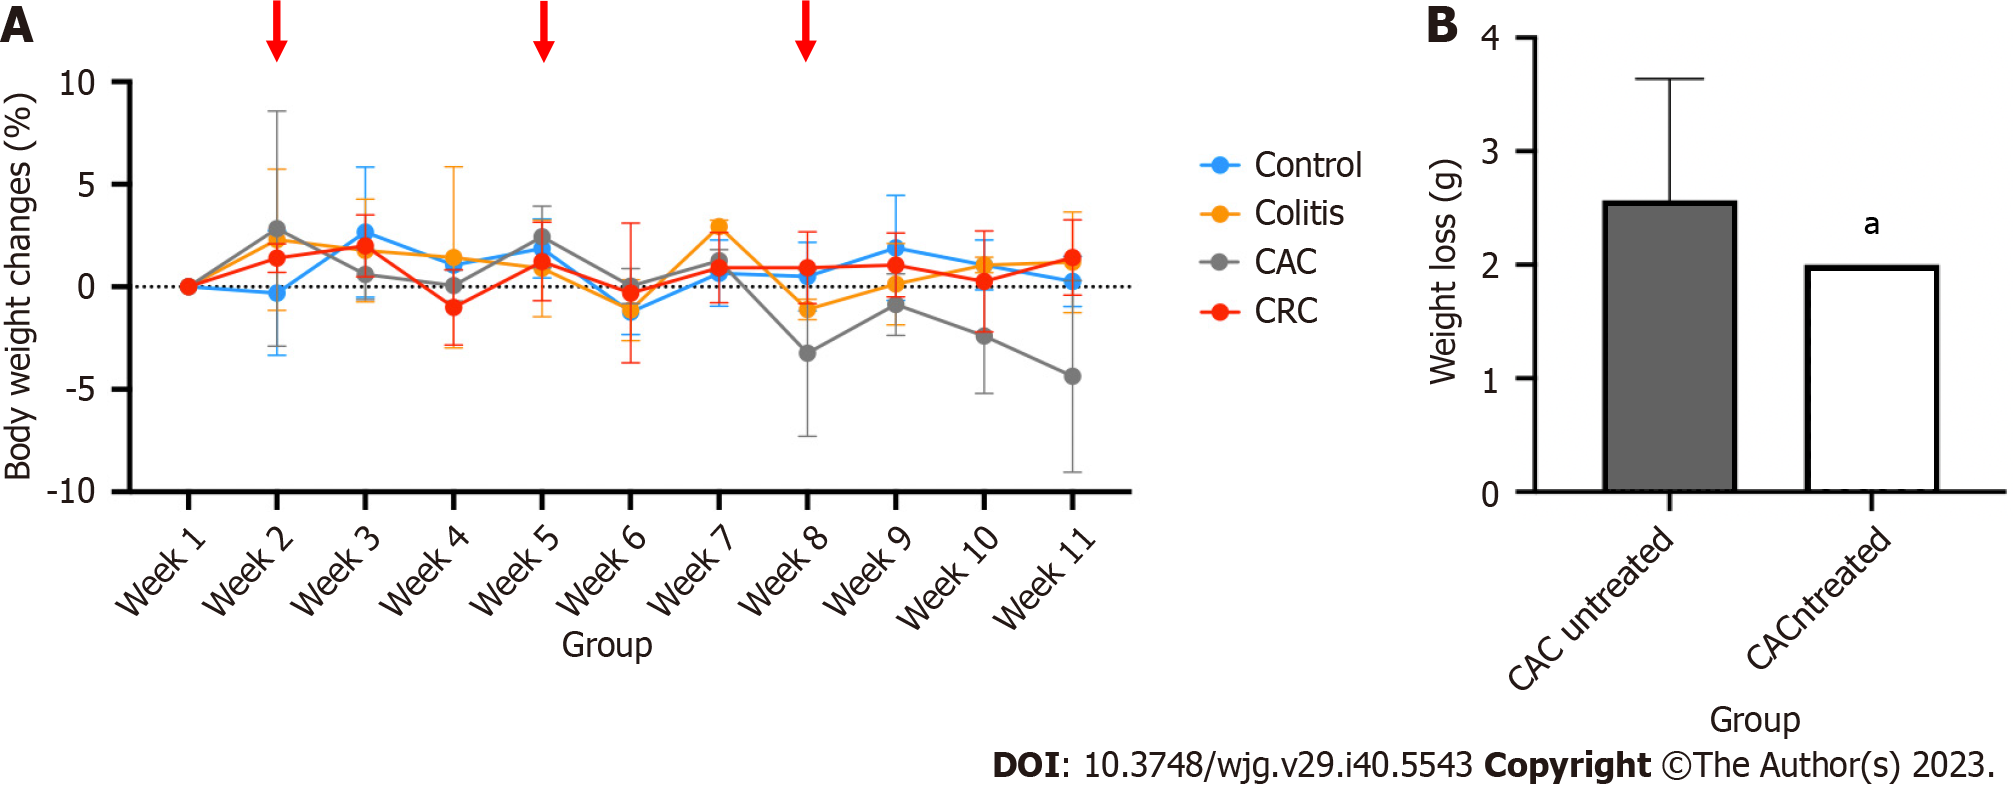
Figure 4 The body weight changes.
A: Percentage of weight loss (%) in all groups. A drop in body weight was seen in the colitis-associated cancer (CAC) group after every cycle of dextran sodium sulphate (DSS) induction. Red arrows indicate the cycle of DSS induction. Two-way ANOVA was employed; n = 8; B: Total mean body weight loss (g) between buparlisib-treated and -untreated CAC-induced mice group. aP < 0.05 (compared to the CAC untreated group); data are presented as mean ± SEM; student T-test was employed; n = 4. CAC: Colitis-associated cancer; CRC: Colorectal cancer.
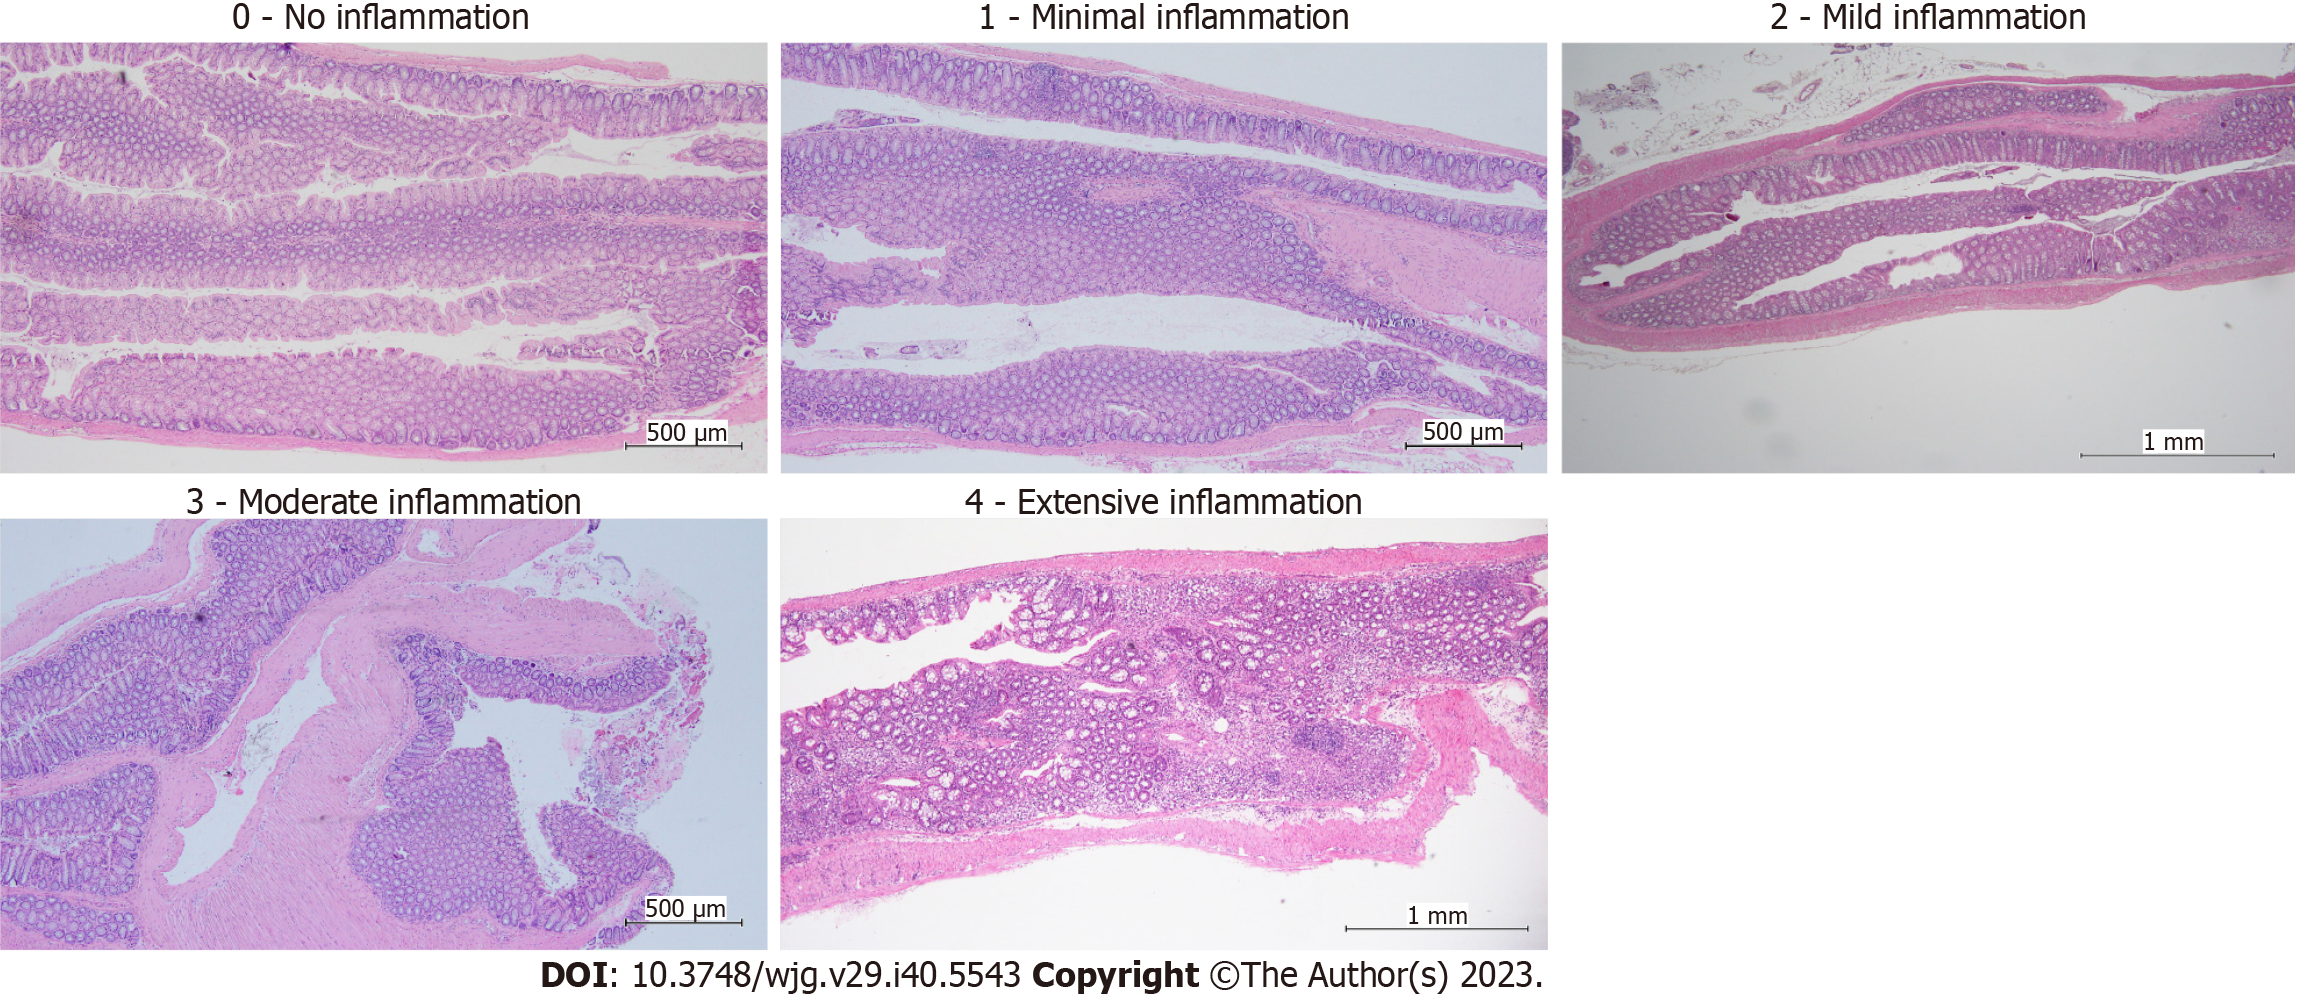
Figure 5 Histological structure assessment.
The range of the histologic scores varied from 0 (no inflammation) to 4 (extensive inflammation). Magnification is 40 ×.
Figure 6 Histological examination of the control, colitis and colitis-associated cancer mice model.
The control group exhibited a healthy colon with a uniform gland shape. Meanwhile, the colitis mice group showed mild to moderate inflammation. The tumor was only found in the colitis-associated cancer-induced mice group. Red arrows indicate the inflamed area and tumor sites. Magnification is 100 ×.
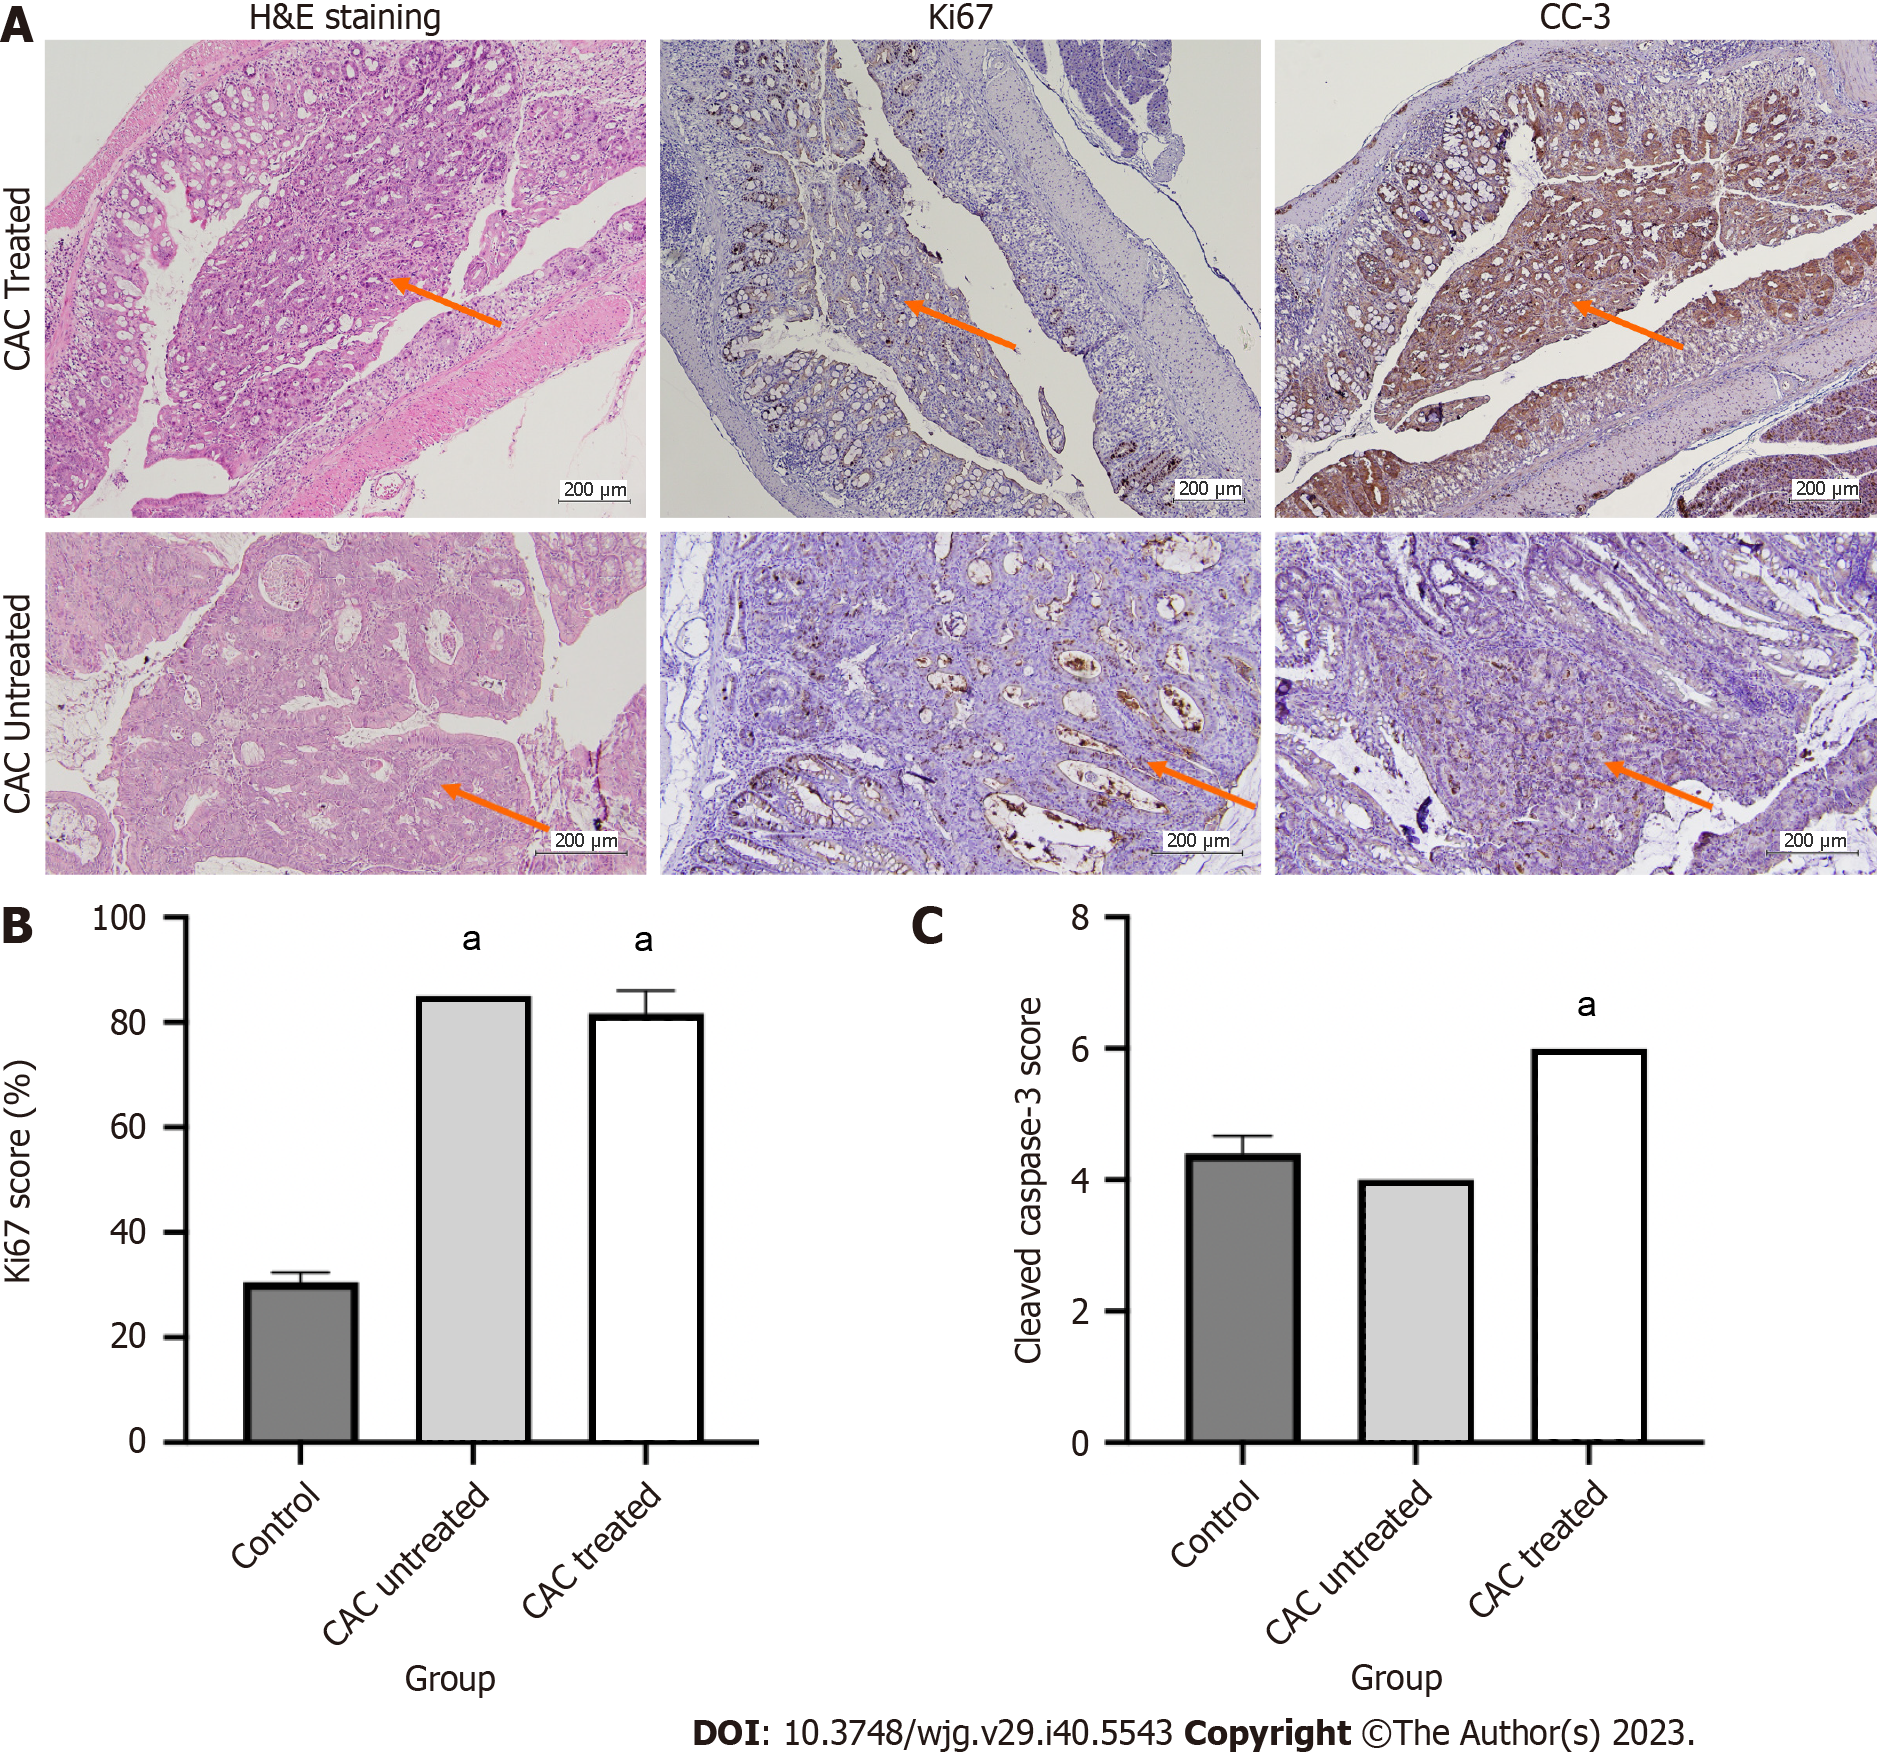
Figure 7 Immunohistochemistry analysis on Ki67 and cleaved caspase-3 markers on colitis-associated cancer-mice model.
A: H&E staining, Ki67 and cleaved caspase-3 (CC-3) staining; B and C: Ki67 and CC-3 staining exhibited lower proliferative and higher apoptotic cells on the buparlisib-treated colitis-associated cancer (CAC) mice model compared to the untreated CAC mice. aP < 0.05 (compared to the control group); data are presented as mean ± SEM; one-way ANOVA was employed; n = 4-8. The red arrow showed the tumor area. Magnification is 100 ×. CAC: Colitis-associated cancer; CC-3: Cleaved caspase-3.
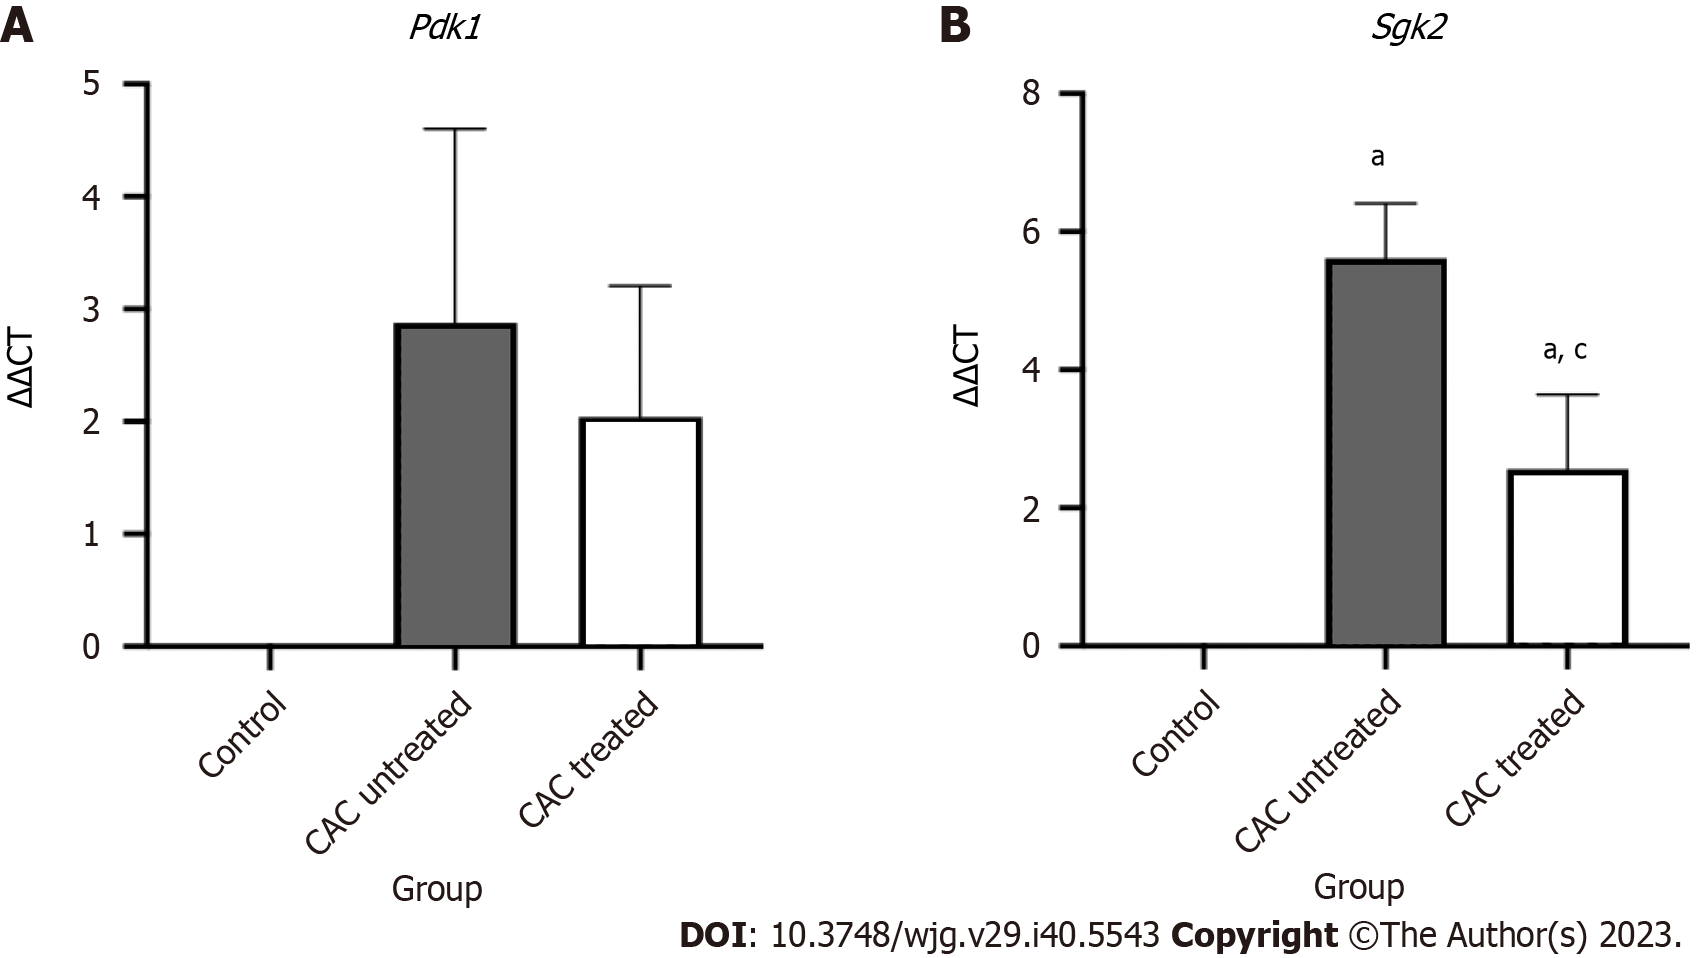
Figure 8 The relative gene expression for Pdk1 and Sgk2.
A: The relative gene expression of Pdk1 in colitis-associated cancer (CAC)-induced mice showed no significant difference between buparlisib treated and untreated group; B: In CAC-induced mice, buparlisib treatment demonstrated a significantly reduced expression of Sgk2.aP < 0.05 (compared to the control group); cP < 0.05 (compared to the CAC untreated group); data are presented as mean ± SEM; one-way ANOVA was employed; n = 4-8. CAC: Colitis-associated cancer; DDCT: Delta-delta CT; Pdk1: Phosphoinositide-dependent kinase 1; Sgk2: Serum/glucocorticoid regulated kinase 2.
- Citation: Razali NN, Raja Ali RA, Muhammad Nawawi KN, Yahaya A, Mohd Rathi ND, Mokhtar NM. Roles of phosphatidylinositol-3-kinases signaling pathway in inflammation-related cancer: Impact of rs10889677 variant and buparlisib in colitis-associated cancer. World J Gastroenterol 2023; 29(40): 5543-5556
- URL: https://www.wjgnet.com/1007-9327/full/v29/i40/5543.htm
- DOI: https://dx.doi.org/10.3748/wjg.v29.i40.5543


