Copyright
©The Author(s) 2023.
World J Gastroenterol. Oct 21, 2023; 29(39): 5471-5482
Published online Oct 21, 2023. doi: 10.3748/wjg.v29.i39.5471
Published online Oct 21, 2023. doi: 10.3748/wjg.v29.i39.5471
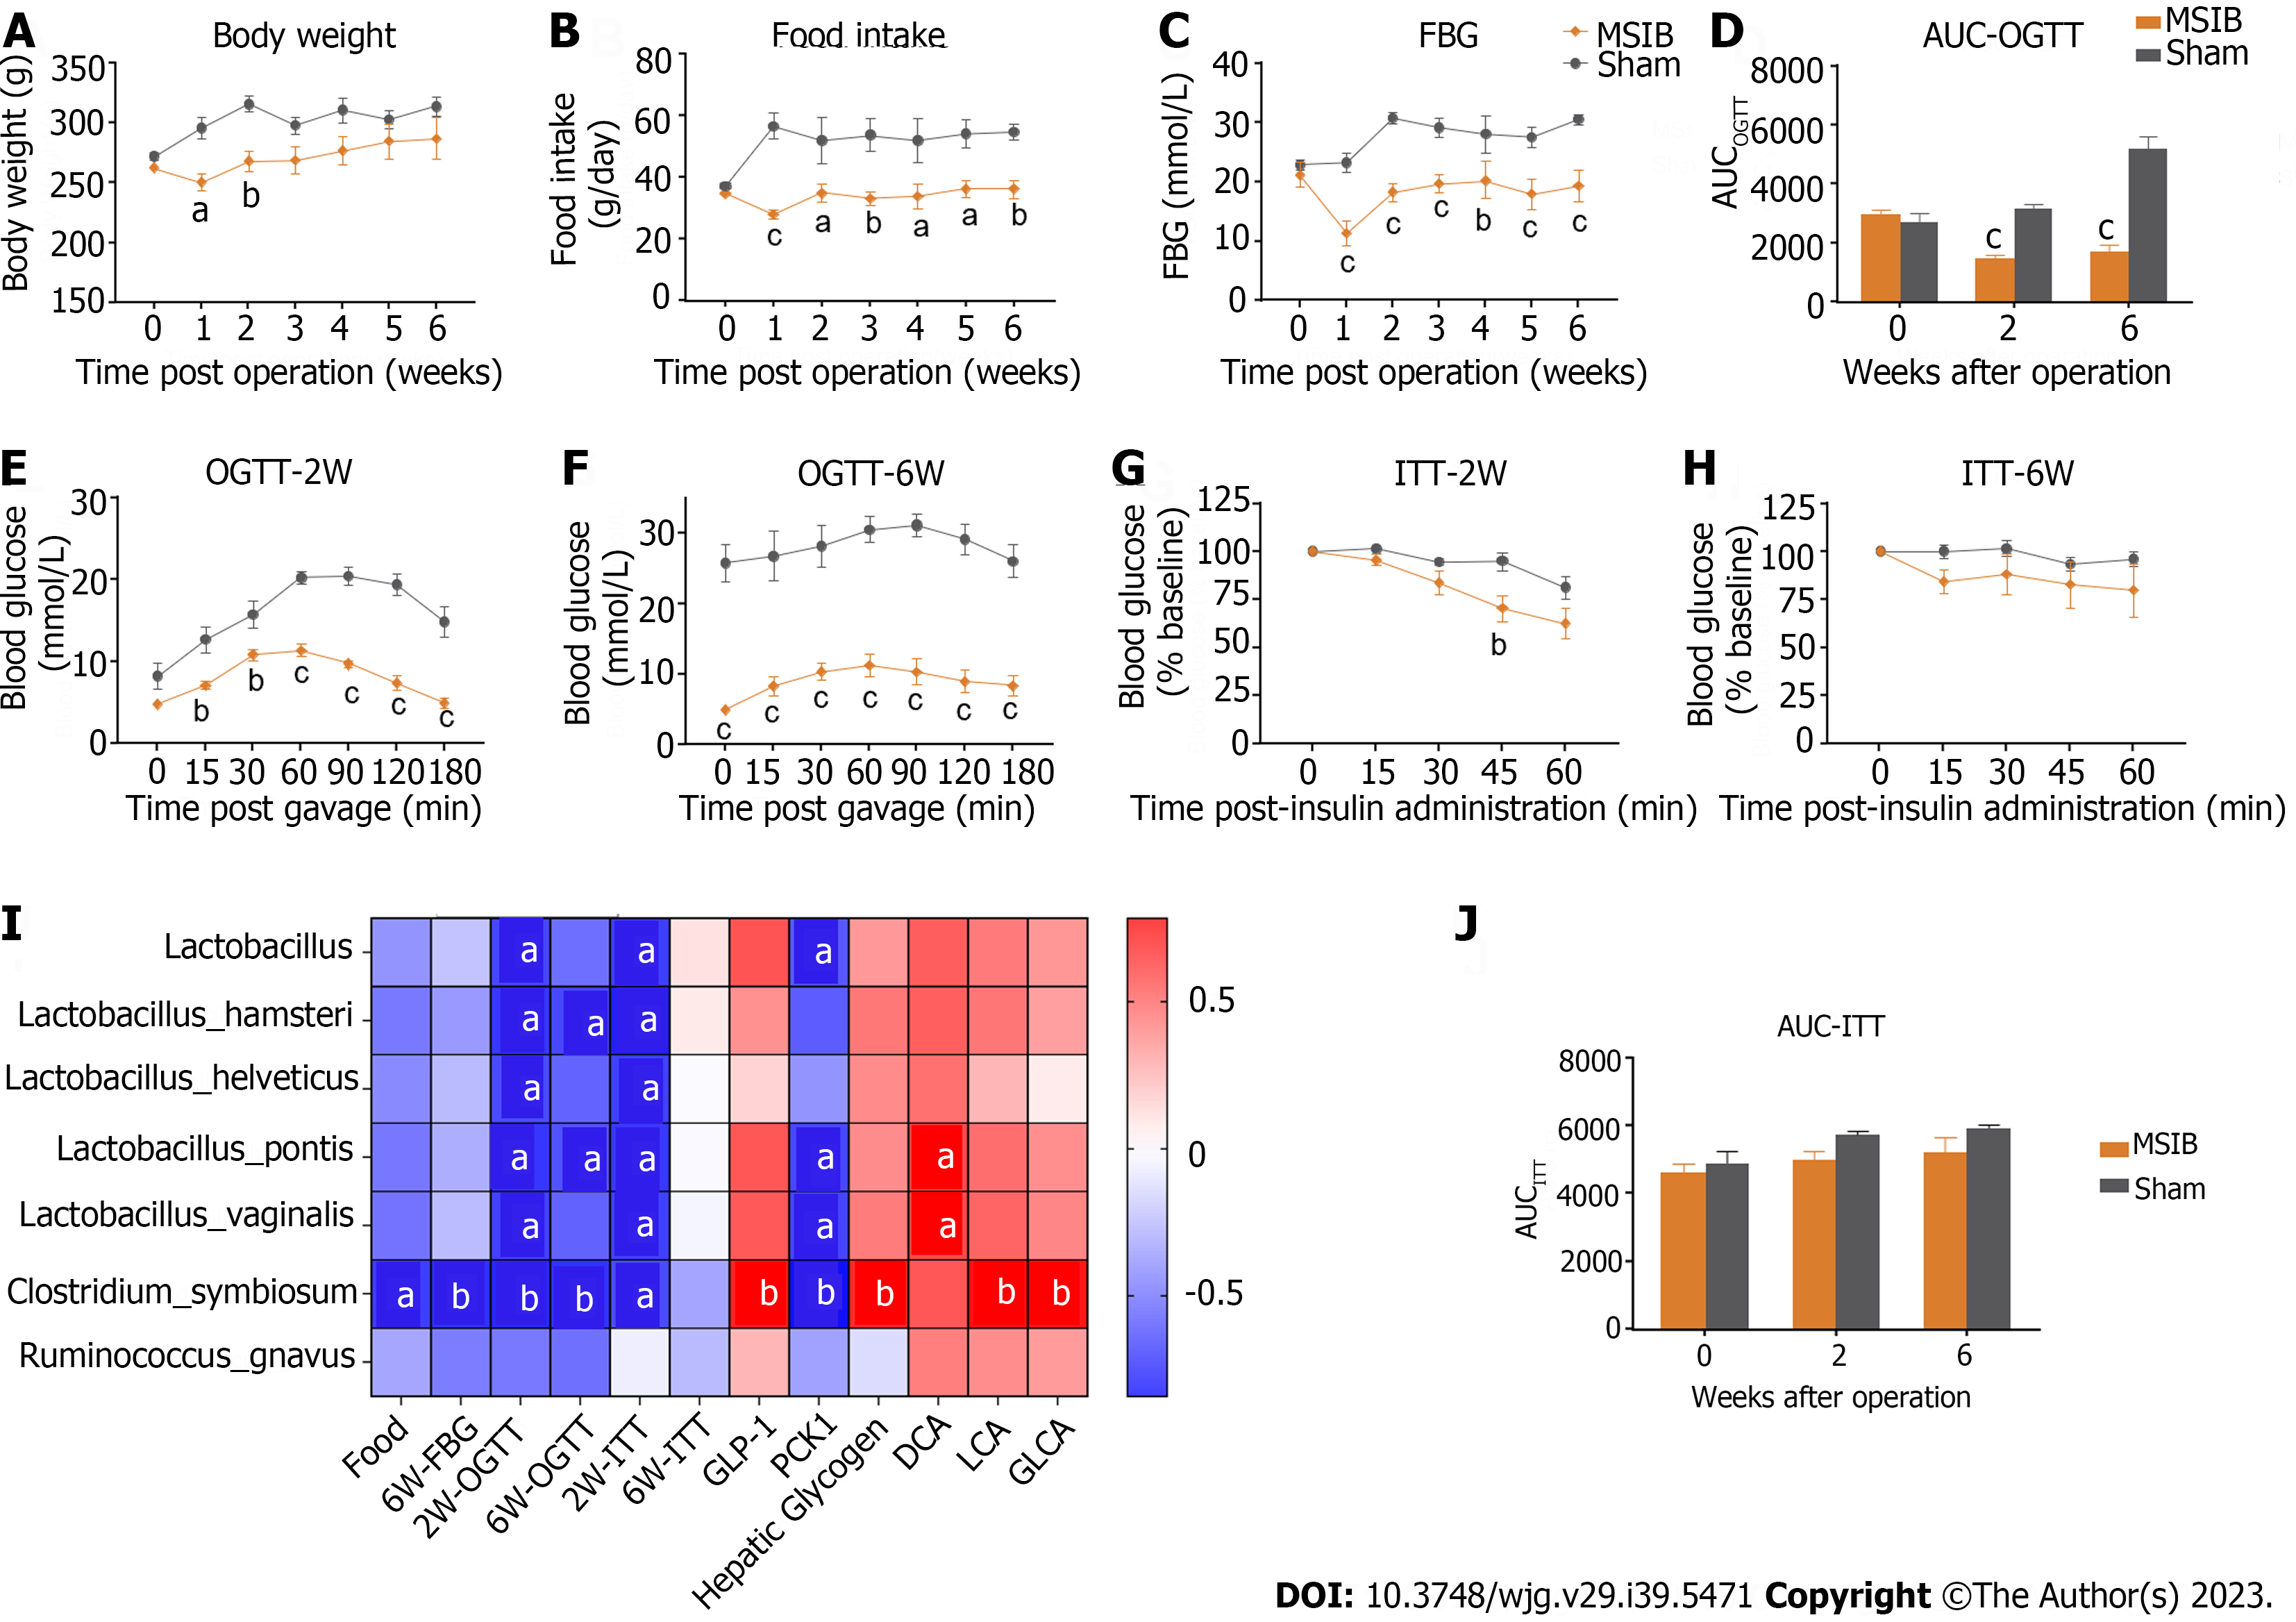
Figure 1 Glucose metabolism improved after mid-small intestine bypass and was significantly correlated with postoperative increased abundance of gut microbiota.
A: Postoperative body weight changes in rats; B: Postoperative food intake in rats; C: Postoperative mean random blood glucose changes in rats; D-F: Glucose tolerance test and area under the curve in rats; G-J: Insulin sensitivity test and area under the curve in rats (G, H, and J); analysis of the correlation between postoperative abundance of rising gut microbiota and glucose metabolism and bile acids (I). Data are expressed as mean ± SEM and statistical significance was determined by two-tailed Student’s test or two-way ANOVA, aP < 0.05, bP < 0.01, cP < 0.001. FBG: Fasting blood glucose; AUC: Area under the curve; OGTT: Oral glucose tolerance test; MSIB: Mid-small intestine bypass; ITT: Insulin tolerance test; PCK1: Phosphoenolpyruvate carboxykinase 1; DCA: Deoxycholic acid; LCA: Lithocholic acid; GLCA: Glycolithocholic acid.
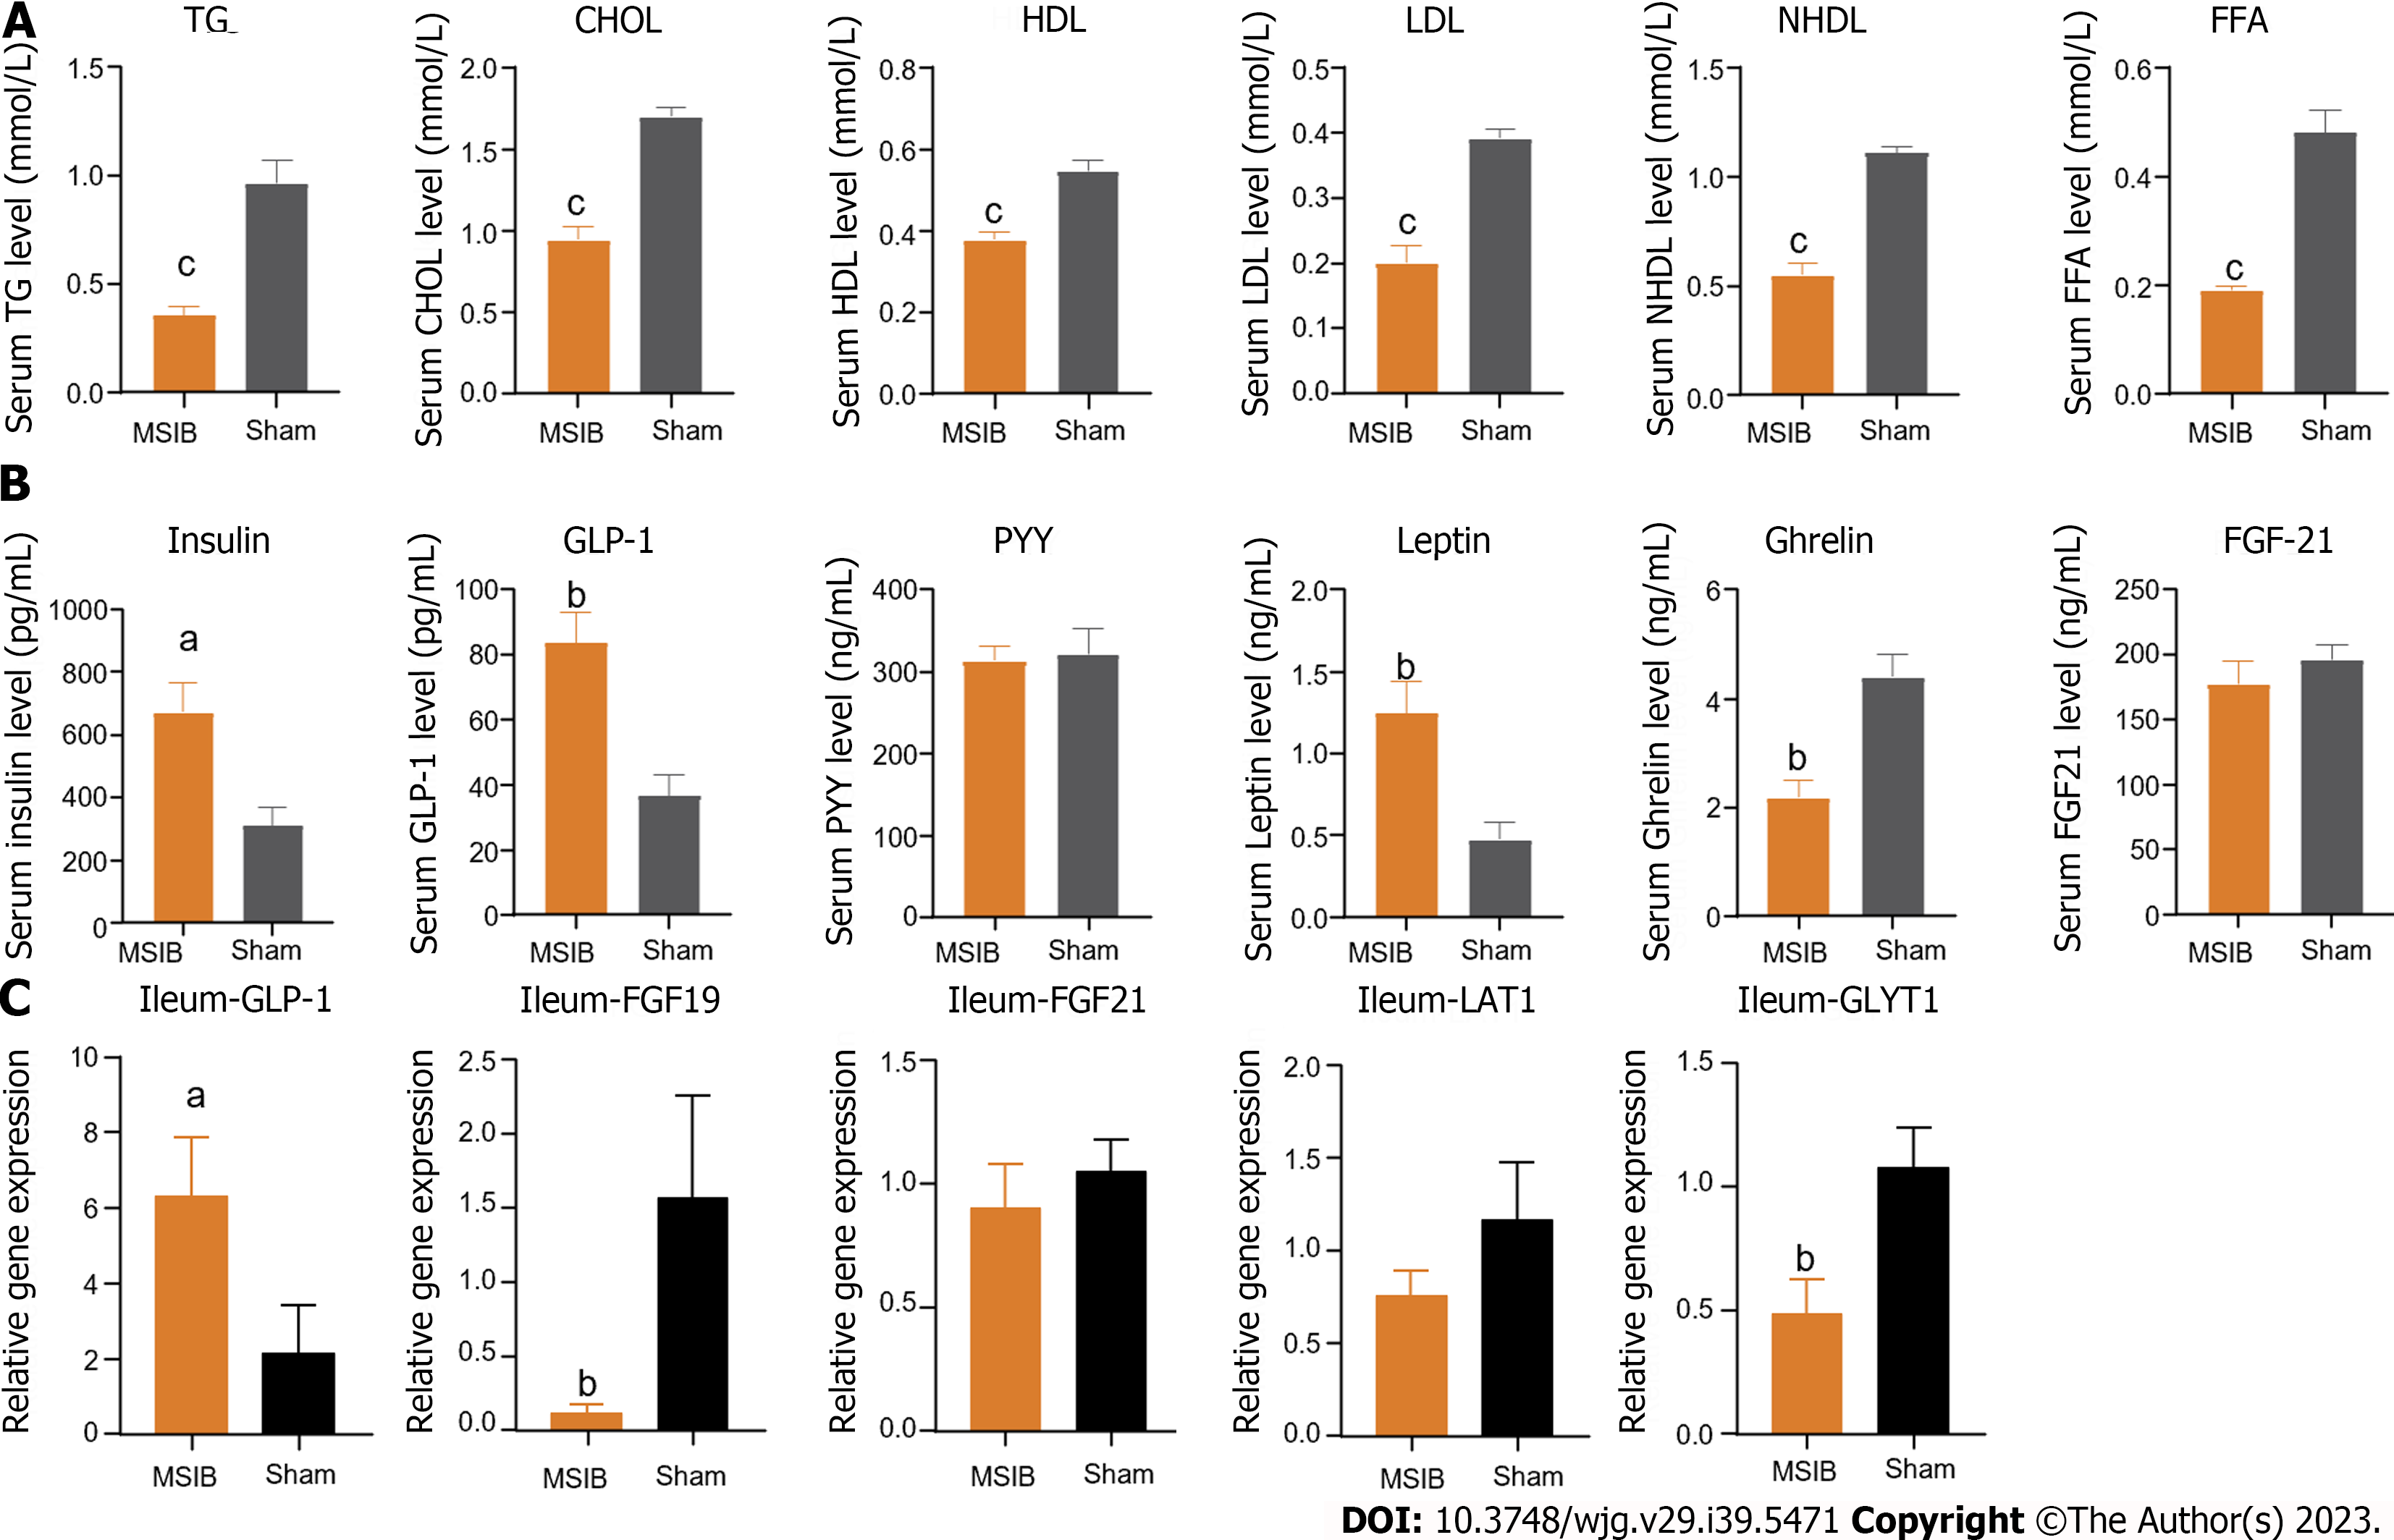
Figure 2 The serum lipid metabolism was improved, serum glucagon-like peptide 1 level was increased and intestinal glucagon-like peptide 1 transcript was increased in rats after mid-small intestine bypass.
A: Changes in serum triglycerides, total cholesterol, high-density lipoprotein, low-density lipoprotein, non-high-density lipoprotein, and free fatty acids levels in rats after surgery; B: Changes in serum gastrointestinal hormones in rats after surgery; C: Changes in intestinal glucagon-like peptide 1, fibroblast growth factor 19, fibroblast growth factor 21, LAT1, glycine transporter 1 transcript in rats after surgery. Data are expressed as mean ± SEM and statistical significance was determined by two-tailed Student’s test or two-way ANOVA, aP < 0.05, bP < 0.01, cP < 0.001. TG: Triglycerides; CHOL: Cholesterol; HDL: High-density lipoprotein; LDL: Low-density lipoprotein; NHDL: Non-high-density lipoprotein; FFA: Free fatty acid; GLP-1: Glucagon-like peptide 1; PYY: Peptide tyrosine tyrosine; FGF21: Fibroblast growth factor 21; GLYT1: Glycine transporter 1.
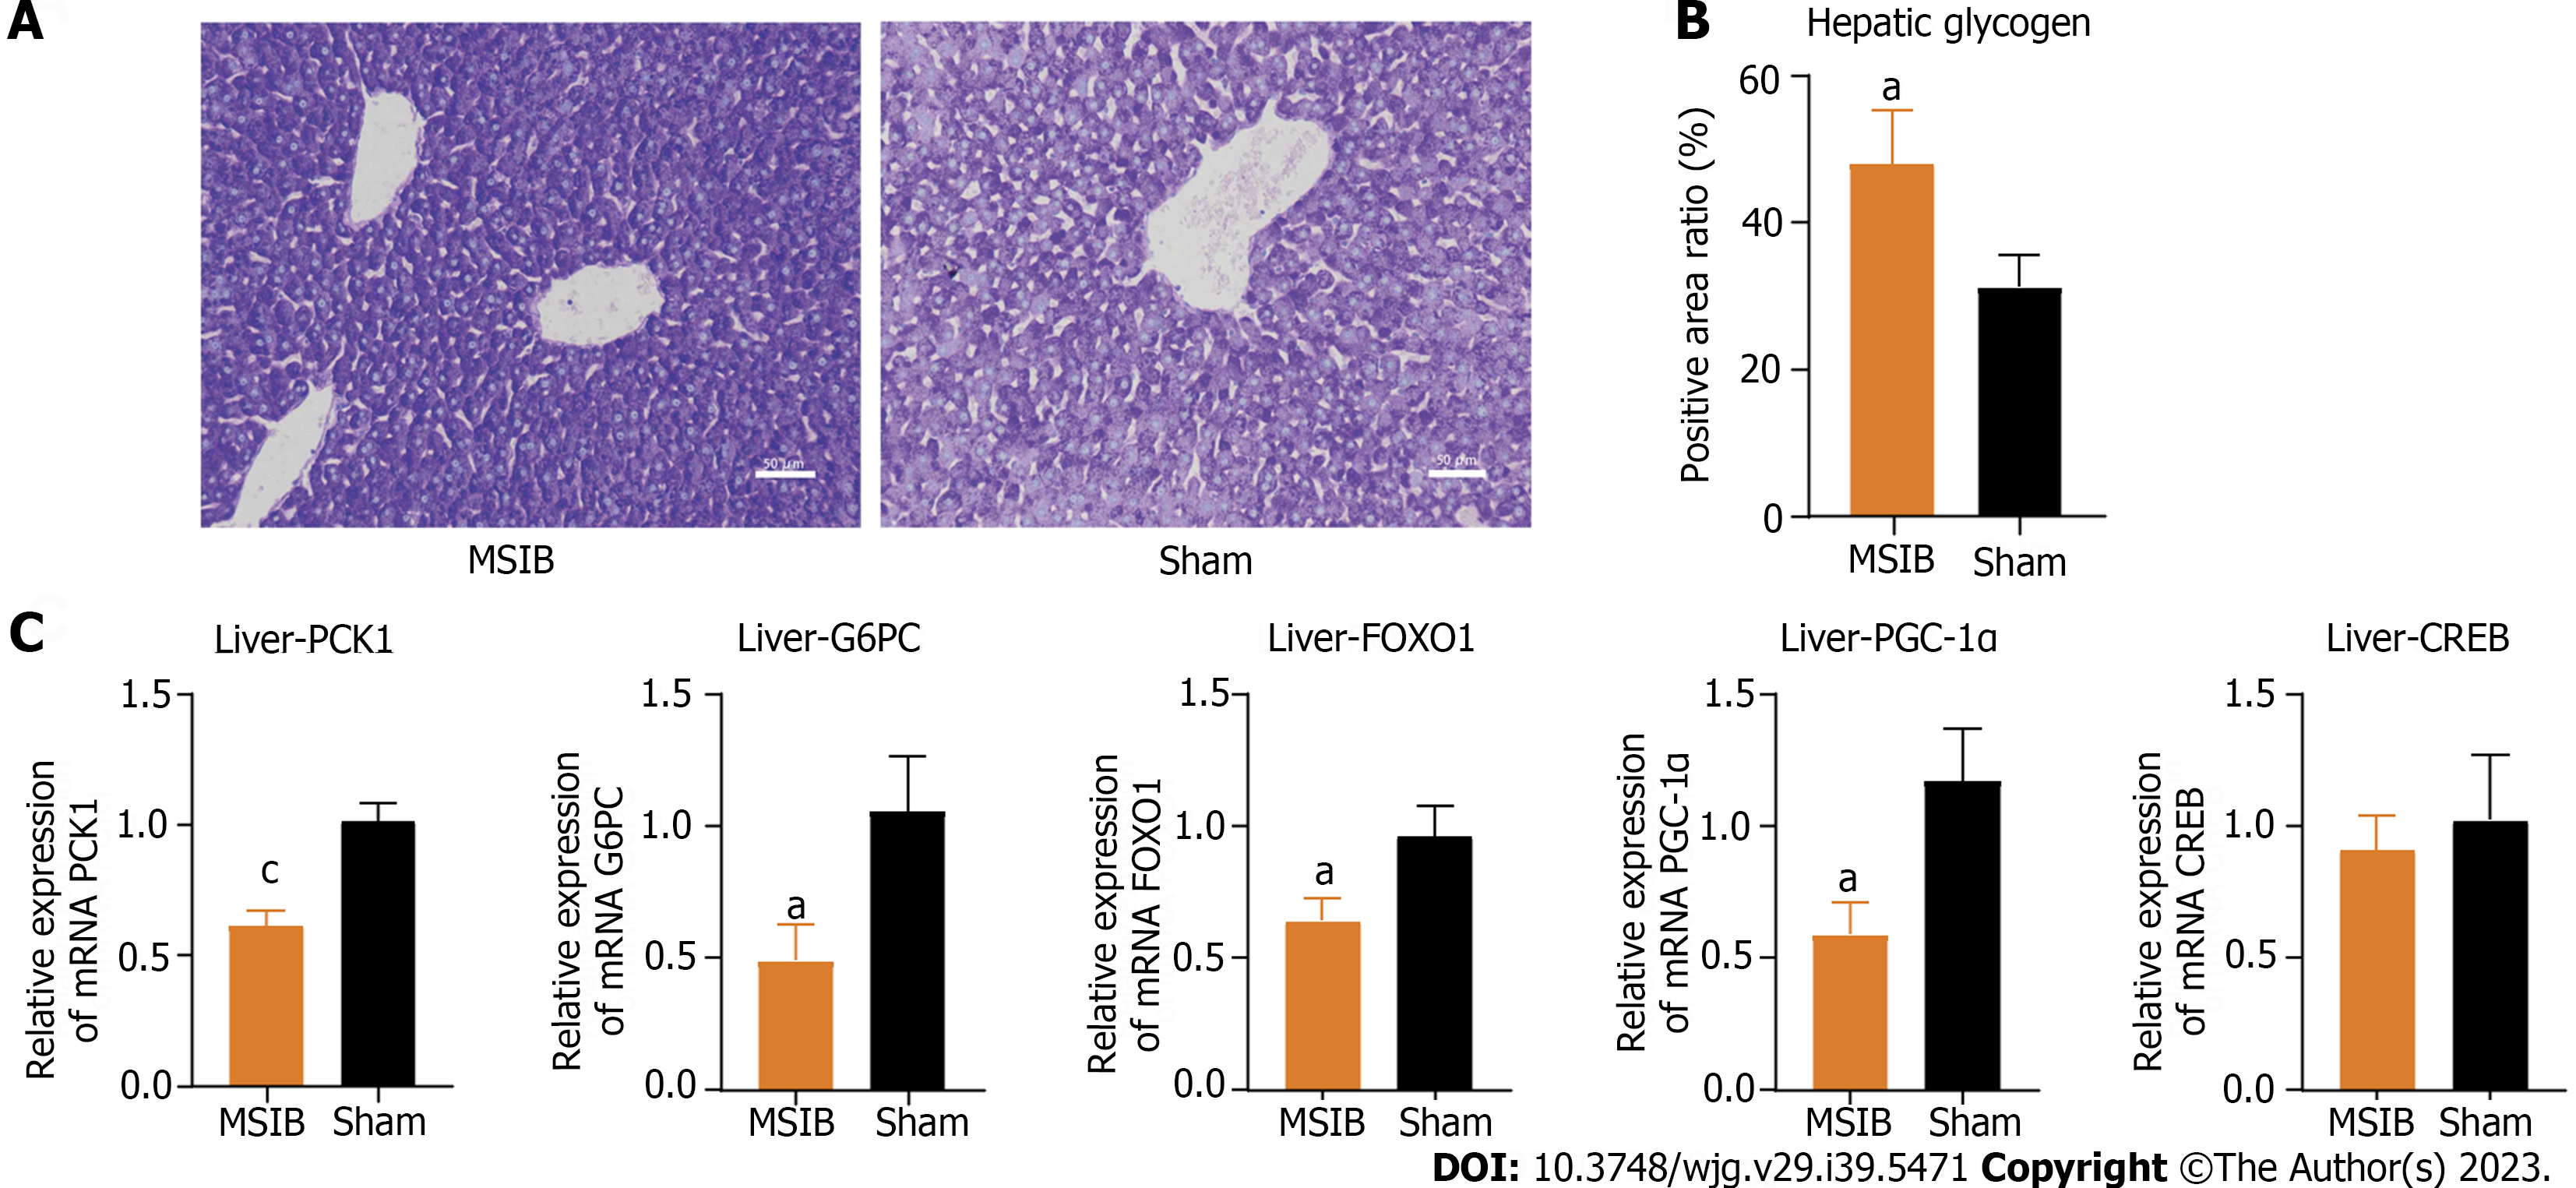
Figure 3 Increased glycogen reserves and decreased expression of gluconeogenesis-related enzymes and transcription factors in rat liver after mid-small intestine bypass.
A and B: Glycogen staining and comparison of liver tissue sections; C: Expression of key gluconeogenesis enzymes and regulatory-related transcription factors. Data are expressed as mean ± SEM and statistical significance was determined by two-tailed Student’s test or two-way ANOVA, aP < 0.05, cP < 0.001. MSIB: Mid-small intestine bypass; PCK1: Phosphoenolpyruvate carboxykinase 1; G6PC: Glucose-6-phosphatase; FOXO1: Forkhead box O1; PGC1α: Peroxisome proliferator-activated receptor gamma coactivator 1 alpha; CREB: cAMP response element-binding protein.
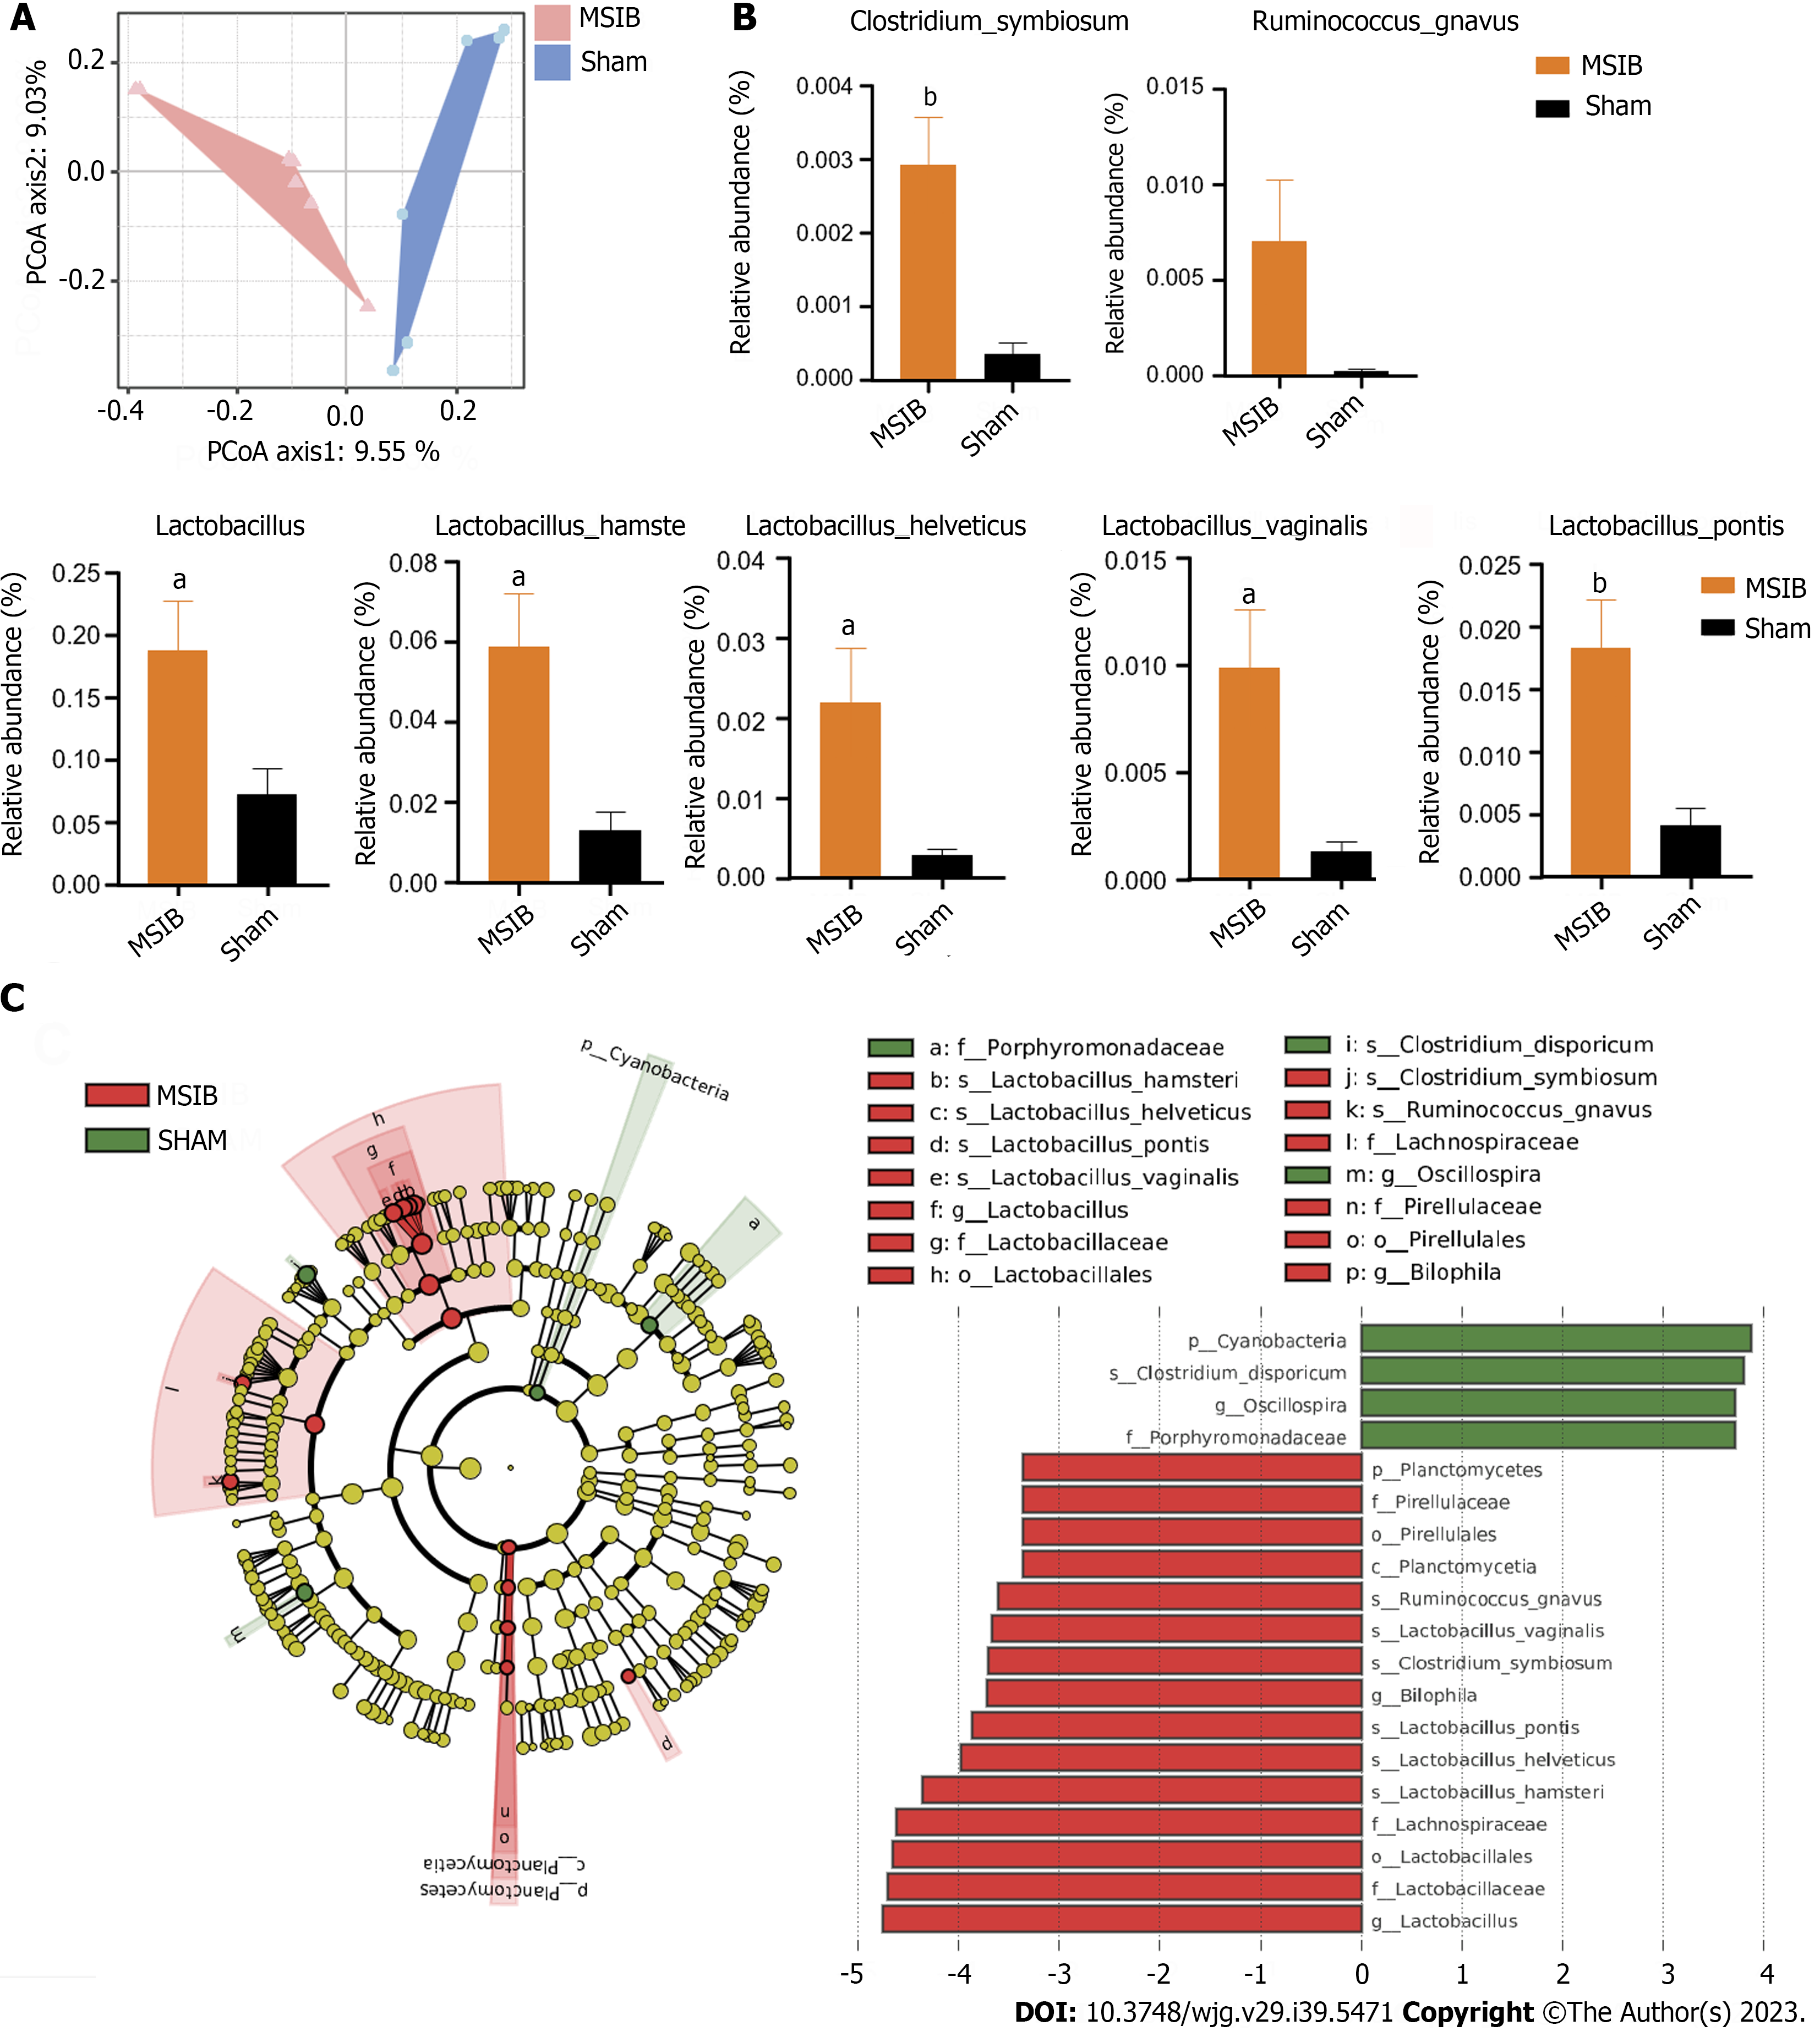
Figure 4 Changes in gut microbiota after mid-small intestine bypass.
A: Principal coordinate analysis of gut microbiota based on OUT data from mid-small intestine bypass (MSIB) and sham groups; B: Bacteria with increased intestinal abundance in rats after MSIB; C: Phylogenetic tree for comparison of linear discriminant analysis (LDA) effect sizes of gut microbiota in MSIB and sham groups, bacteria with significantly enriched LDA scores taxa are marked with the colours shown. Data are expressed as mean ± SEM and statistical significance was determined by two-tailed Student’s test or two-way ANOVA, aP < 0.05, bP < 0.01. MSIB: Mid-small intestine bypass; LDA: Linear discriminant analysis; PCoA: Principal coordinate analysis.
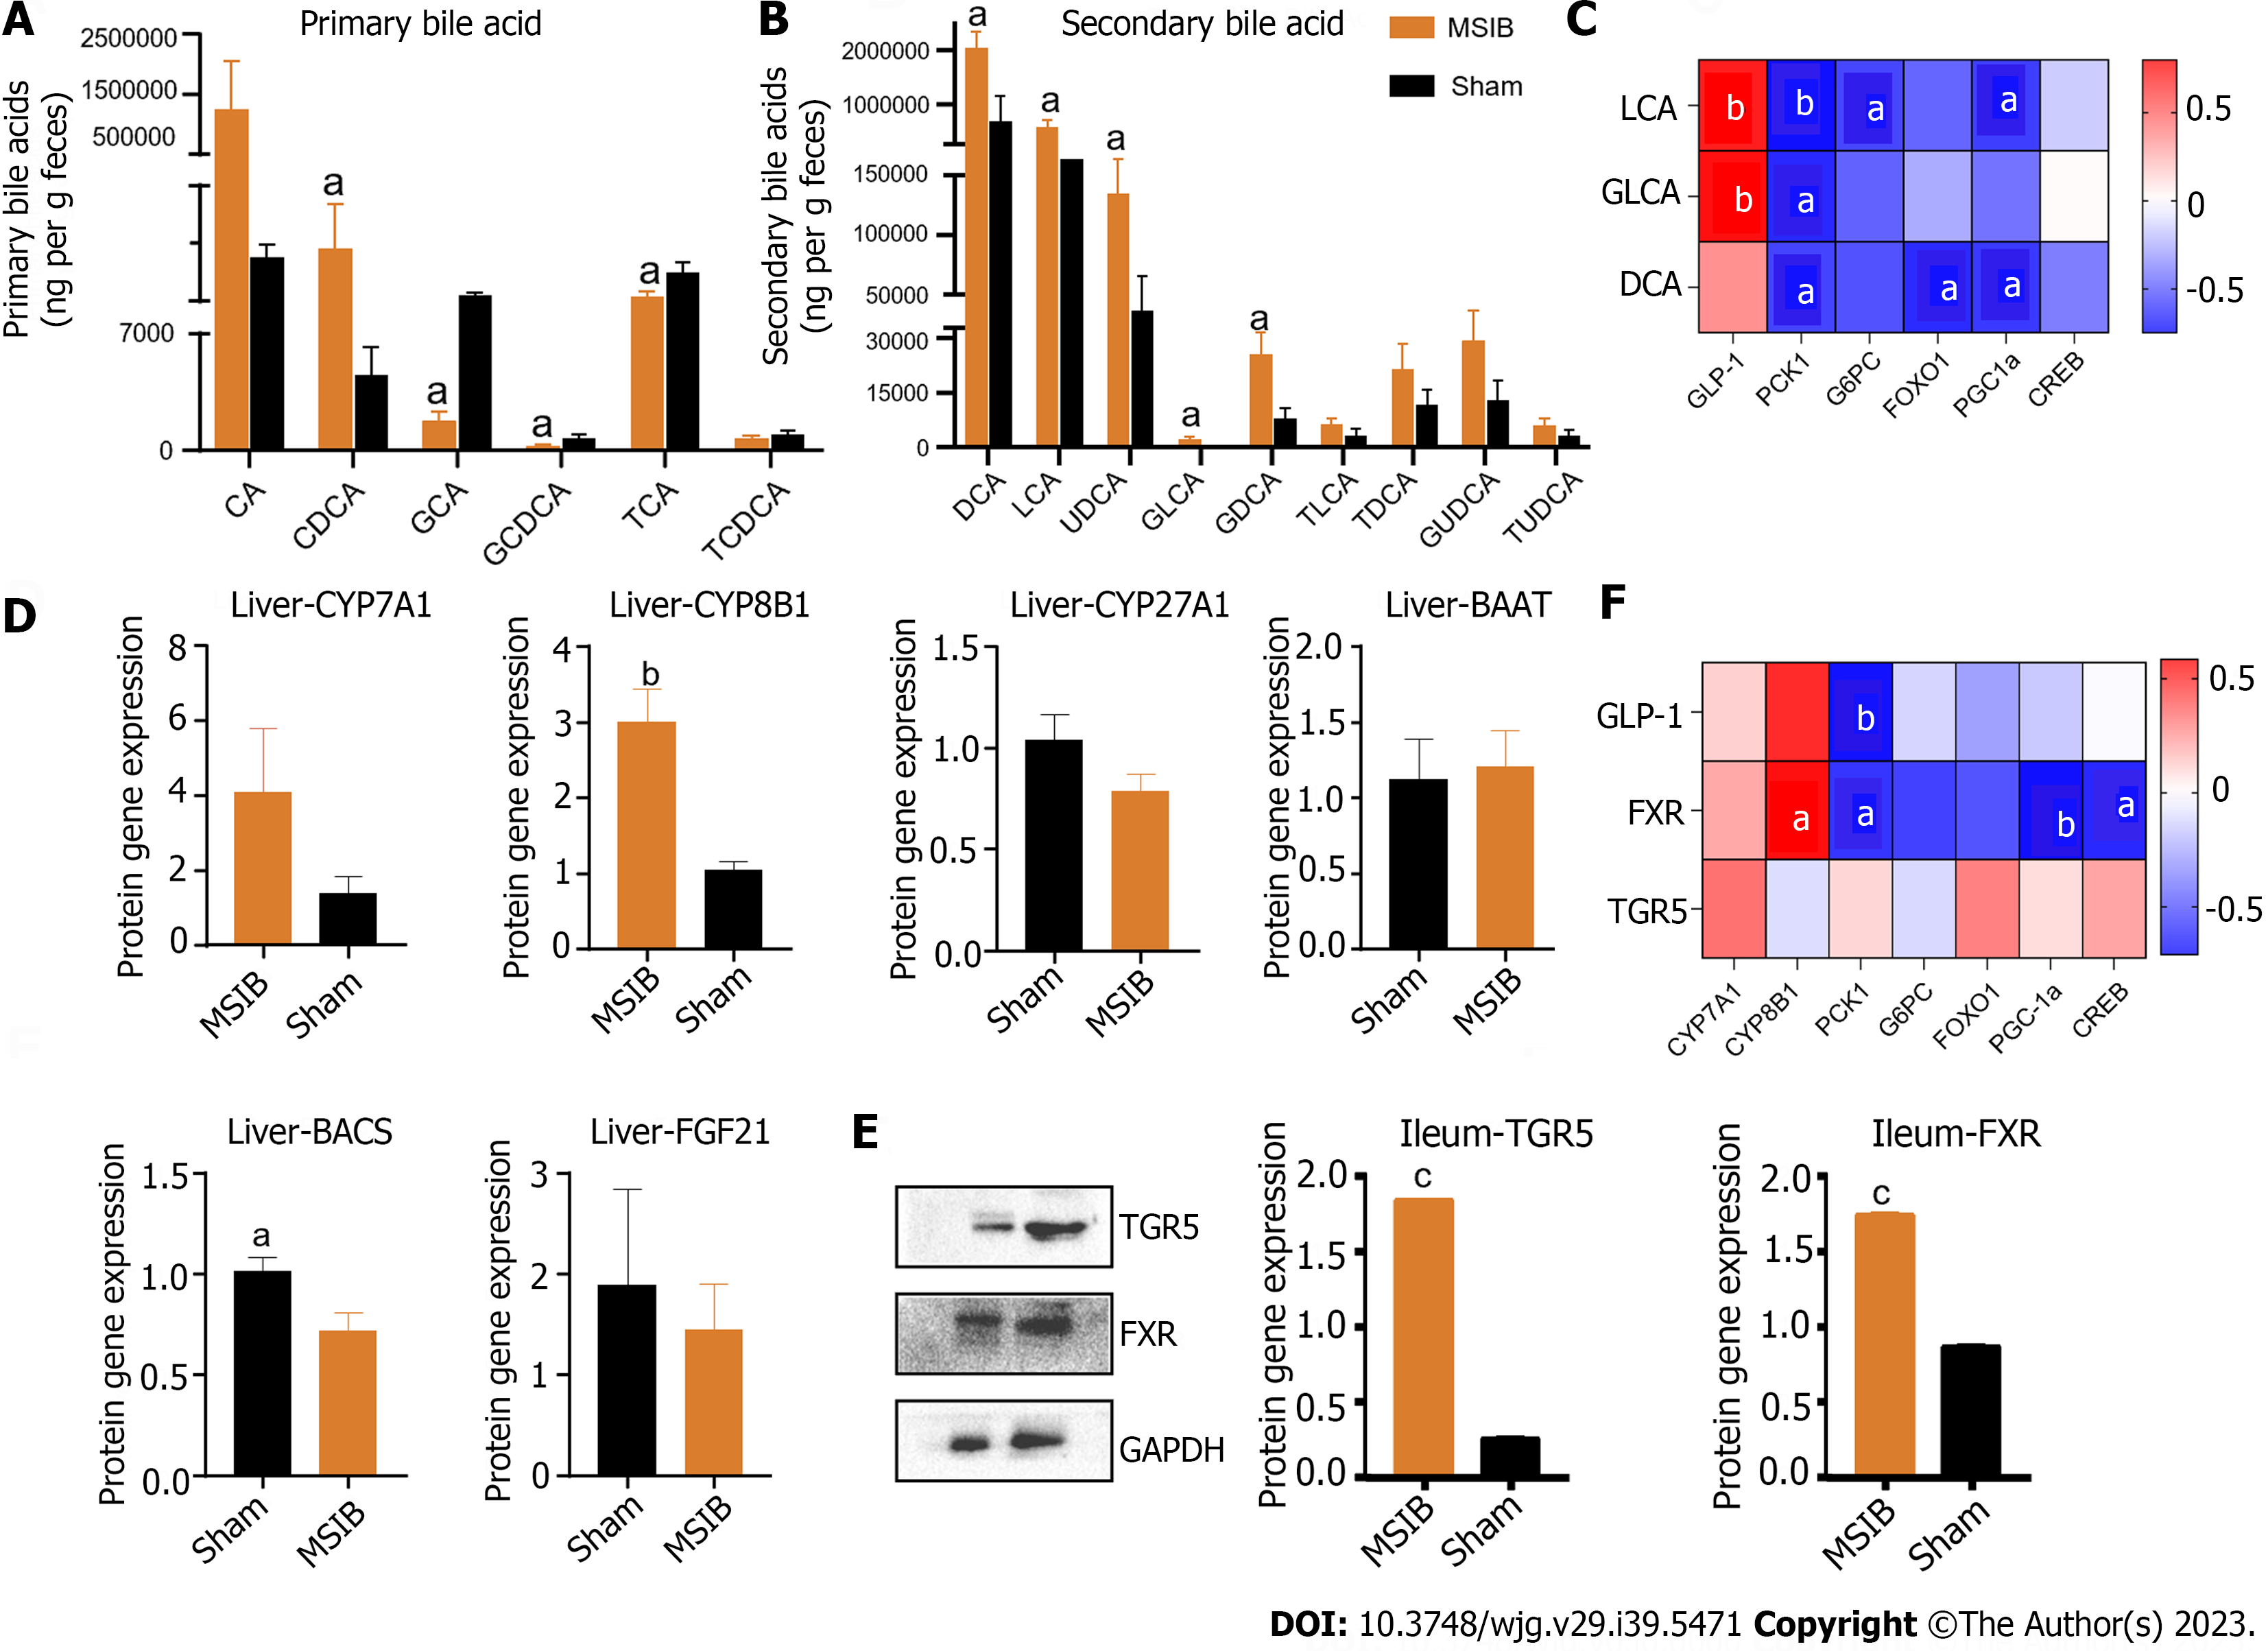
Figure 5 Changes in intestinal bile acid profile in rats after mid-small intestine bypass, correlating significantly with intestinal hormones and key enzymes of gluconeogenesis.
A: Changes in primary bile acid profile in rats; B: Changes in secondary bile acid profile in rats; C: Correlation analysis of bile acid with glucagon-like peptide 1 and factors regulating gluconeogenesis; D: Expression of bile acid synthase and transcription factor, fibroblast growth factor 21. E: Takeda G protein-coupled receptor 5 and farnesoid X receptor WB results. F: Correlation analysis. Data are expressed as mean ± SEM and statistical significance was determined by two-tailed Student’s test or two-way ANOVA, aP < 0.05, bP < 0.01, cP < 0.001. PCK1: Phosphoenolpyruvate carboxykinase 1; DCA: Deoxycholic acid; LCA: Lithocholic acid; GLCA: Glycolithocholic acid; GLP-1: Glucagon-like peptide 1; TGR5: Takeda G protein-coupled receptor 5; FXR: Farnesoid X receptor; G6PC: Glucose-6-phosphatase; CA: Cholic acid; CDCA: Chenodeoxycholic acid; GCA: Glycocholic acid; GCDCA: Glycochenodeoxycholic acid; TCA: Taurocholic acid; TCDCA: Taurochenodeoxycholic acid; UDCA: Ursodeoxycholic acid; GDCA: Glyco-deoxycholic acid; TLCA: Taurolithocholic acid; TDCA: Taurodeoxycholic acid; GUDCA: Glycoursodeoxycholic acid; TUDCA: Tauroursodeoxycholic acid; FOXO1: Forkhead box O1; PGC1α: Peroxisome proliferator-activated receptor gamma coactivator 1 alpha; CREB: cAMP response element-binding protein; MSIB: Mid-small intestine bypass; CYP: Cytochrome P450; BAAT: Bile acid-CoA amino acid N-acyltransferase; BACS: Bile acid-CoA synthetase; FGF21: Fibroblast growth aactor 21; TGR5: Takeda G protein-coupled receptor 5; FXR: Farnesol X receptor.
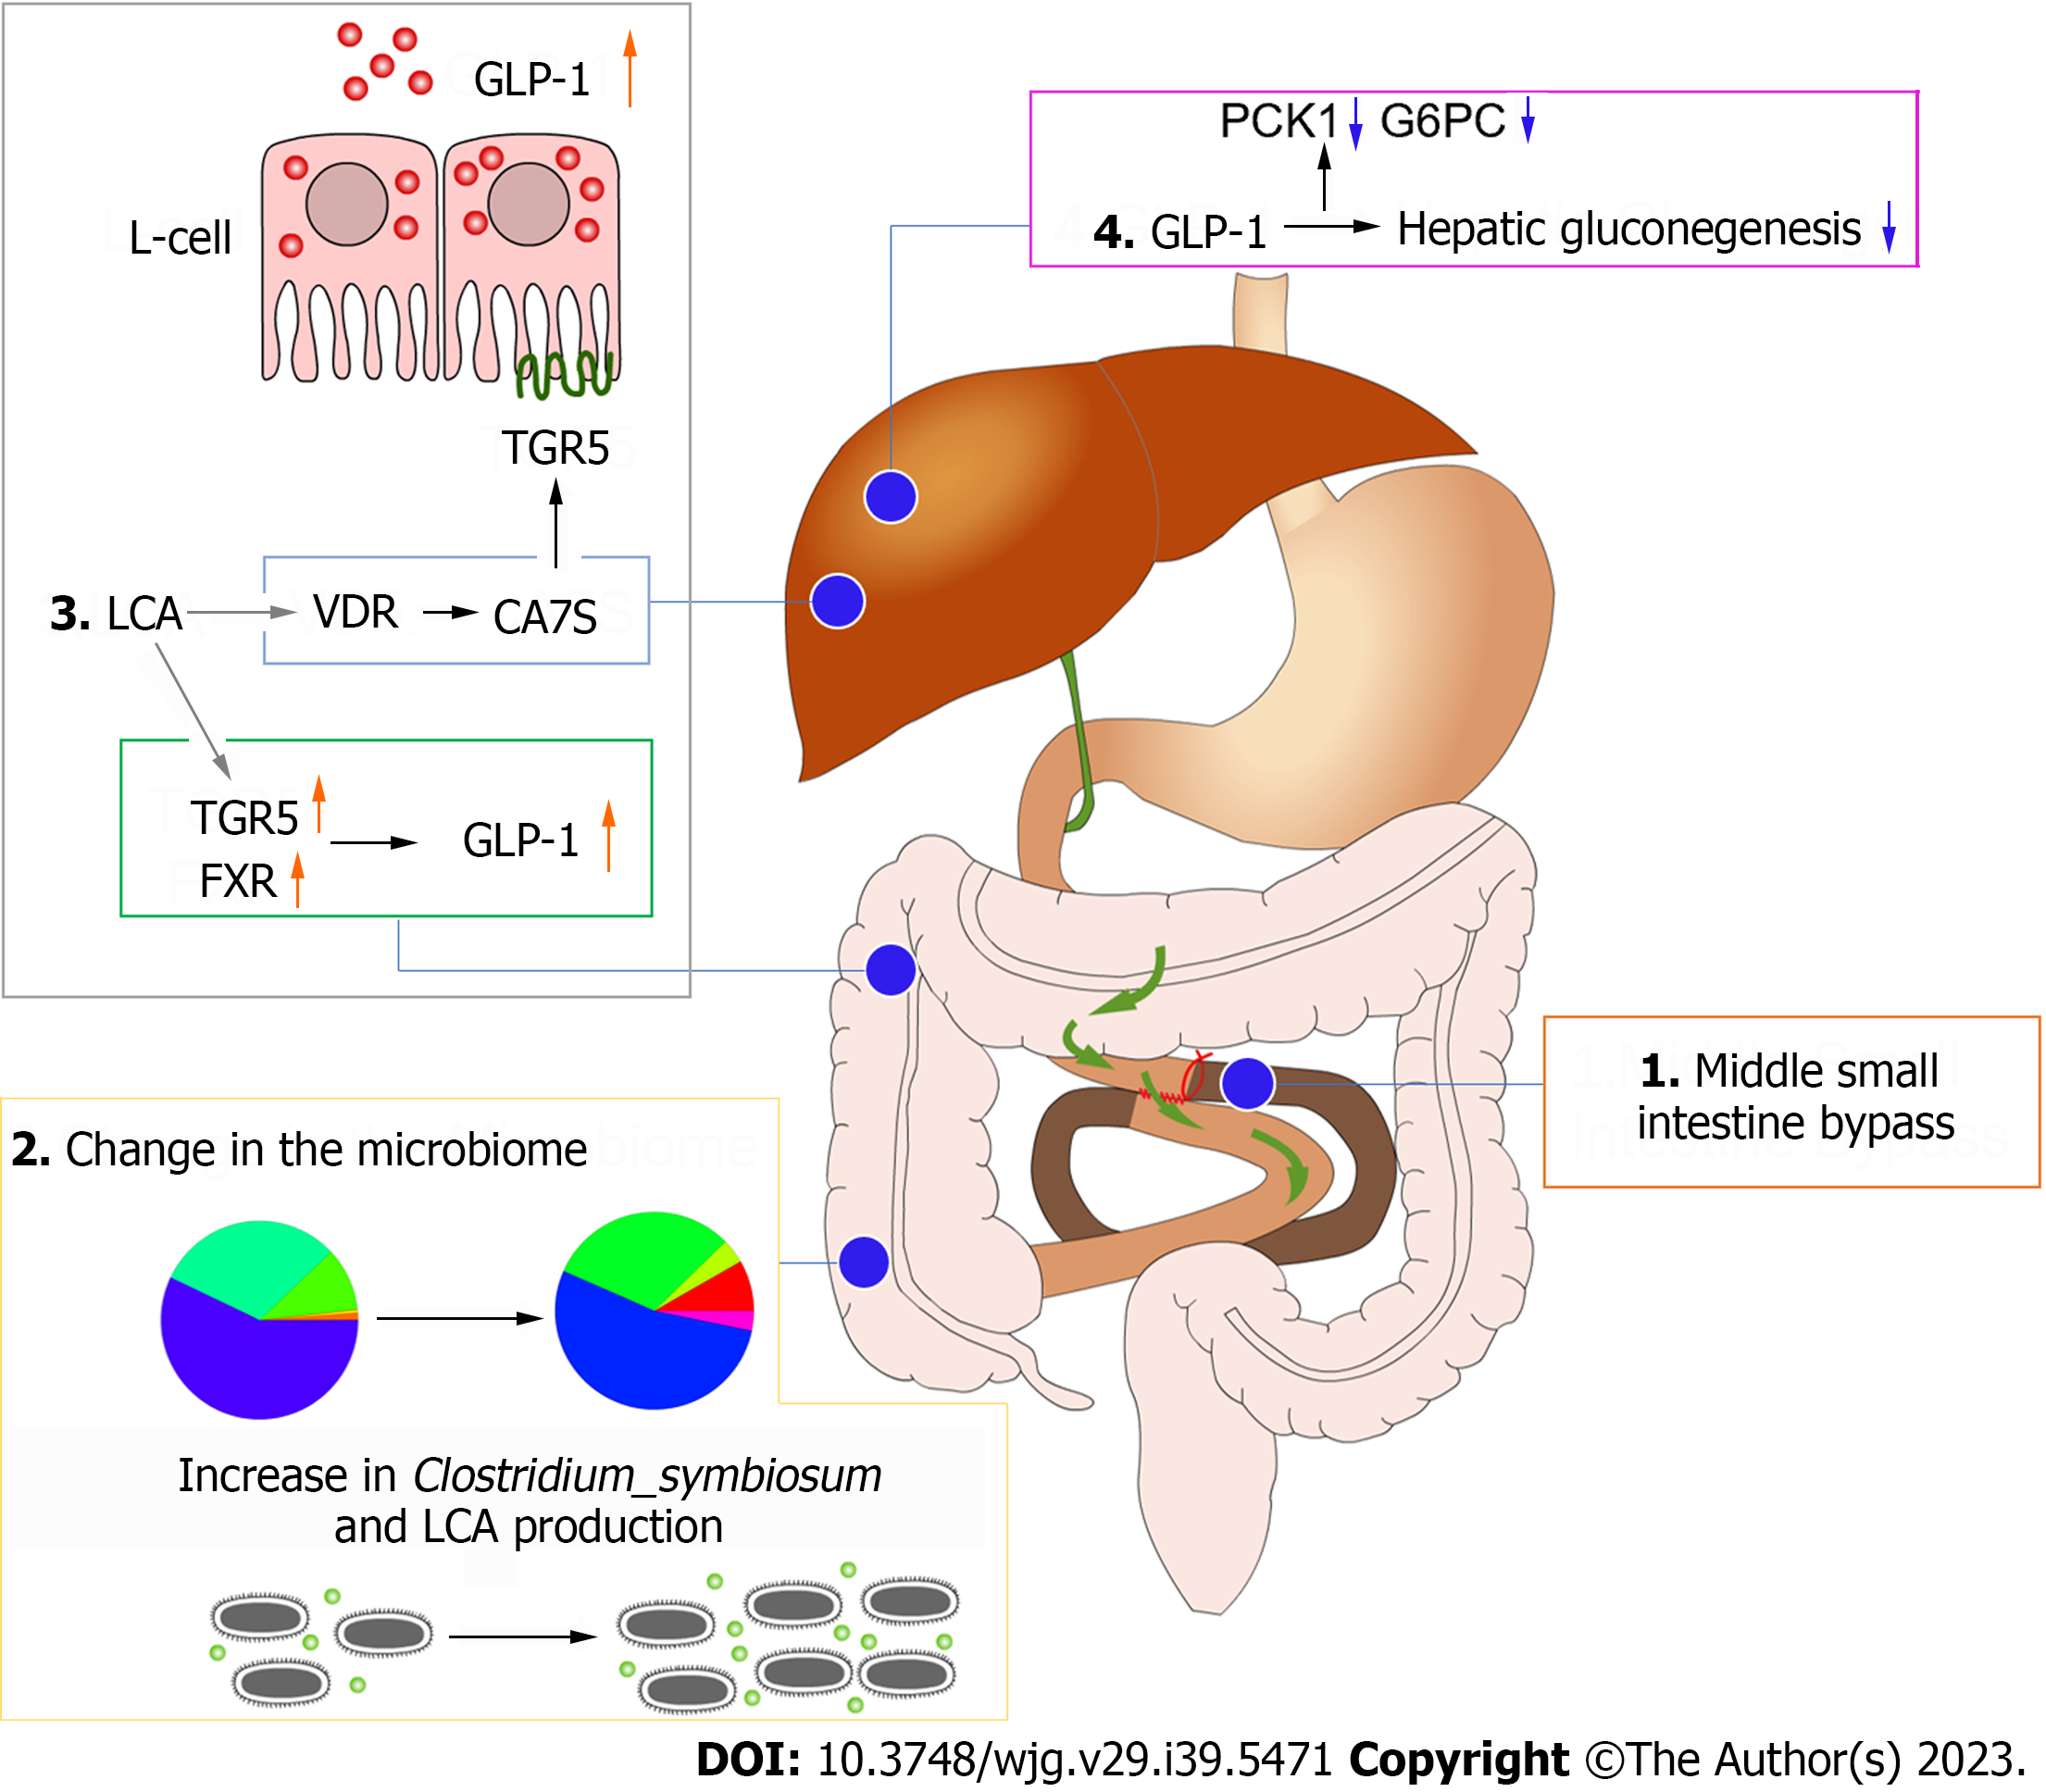
Figure 6 Diagram of the mechanism of improved glucose metabolism after mid-small intestine bypass.
GLP-1: Glucagon-like peptide 1; TGR5: Takeda G protein-coupled receptor 5; FXR: Farnesoid X receptor; LCA: Lithocholic acid; PCK1: Phosphoenolpyruvate carboxykinase 1; G6PC: Glucose-6-phosphatase.
- Citation: Luo X, Tao F, Tan C, Xu CY, Zheng ZH, Pang Q, He XA, Cao JQ, Duan JY. Enhanced glucose homeostasis via Clostridium symbiosum-mediated glucagon-like peptide 1 inhibition of hepatic gluconeogenesis in mid-intestinal bypass surgery. World J Gastroenterol 2023; 29(39): 5471-5482
- URL: https://www.wjgnet.com/1007-9327/full/v29/i39/5471.htm
- DOI: https://dx.doi.org/10.3748/wjg.v29.i39.5471


