Copyright
©The Author(s) 2023.
World J Gastroenterol. Sep 28, 2023; 29(36): 5254-5267
Published online Sep 28, 2023. doi: 10.3748/wjg.v29.i36.5254
Published online Sep 28, 2023. doi: 10.3748/wjg.v29.i36.5254
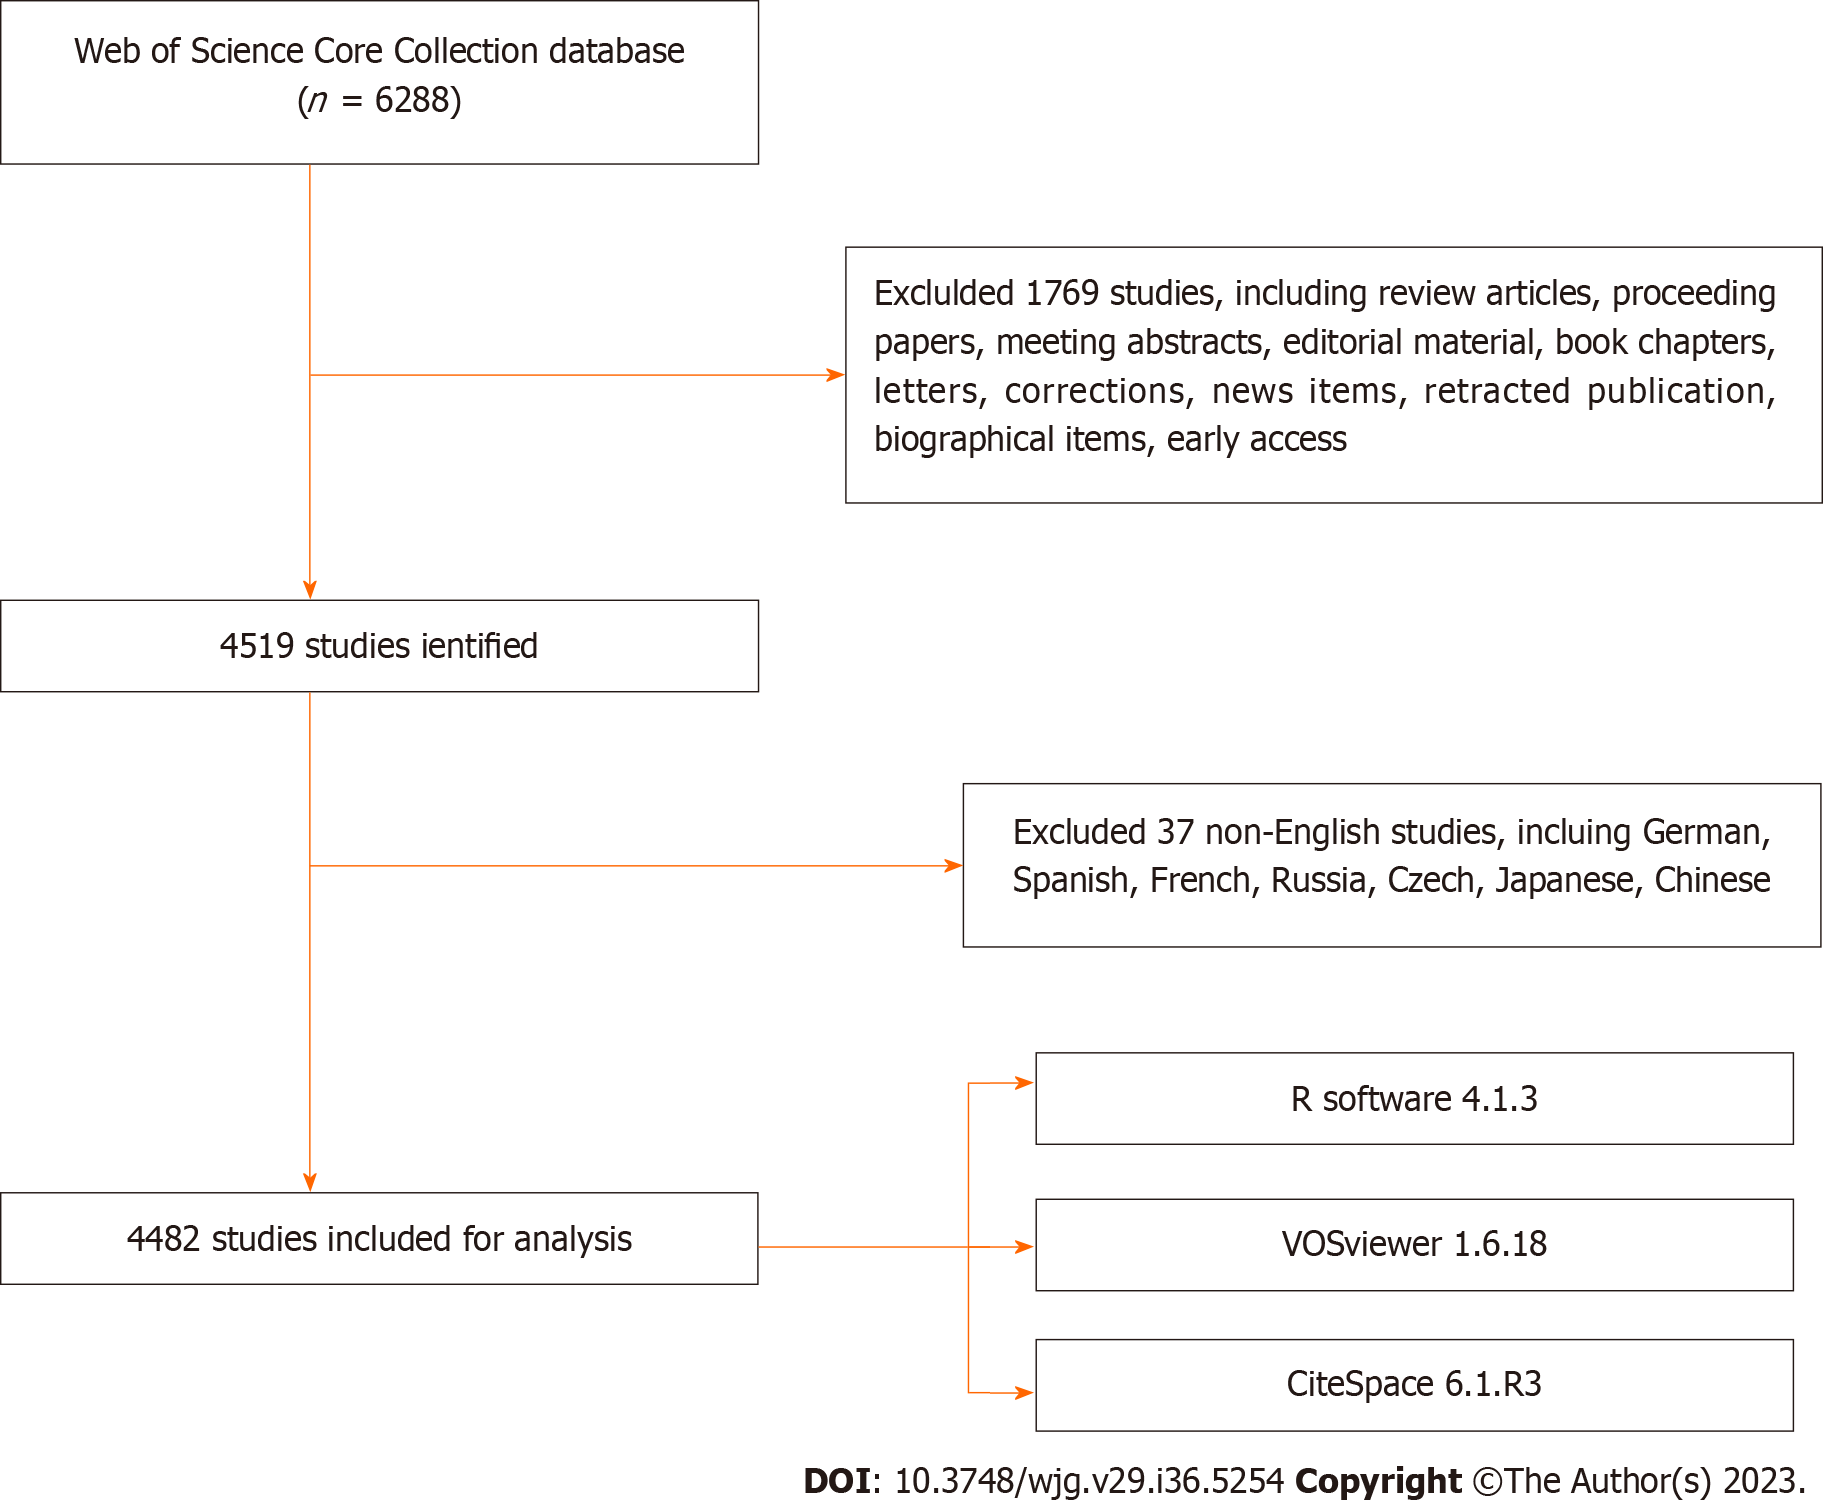
Figure 1 Flowchart of the literature screening.
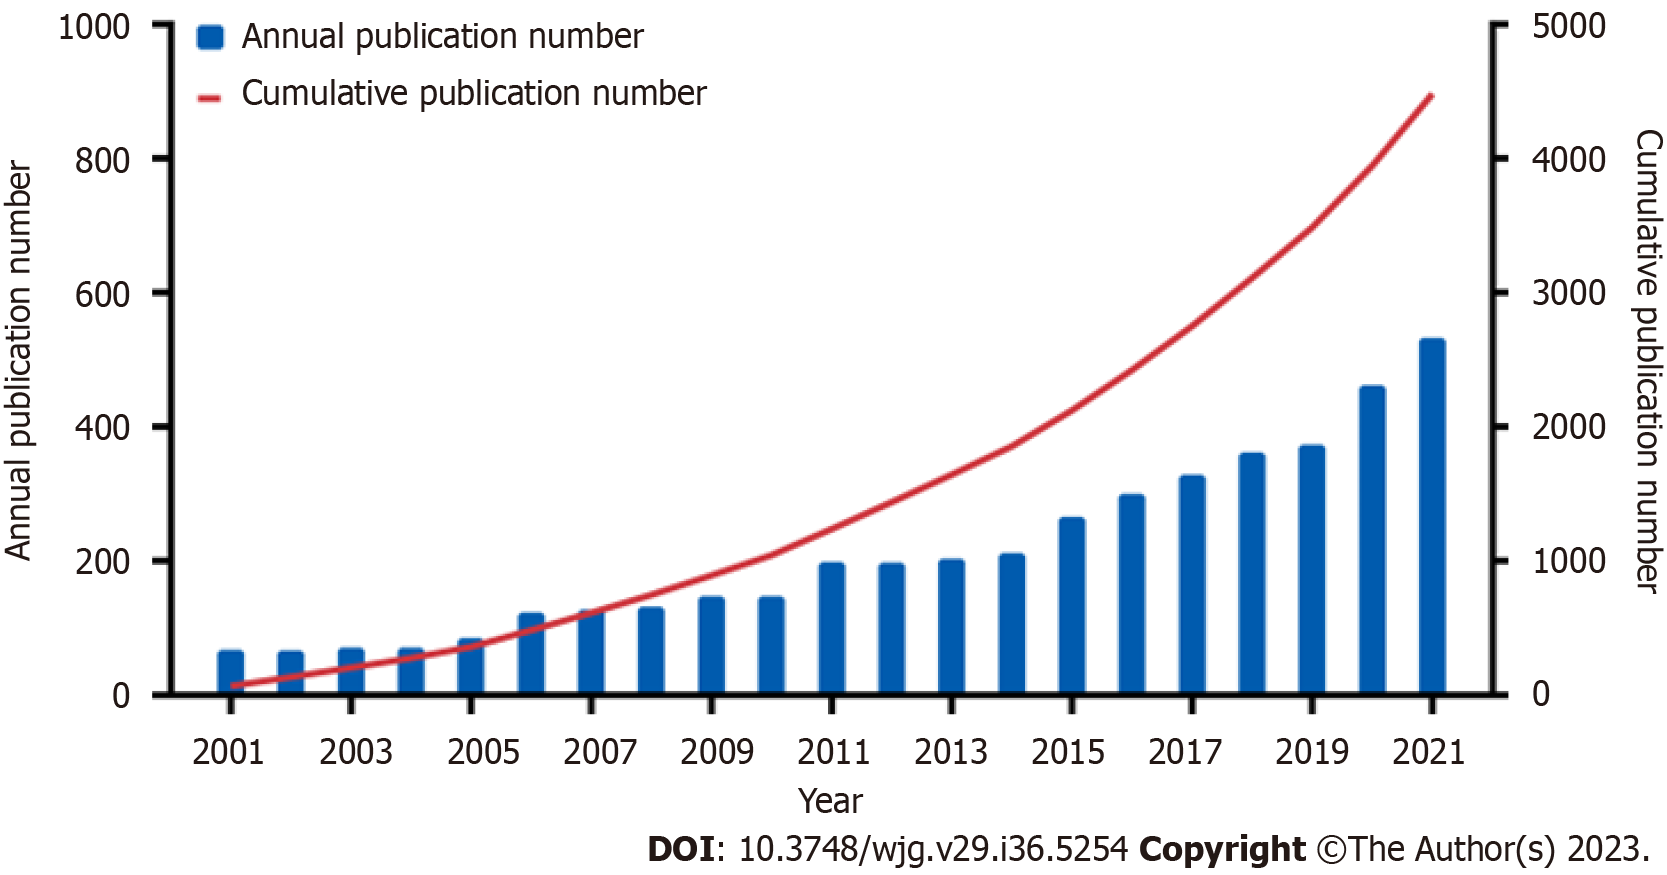
Figure 2 Annual and cumulative growth trends of publications.
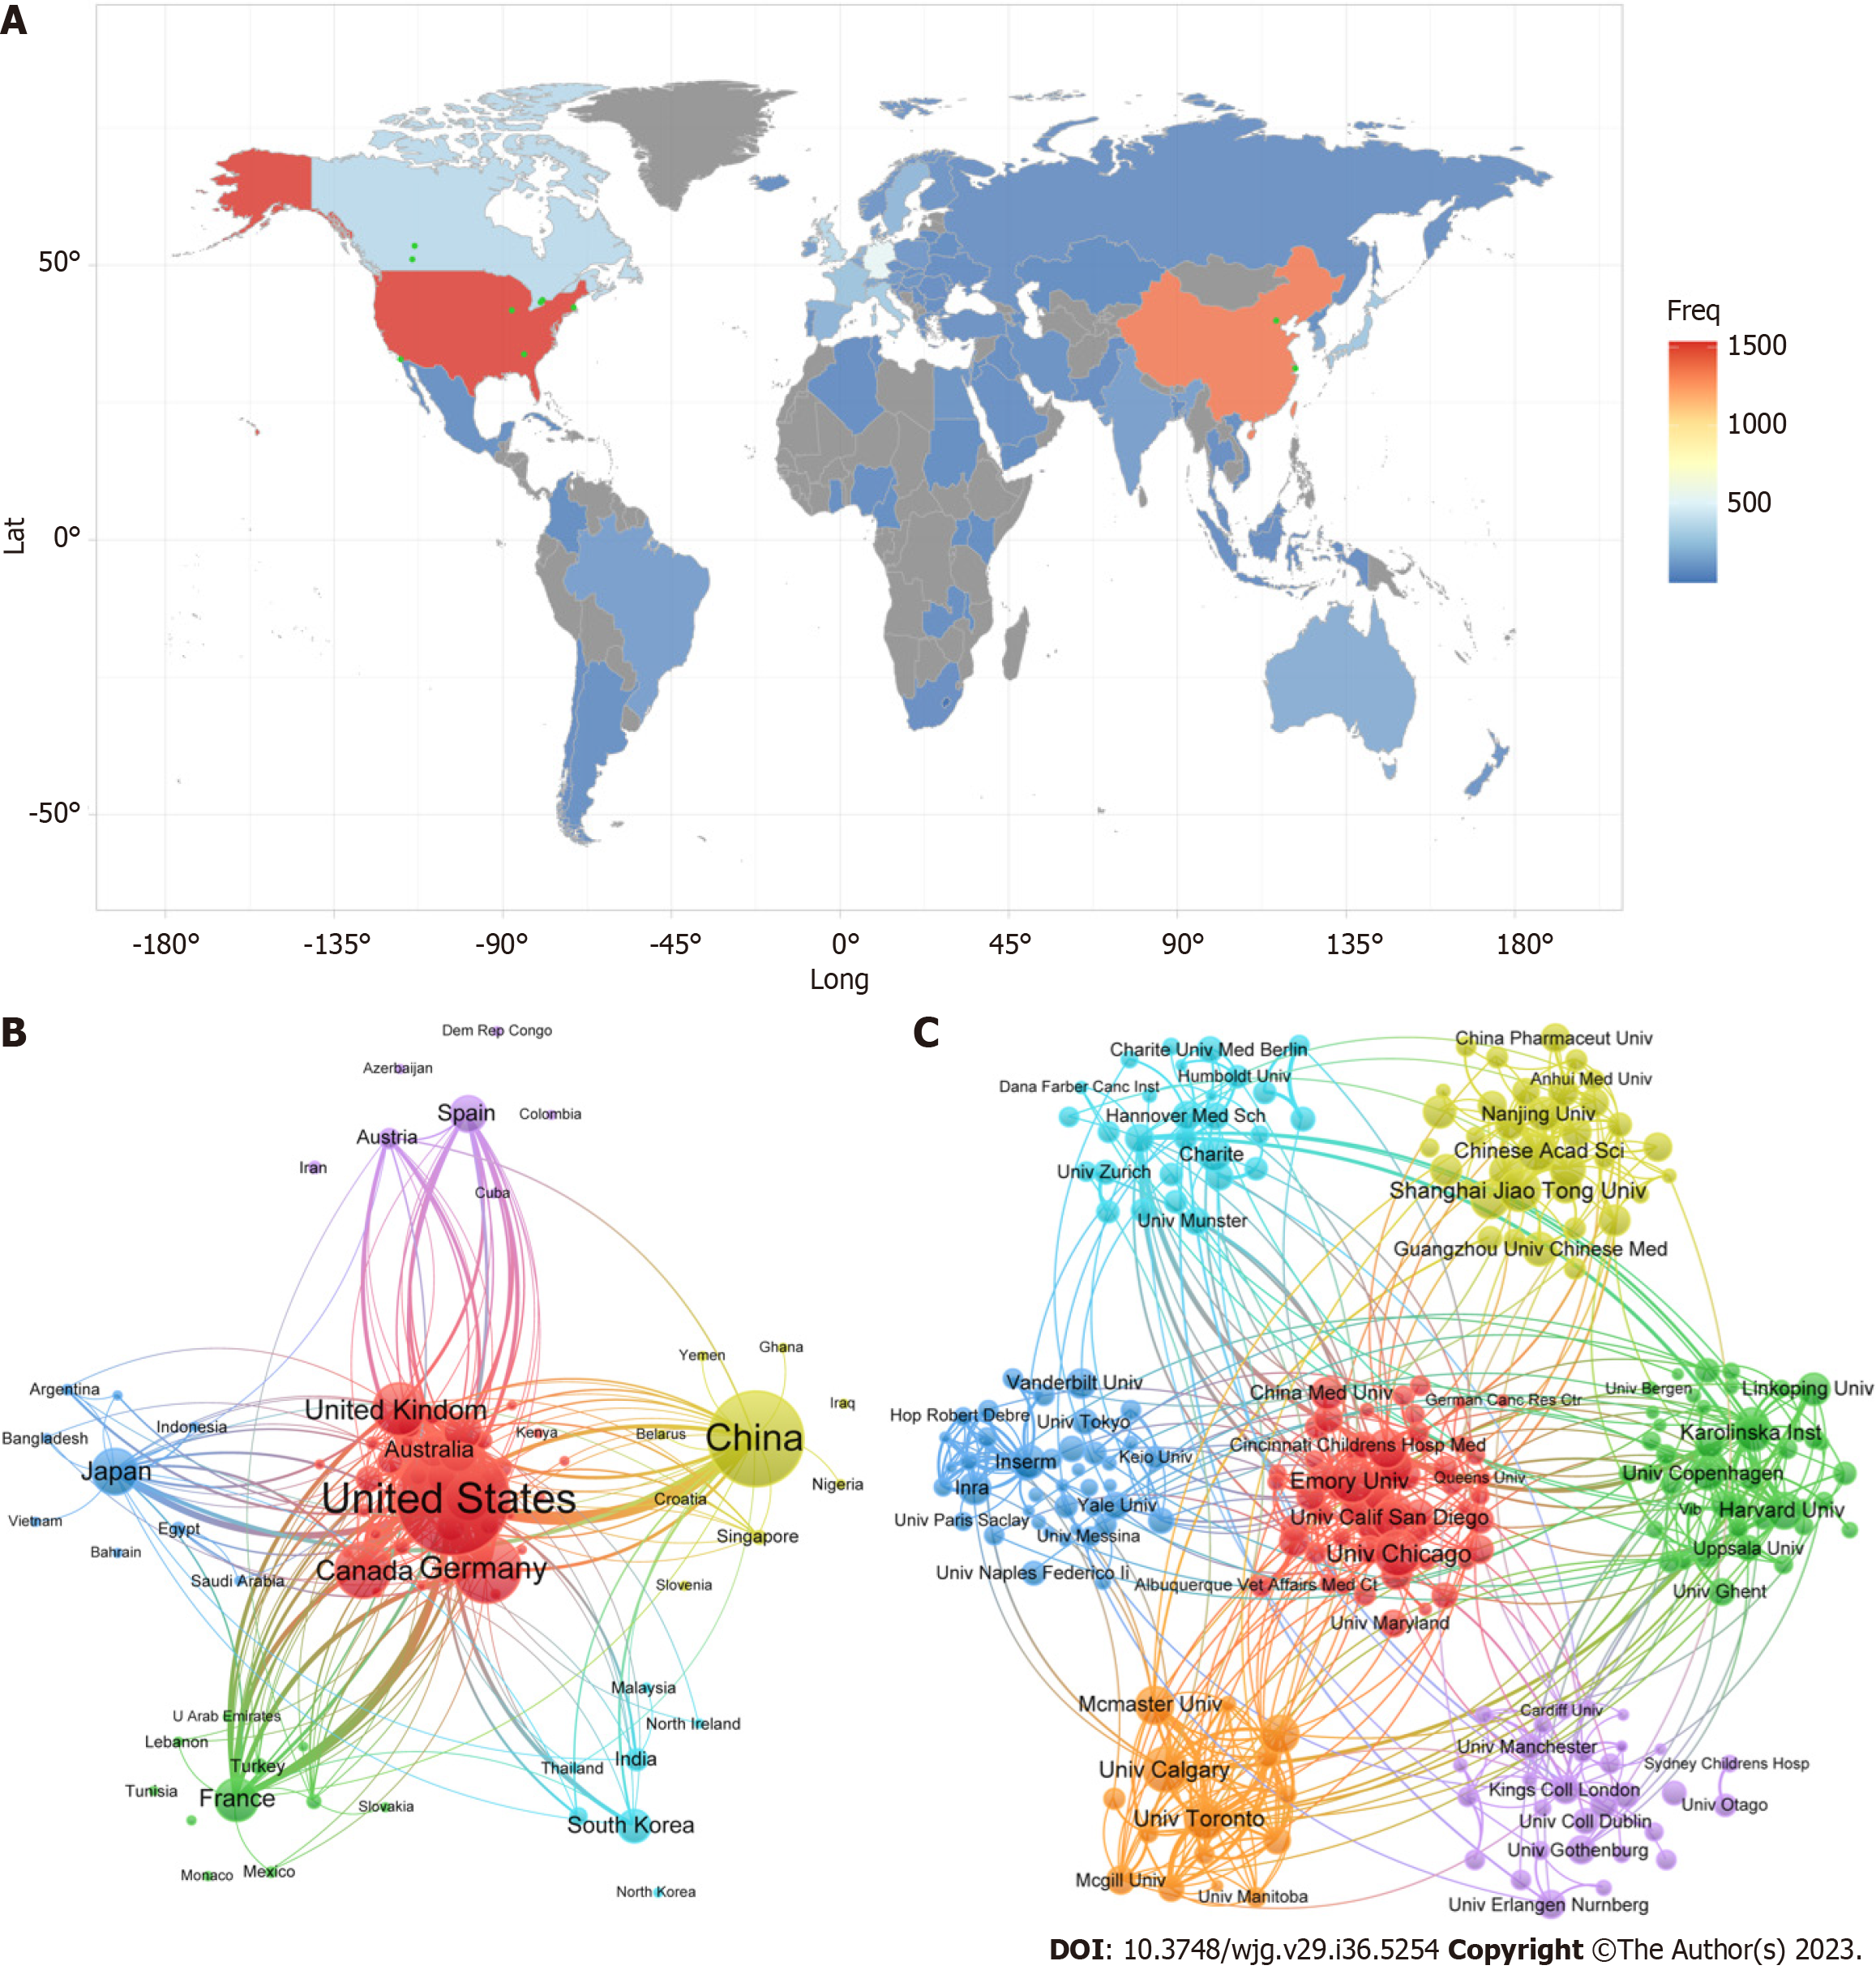
Figure 3 Network visualization map of countries/regions and institutions.
A: Geographic distribution map based on the total publications; B: Cooperation map of countries/regions; C: Cooperation map of institutions. The nodes in the network map represent countries/regions, and the node size is proportional to the number of publications. The thickness of the connecting line between nodes indicates the strength of the co-authorship relationships.
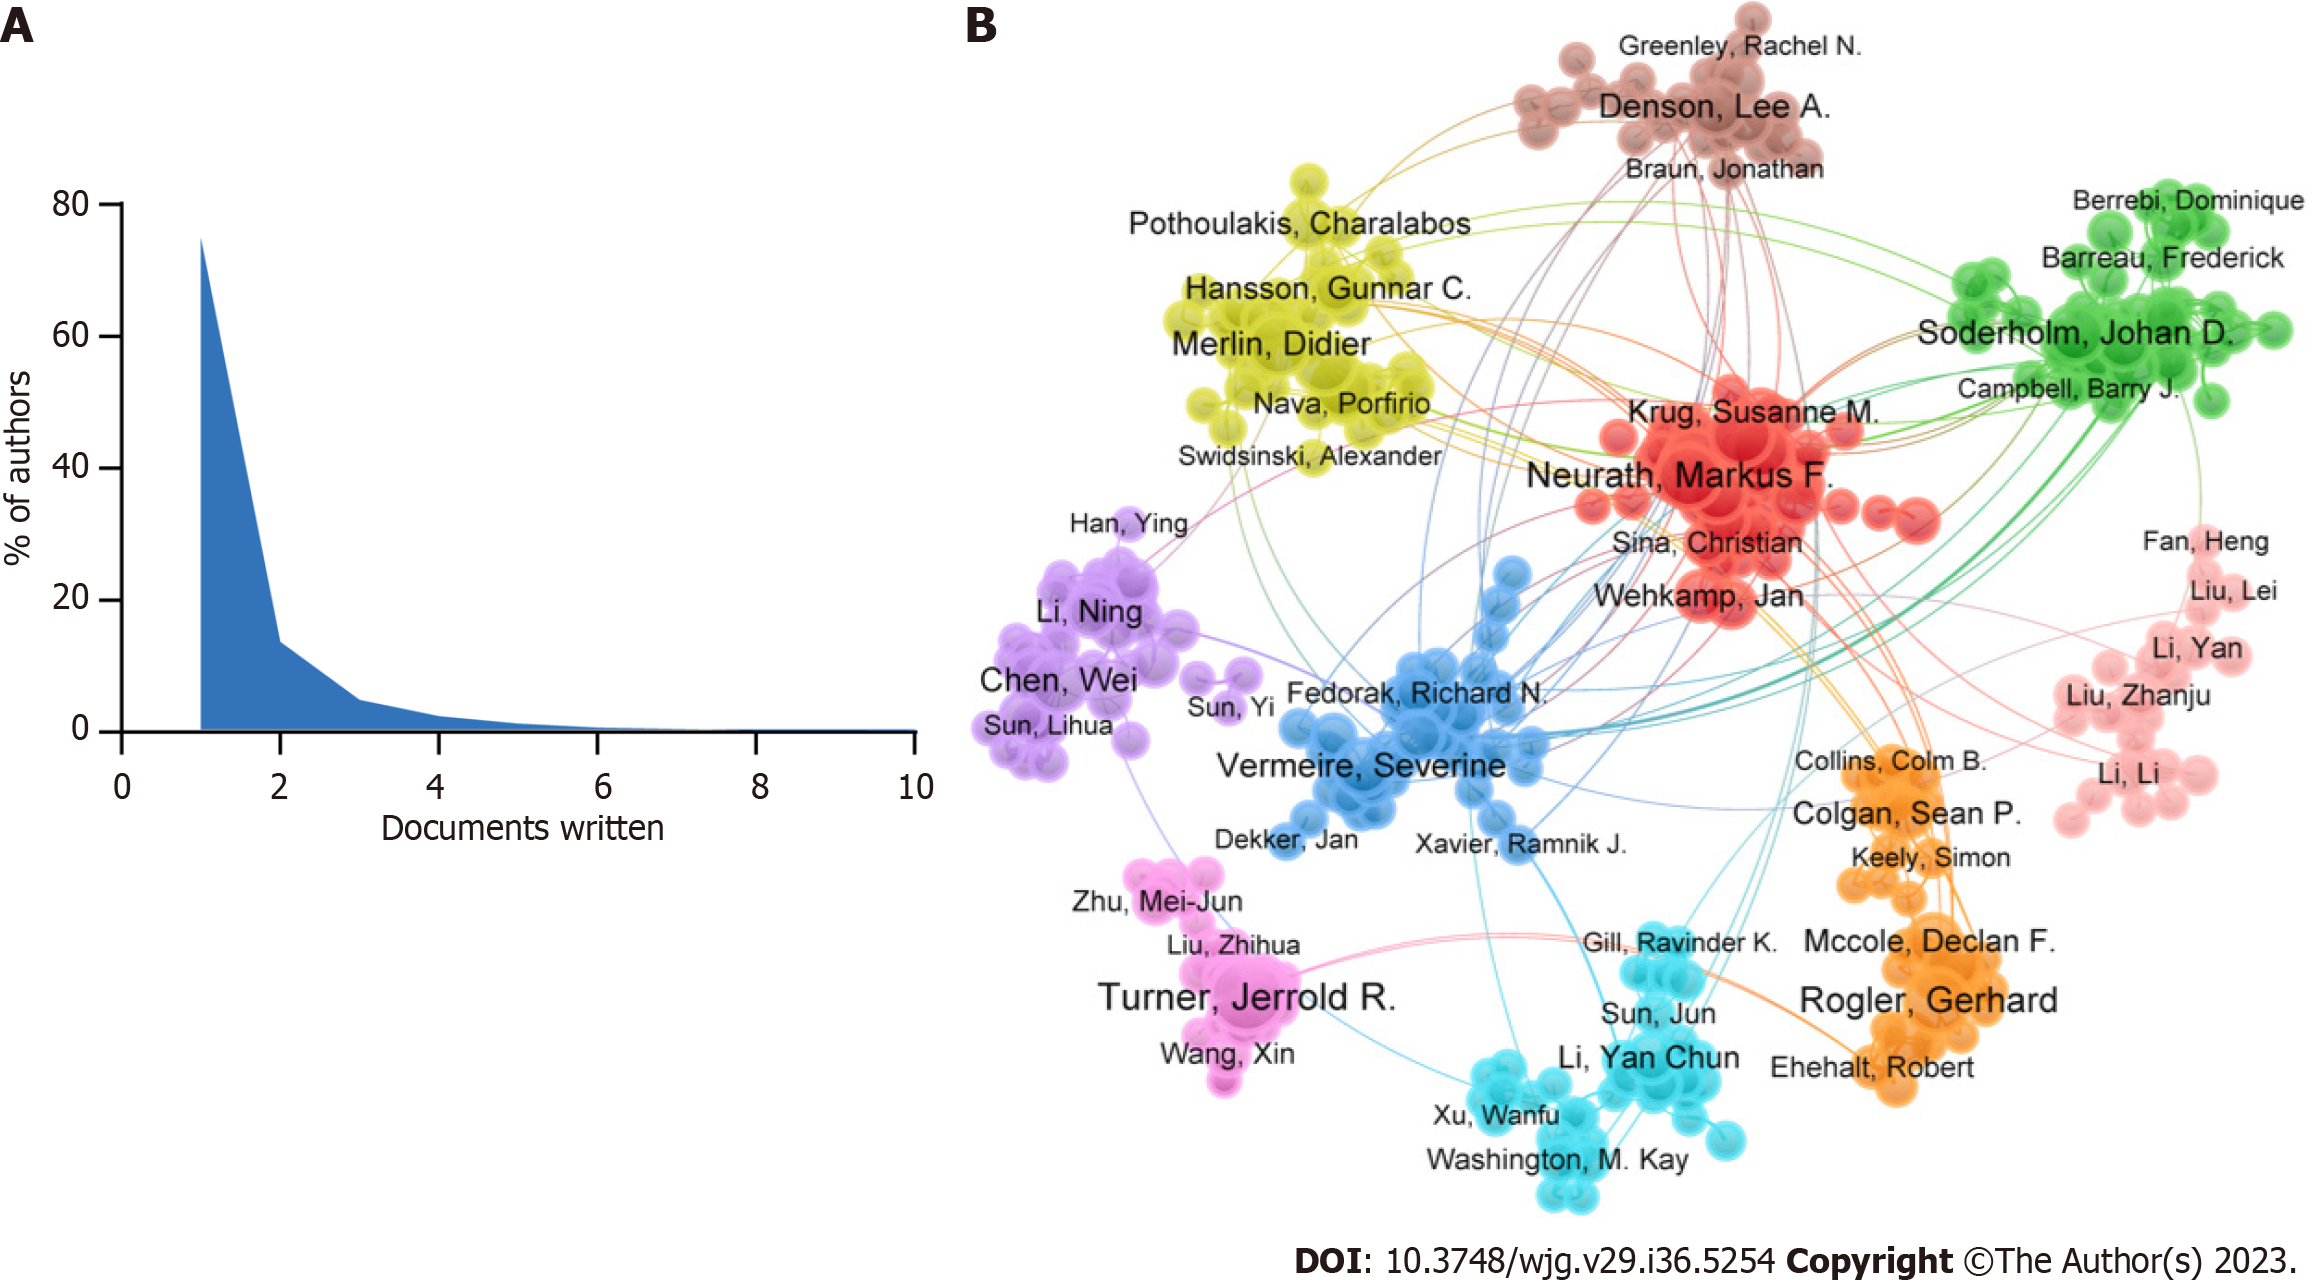
Figure 4 Network visualization map of authors.
A: Scientific productivity of authors based on Lotka’s Law; B: Cooperation map of authors. Each node represents a different author, and the connections between the nodes reflect the co-authorship relationships.
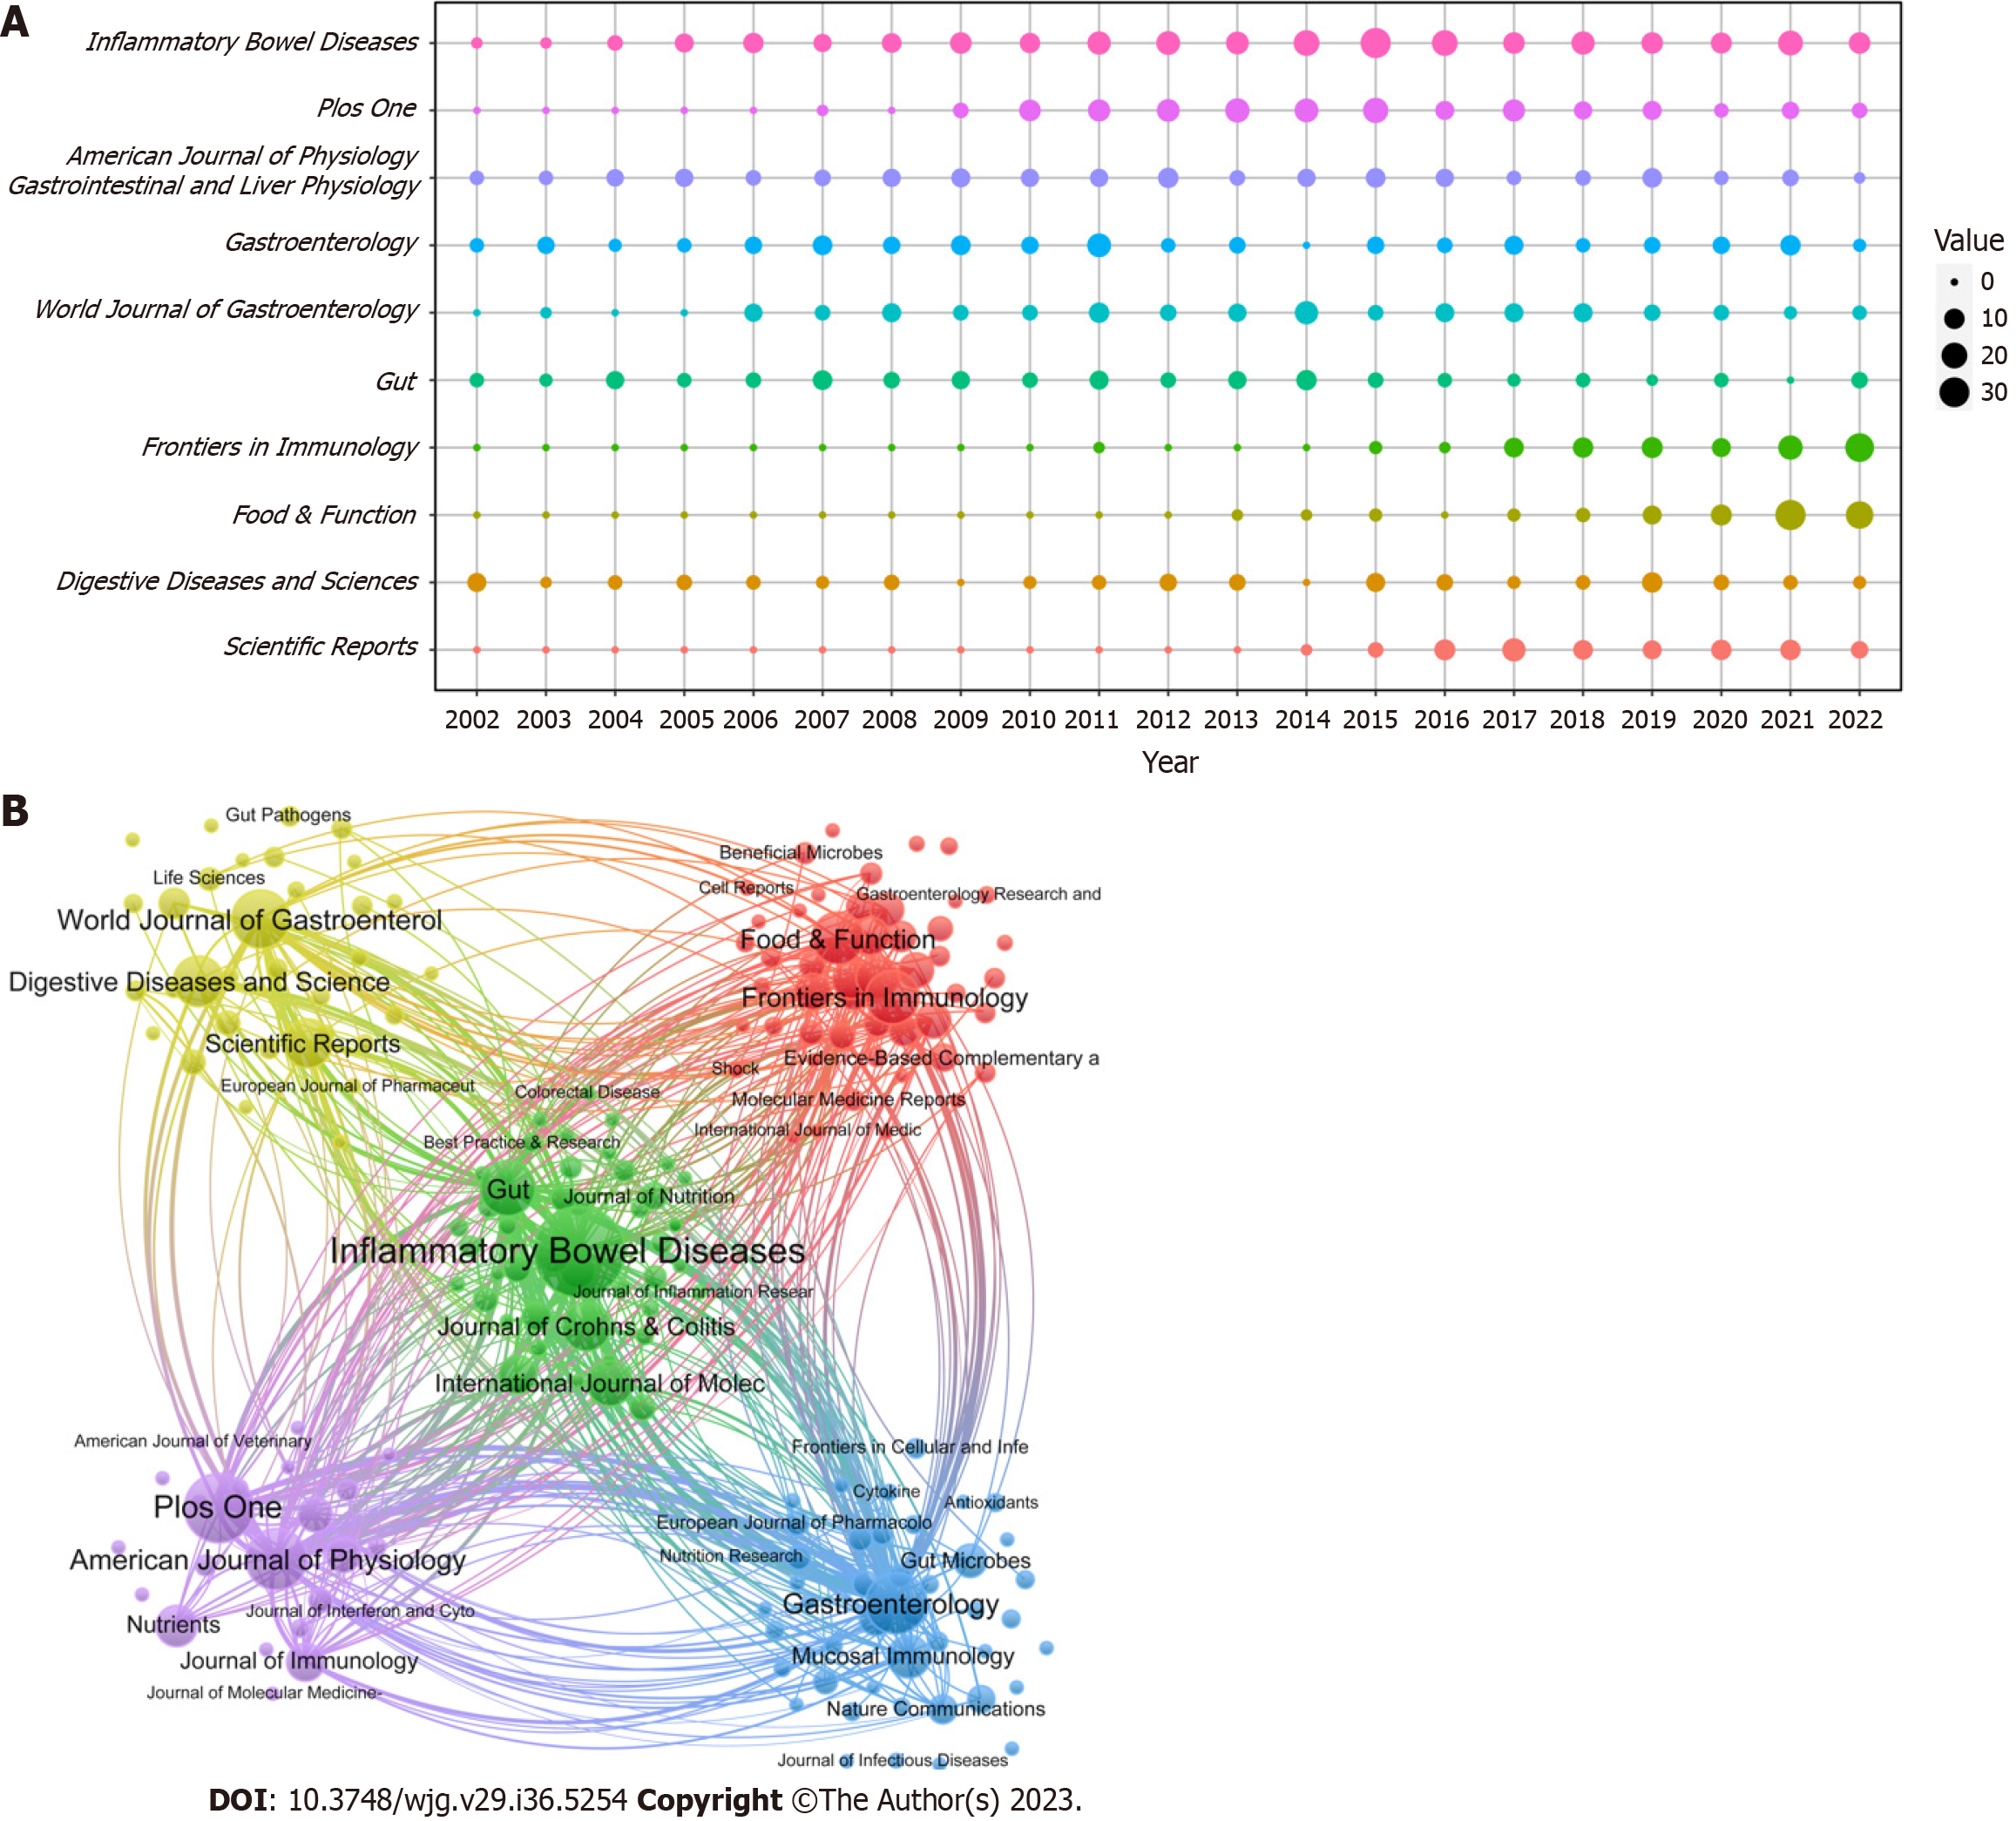
Figure 5 Network visualization map of authors.
A: Annual number of publications for the top 10 journals; B: Cooperation map of Journals. The nodes in the graph represented journals, and the connections between the nodes reflect the co-authorship relationships.
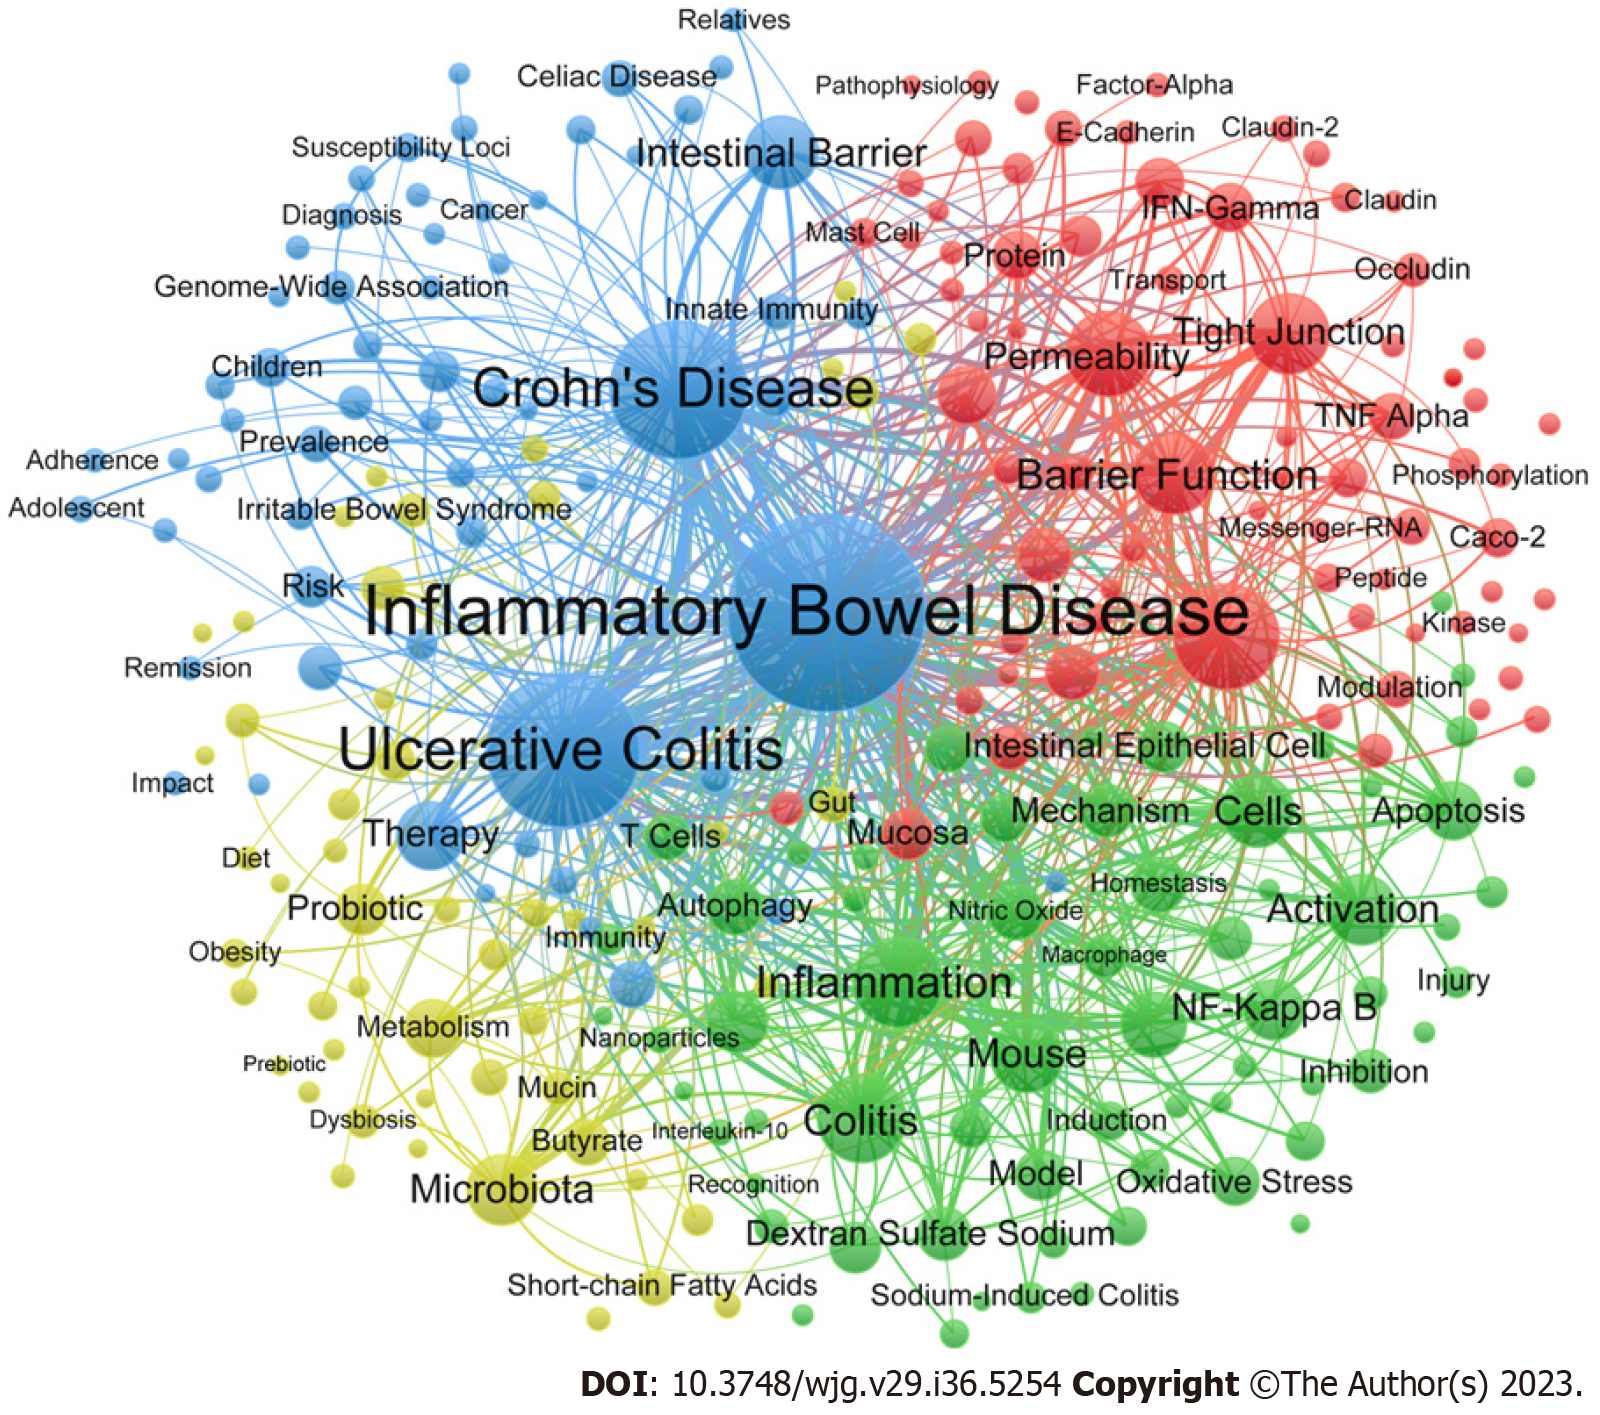
Figure 6 The network map of keywords in the intestinal barrier field relevant to inflammatory bowel disease.
The network map displays the size of nodes based on the number of publications, and the connection represents the co-occurrence relationships between nodes. Closely related nodes were divided into clusters of the same color.
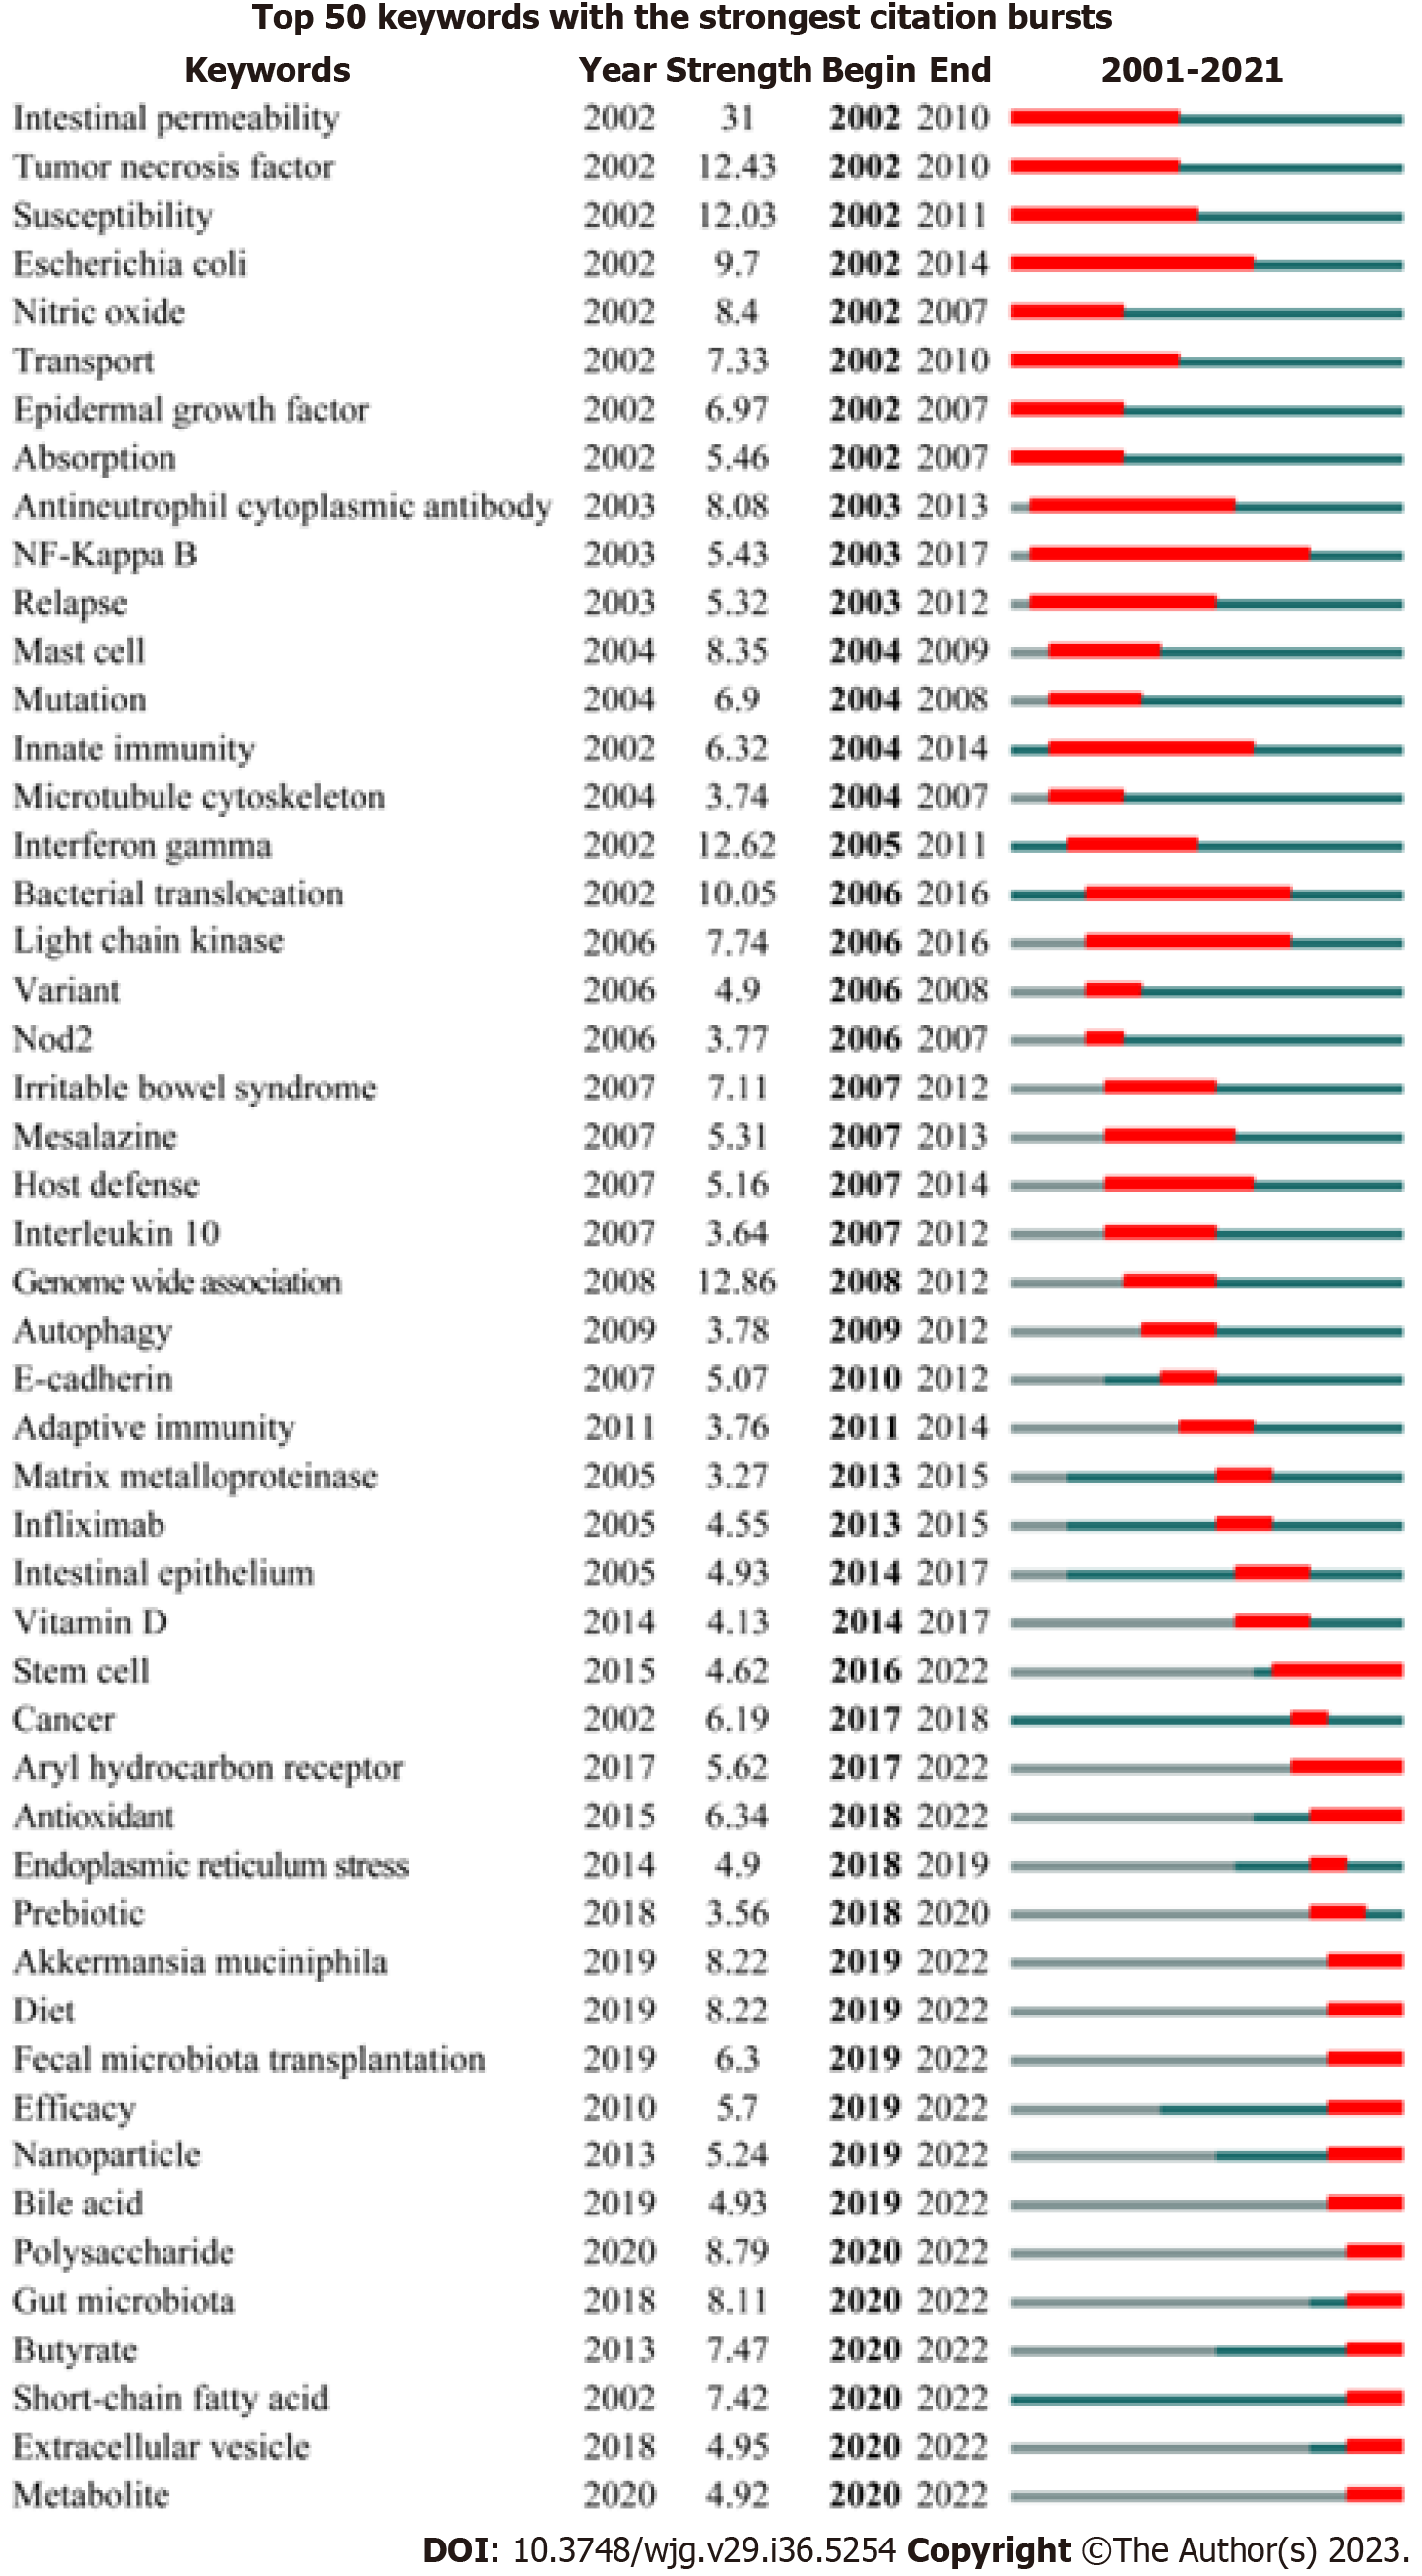
Figure 7 The top 50 keywords with the strongest citation bursts in the intestinal barrier field relevant to inflammatory bowel disease.
The green line indicates the occurrence and development of keywords, while the red line represents the duration of the burst.
- Citation: Zhou F, Wu NZ, Xie Y, Zhou XJ. Intestinal barrier in inflammatory bowel disease: A bibliometric and knowledge-map analysis. World J Gastroenterol 2023; 29(36): 5254-5267
- URL: https://www.wjgnet.com/1007-9327/full/v29/i36/5254.htm
- DOI: https://dx.doi.org/10.3748/wjg.v29.i36.5254


