Copyright
©The Author(s) 2023.
World J Gastroenterol. Sep 14, 2023; 29(34): 5054-5074
Published online Sep 14, 2023. doi: 10.3748/wjg.v29.i34.5054
Published online Sep 14, 2023. doi: 10.3748/wjg.v29.i34.5054
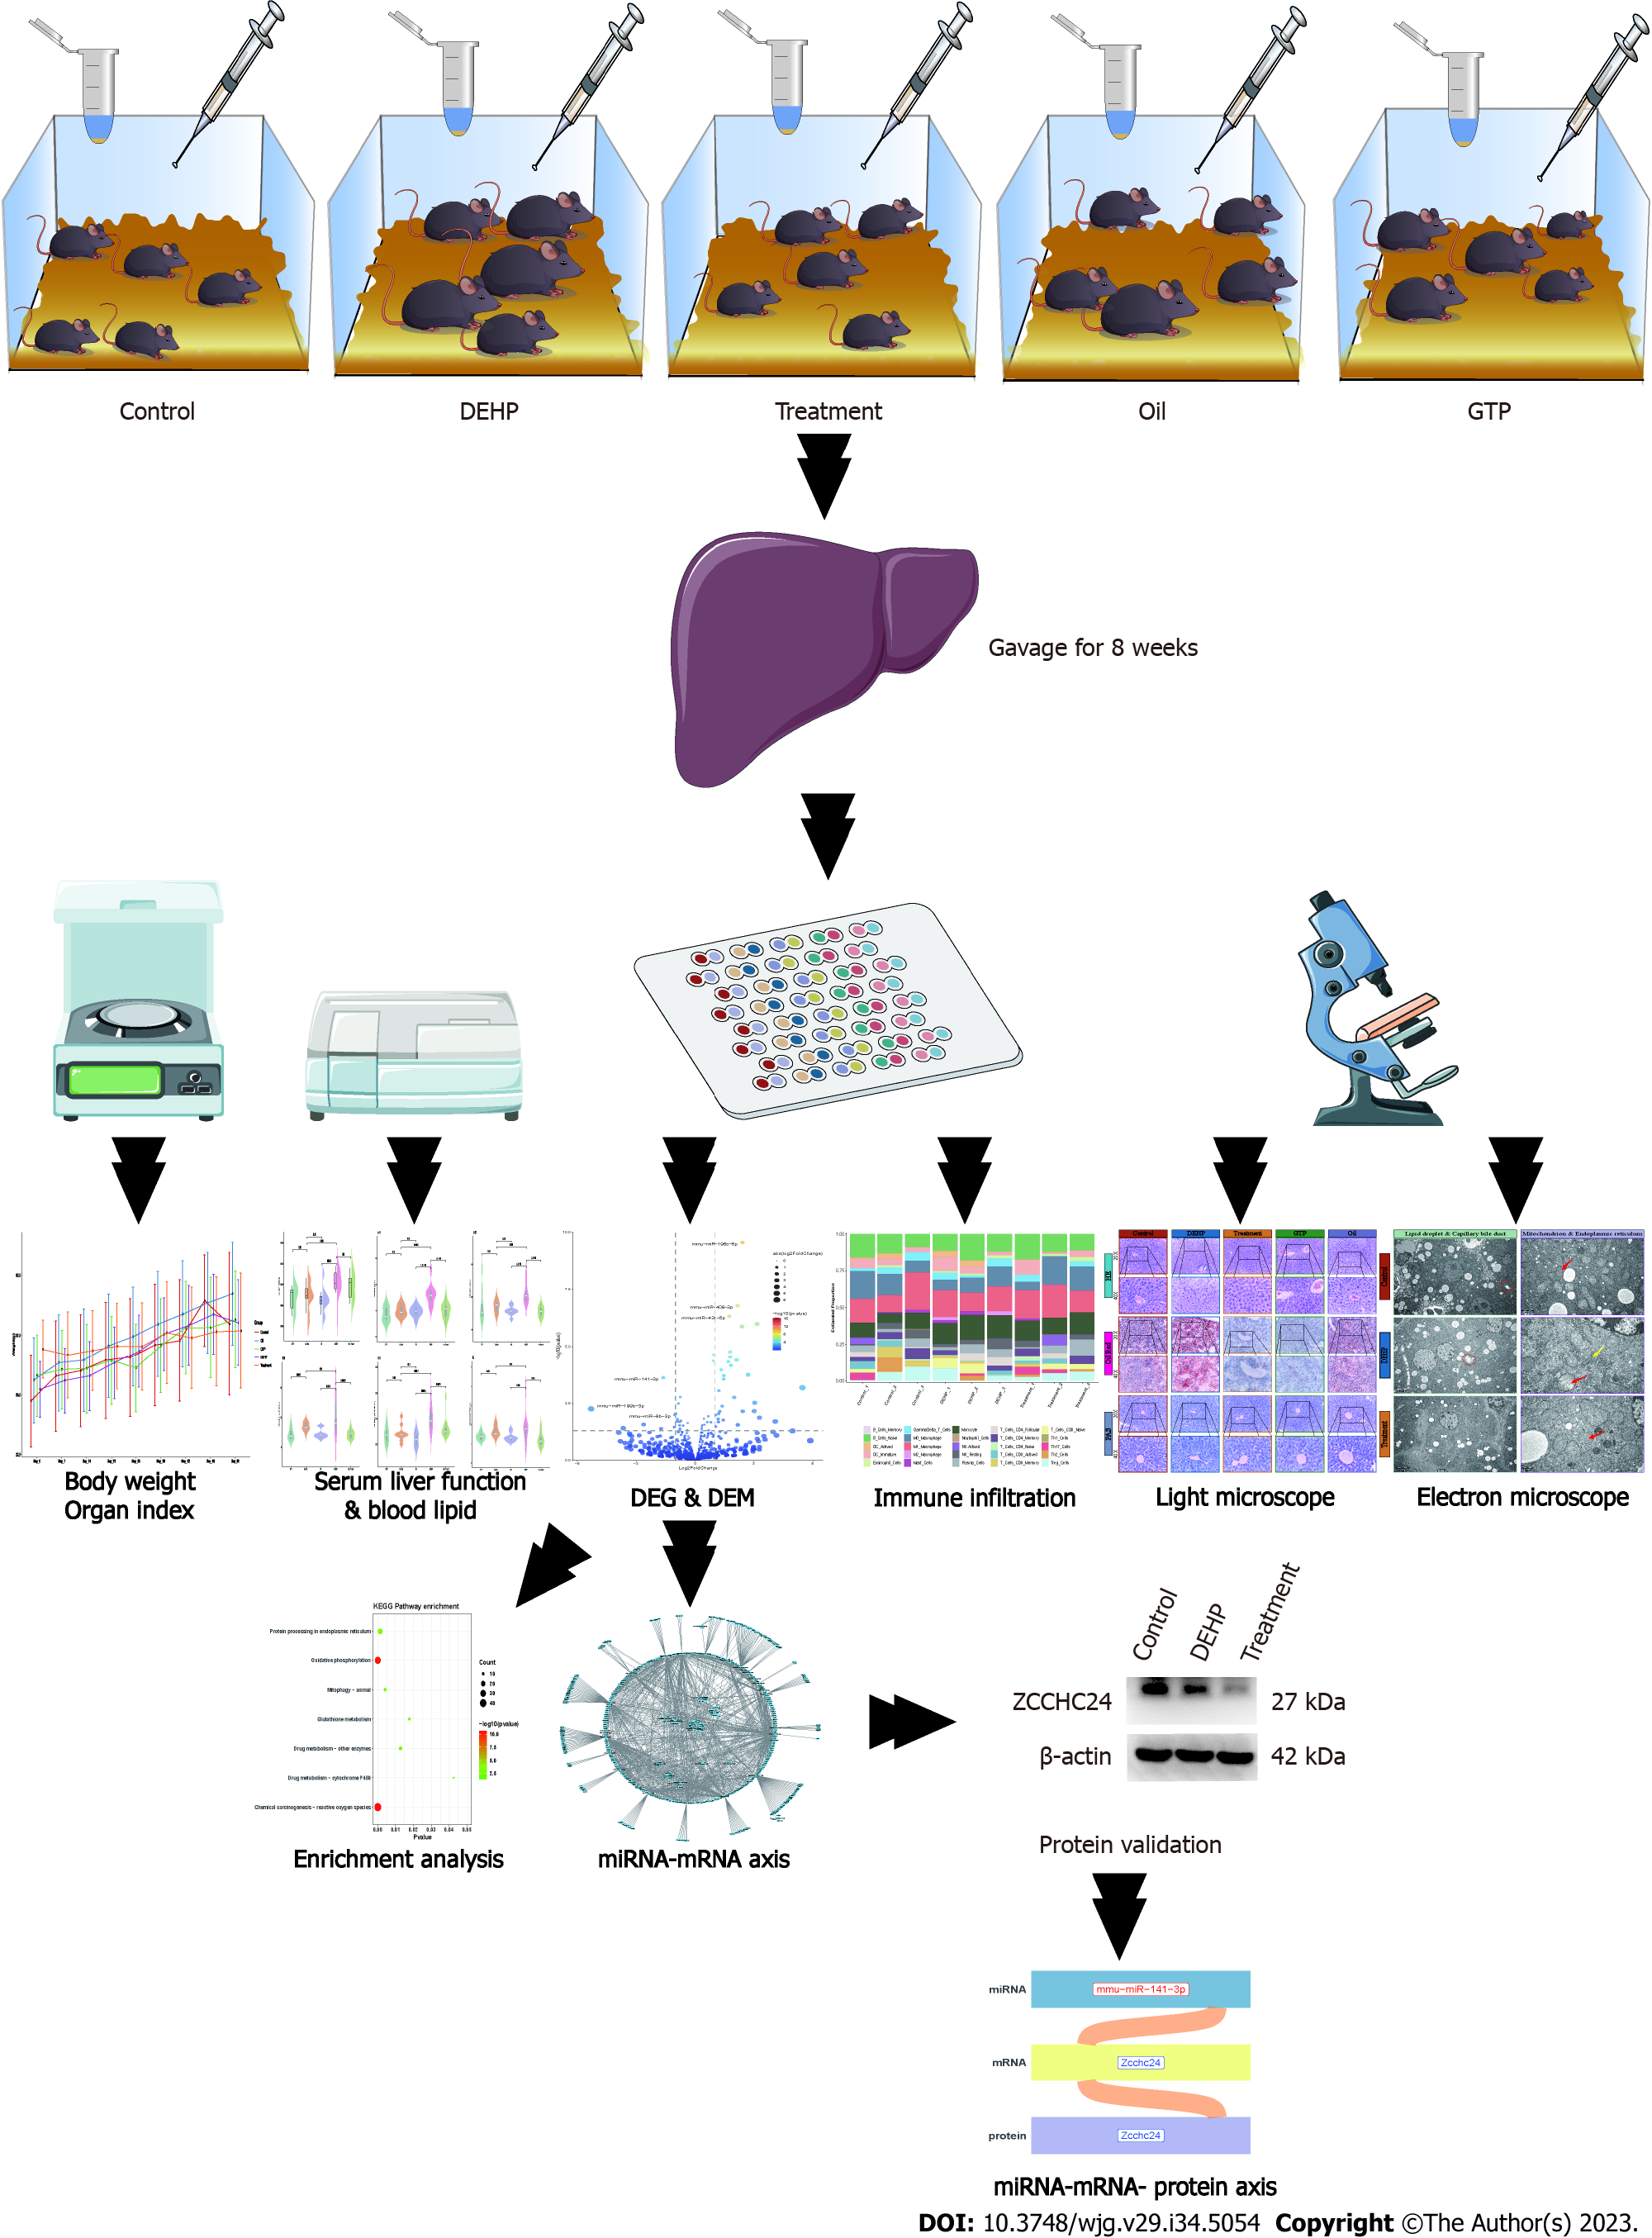
Figure 1 Flowchart of the study.
DEG: Differentially expressed gene; DEM: Differentially expressed microRNA (miRNA).
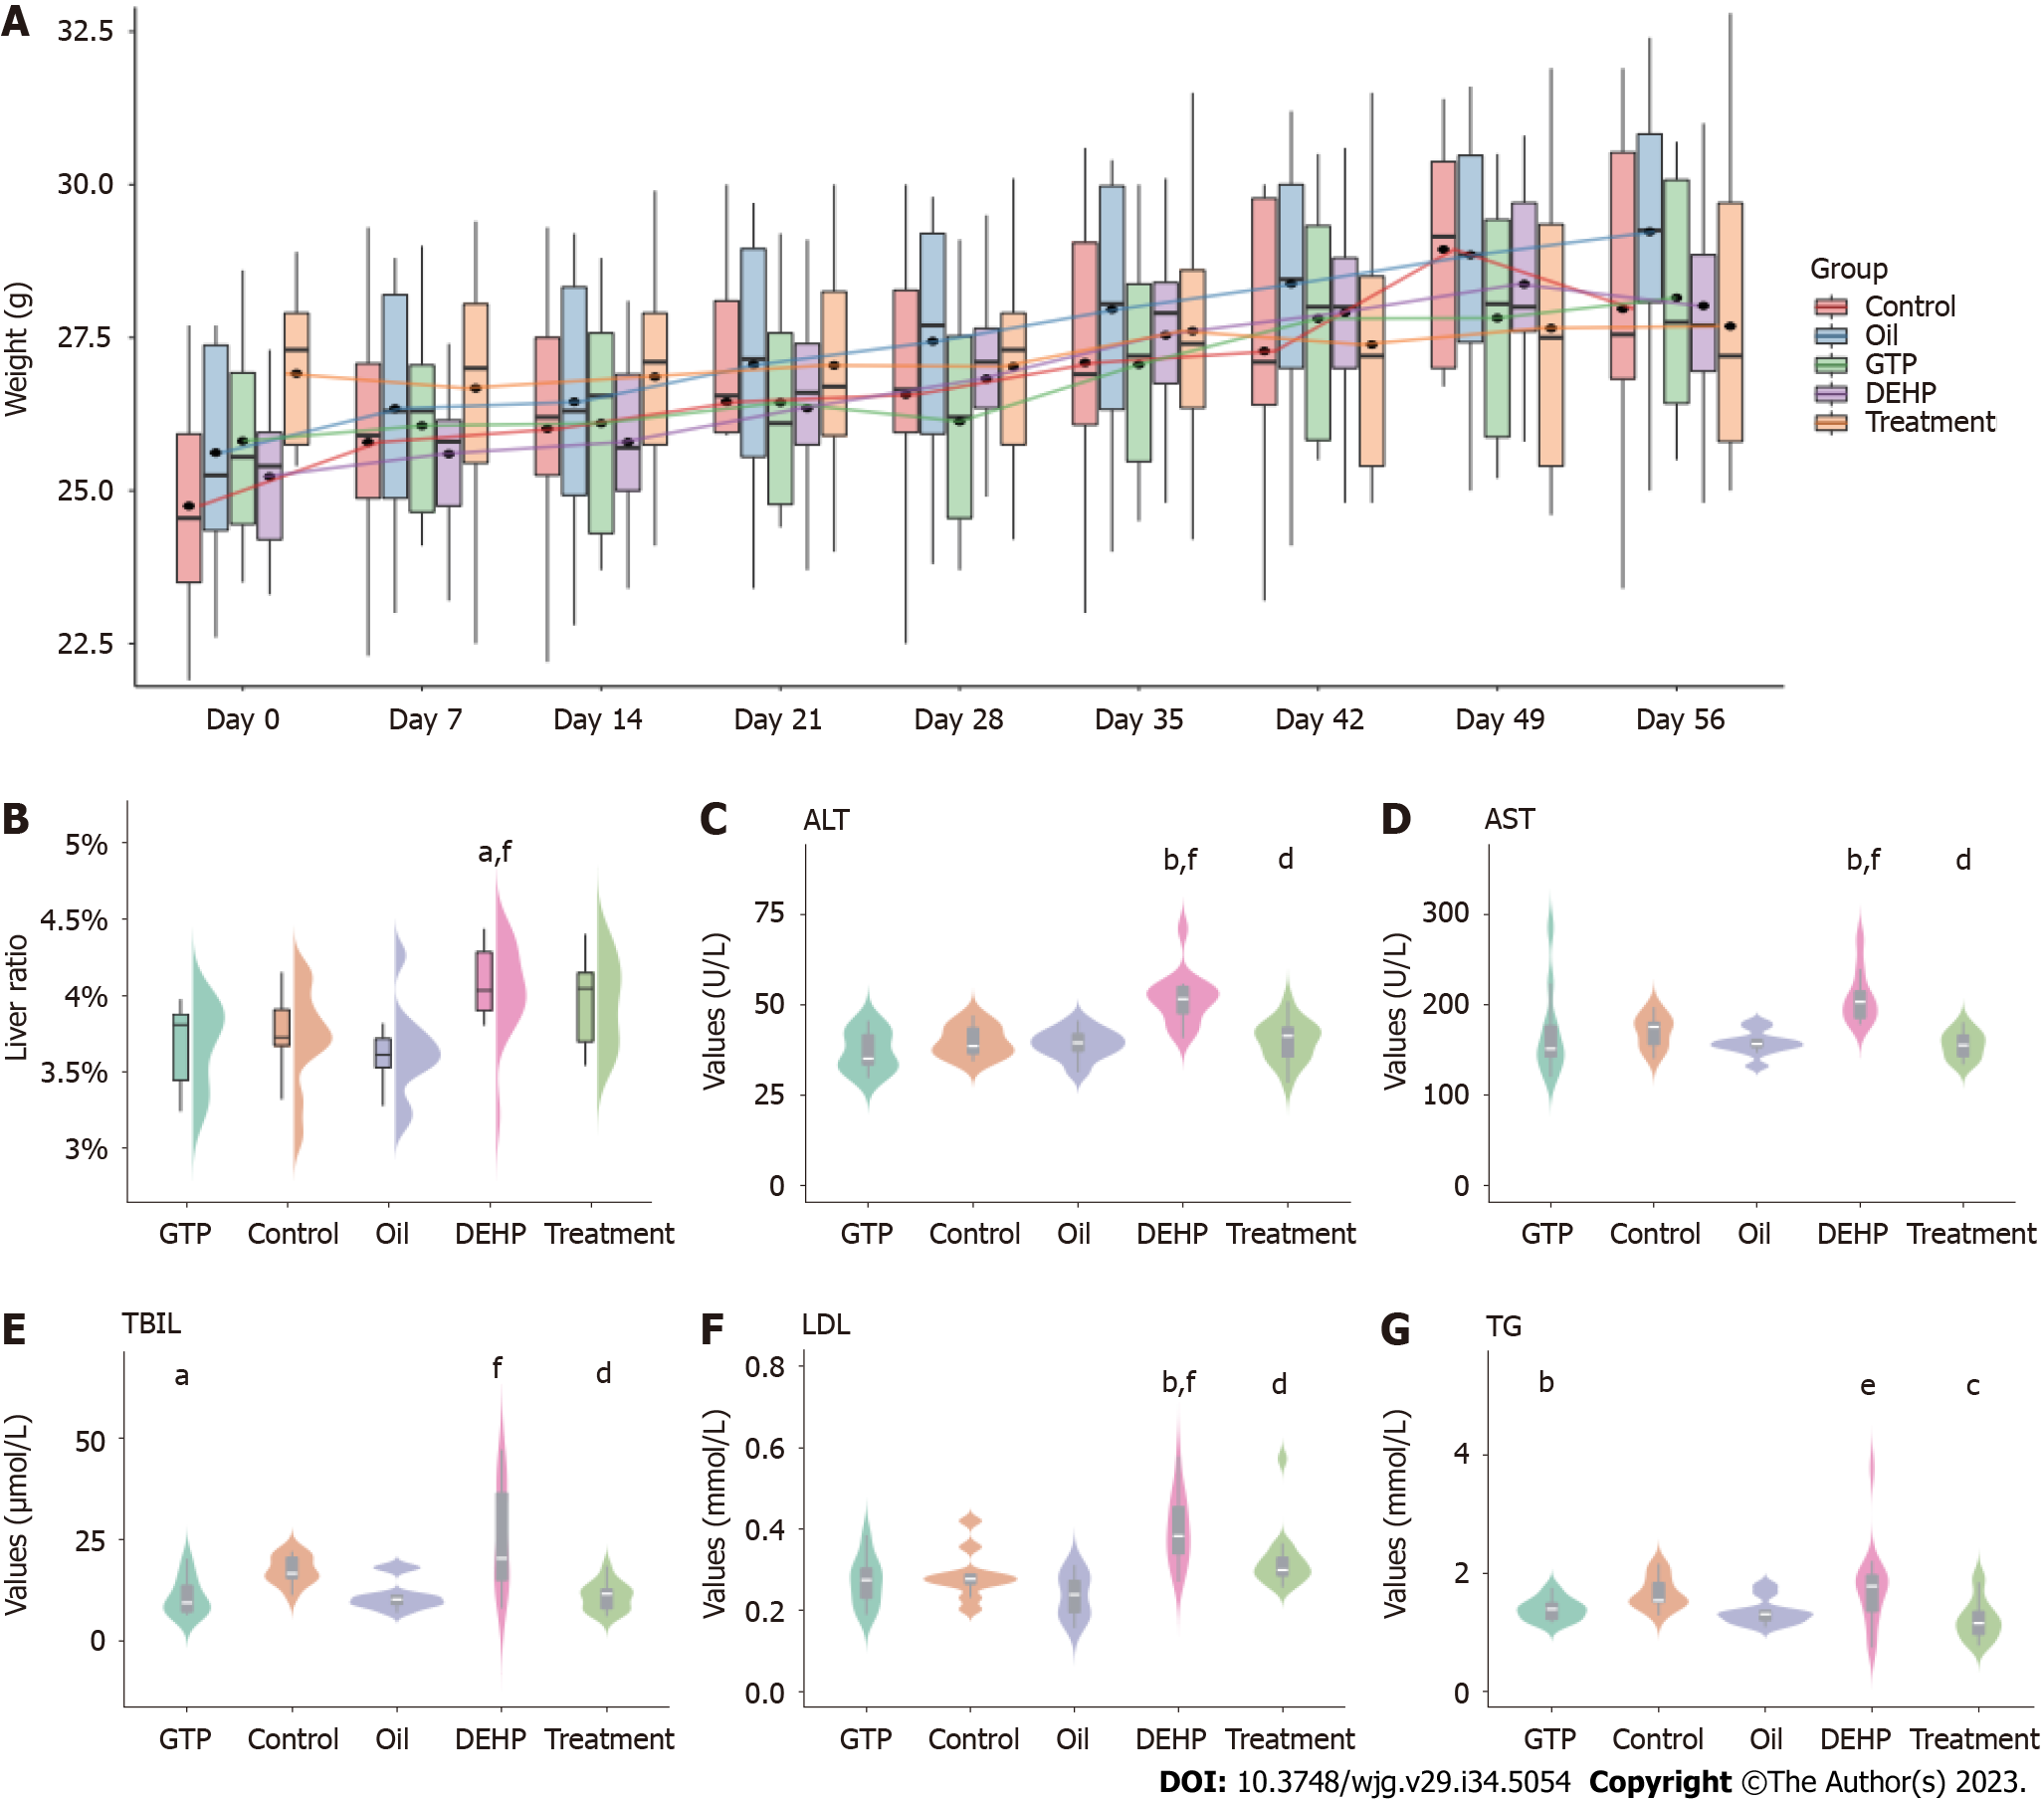
Figure 2 Mouse bodyweight and liver index and serum levels of liver function markers and lipids.
A: Bodyweight changes in different groups within 8 wk; B-G: Comparative analysis of organ indices (B) and serum levels of alanine aminotransferase (C), glutamate aminotransferase (D), total bilirubin (E), low-density lipoprotein (F), and triglyceride (G) in different groups. aP < 0.05 and bP < 0.01 (compared to the Control group); cP < 0.05 and dP < 0.01 (compared to Di (2-ethylhexyl) phthalate group); eP < 0.05 and fP < 0.01 (compared to Oil group). ALT: Alanine aminotransferase; AST: Glutamate aminotransferase; TBIL: Total bilirubin; LDL: Low-density lipoprotein; TG: Triglyceride; DEHP: Di (2-ethylhexyl) phthalate.
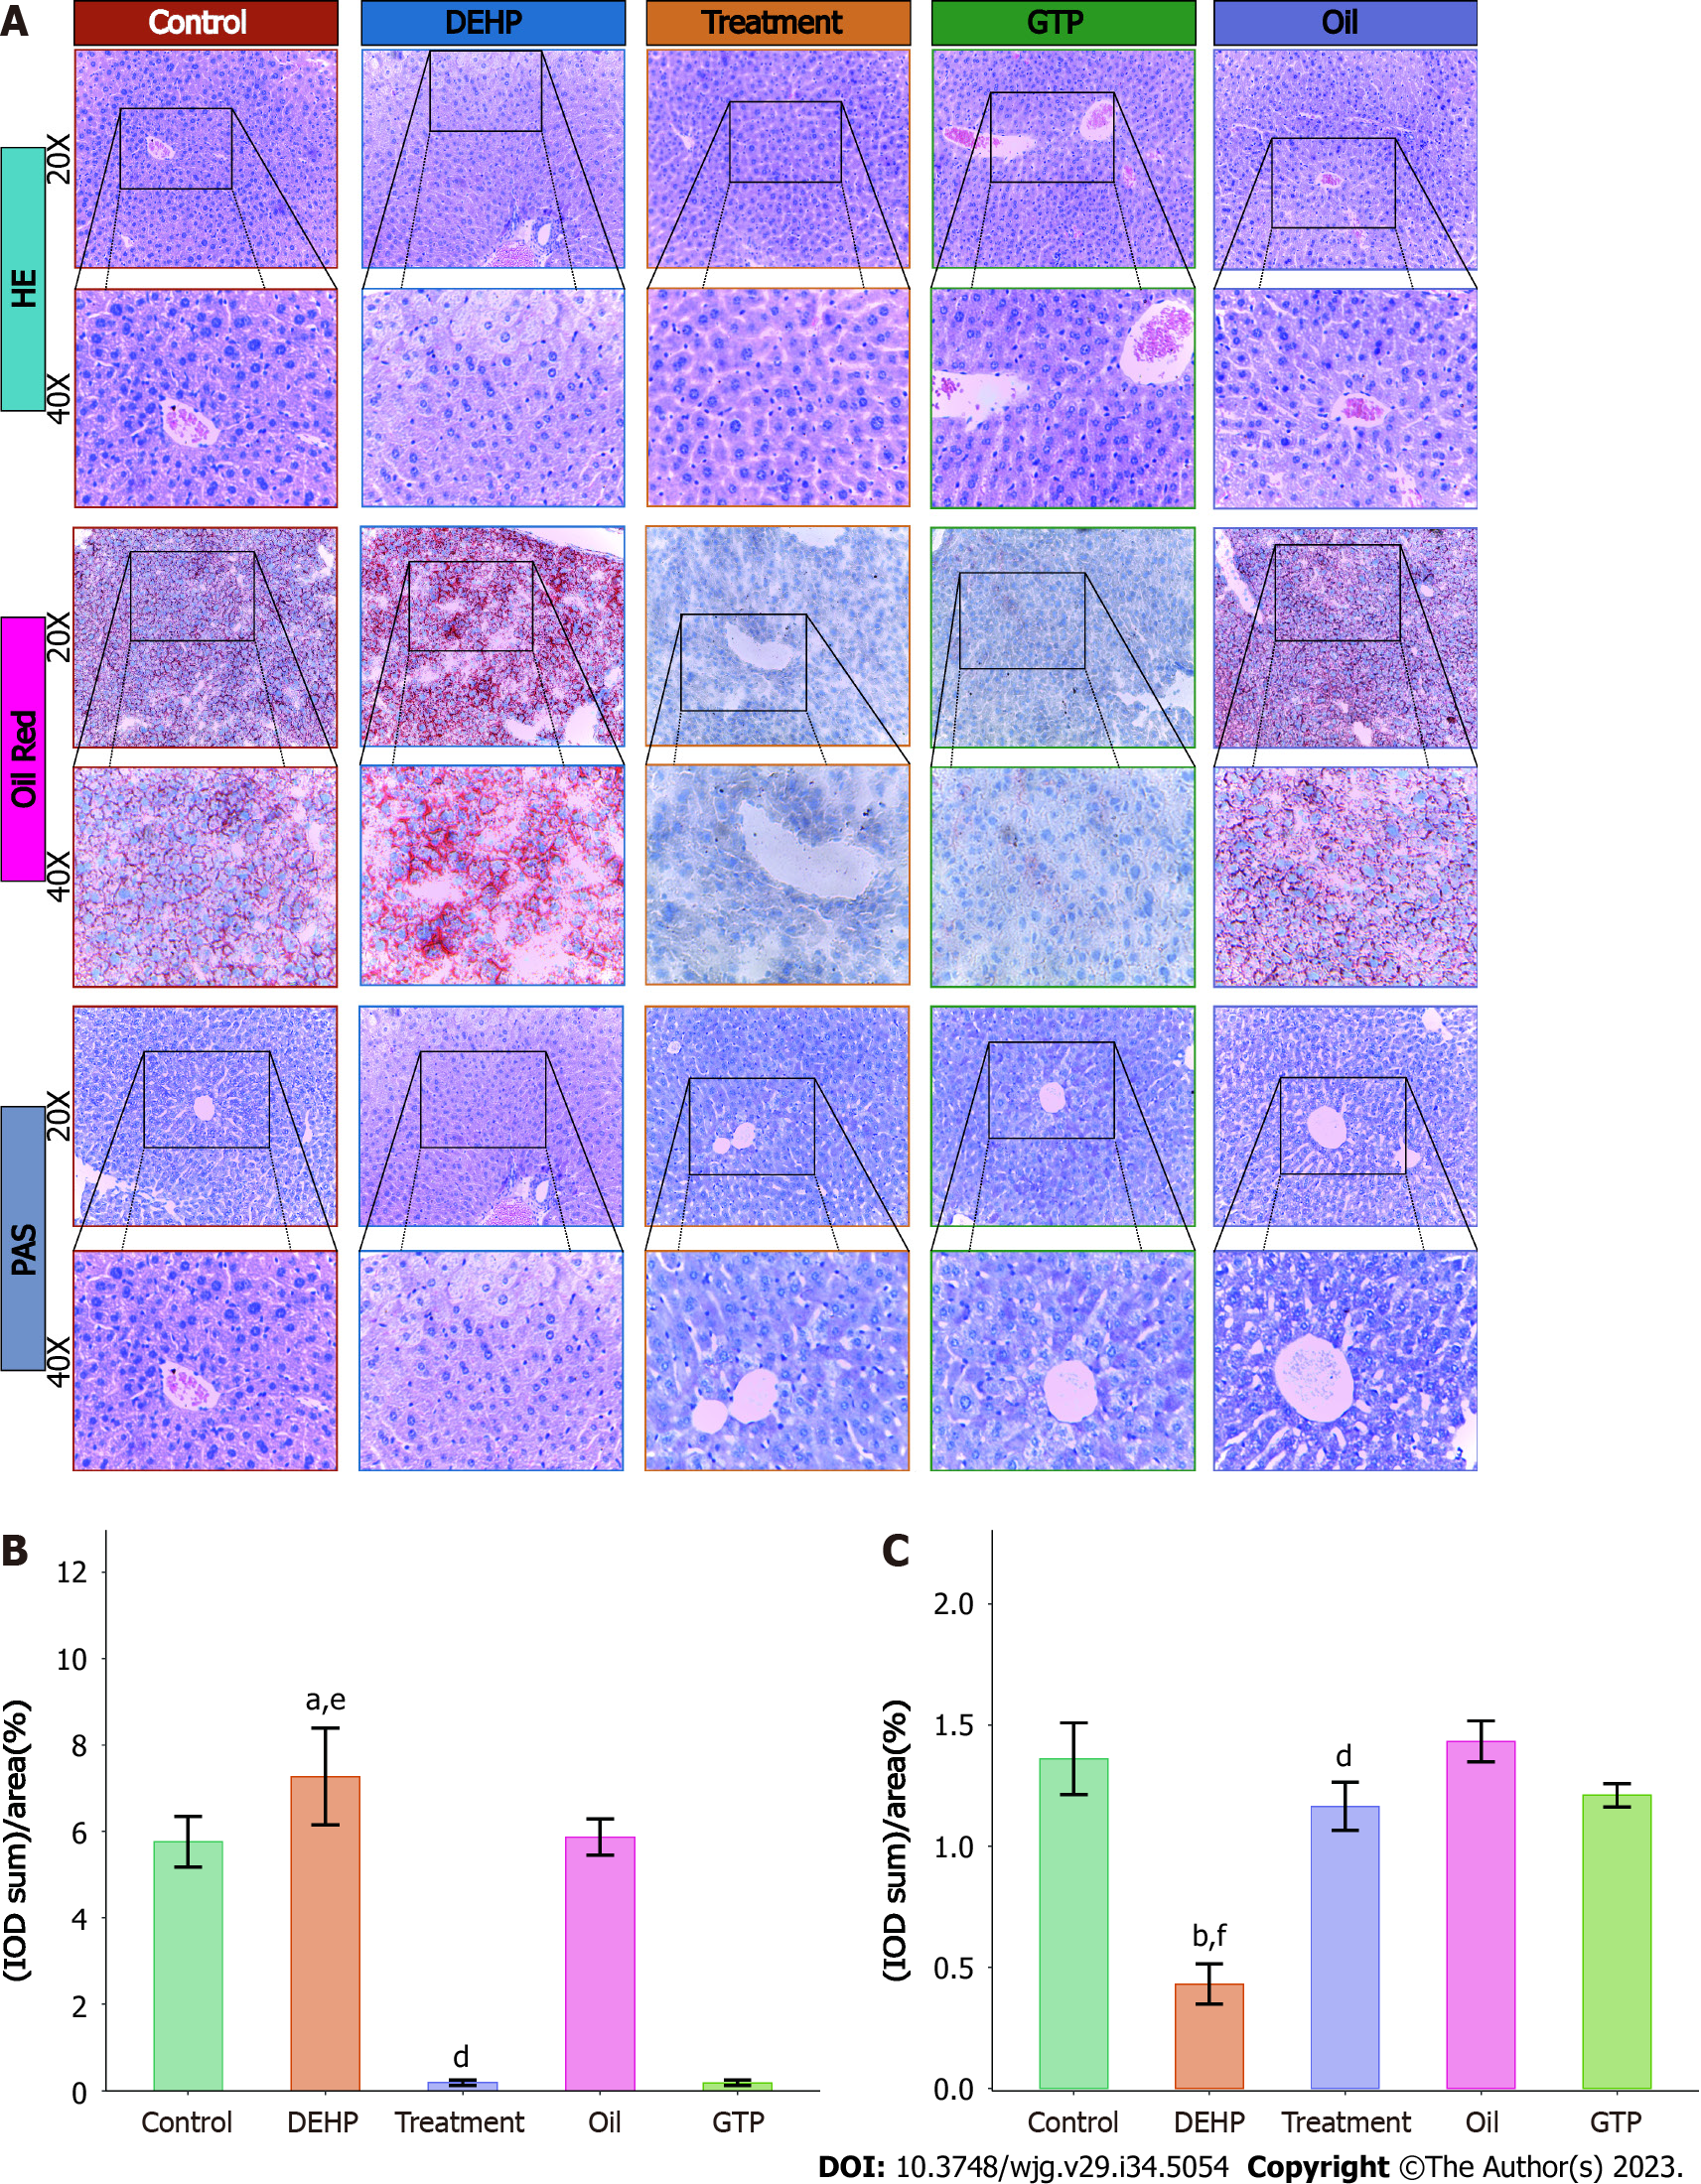
Figure 3 Hematoxylin and eosin, oil red O, and periodic acid-Schaff staining of liver sections and semiquantitative analysis of liver pathologies in mice from different groups.
A: Hematoxylin and eosin-stained, oil red O-stained, and periodic acid-Schaff (PAS)-stained liver sections of different groups; B and C: Comparative analysis of average optical density of oil red O staining (B) and PAS staining (C) intensities between different groups. aP < 0.05 and bP < 0.01 (compared to the Control group); dP < 0.01 (compared to Di (2-ethylhexyl) phthalate group); eP < 0.05 and fP < 0.01 (compared to Oil group). DEHP: Di (2-ethylhexyl) phthalate; HE: Hematoxylin and eosin; PAS: Periodic acid-Schaff.
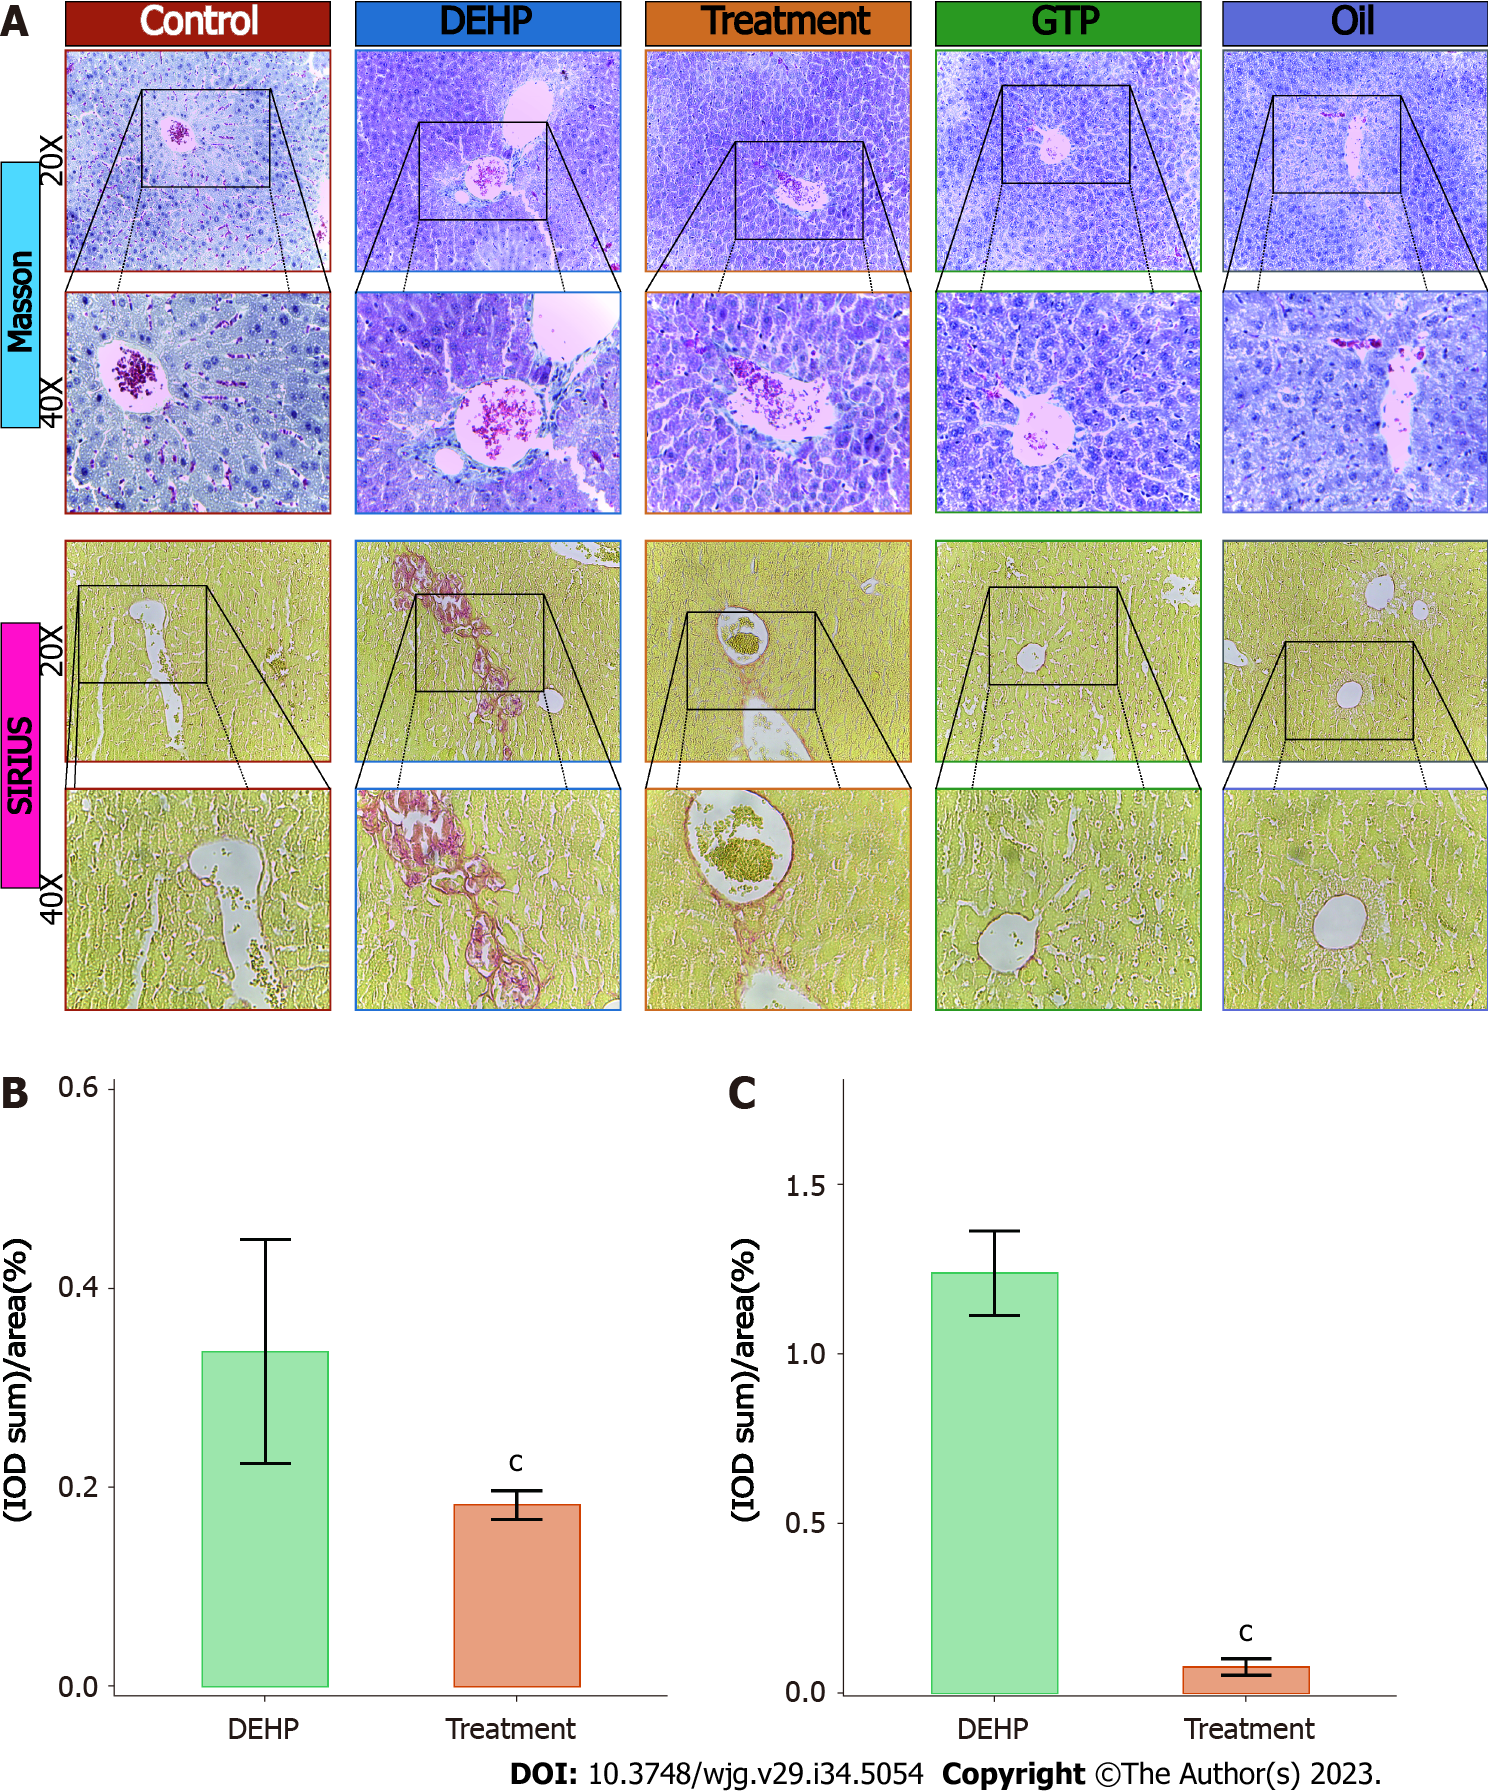
Figure 4 Masson’s trichrome and Sirius red staining and semiquantitative analysis of hepatic pathologies in mice from different groups.
A: Masson’s trichrome and Sirius red staining of liver samples from different groups; B and C: Comparative analysis of average optical density of Masson’s trichrome staining (B) and Sirius red staining (C) intensities between the model and treatment groups. cP < 0.05 (compared to Di (2-ethylhexyl) phthalate group). DEHP: Di (2-ethylhexyl) phthalate.
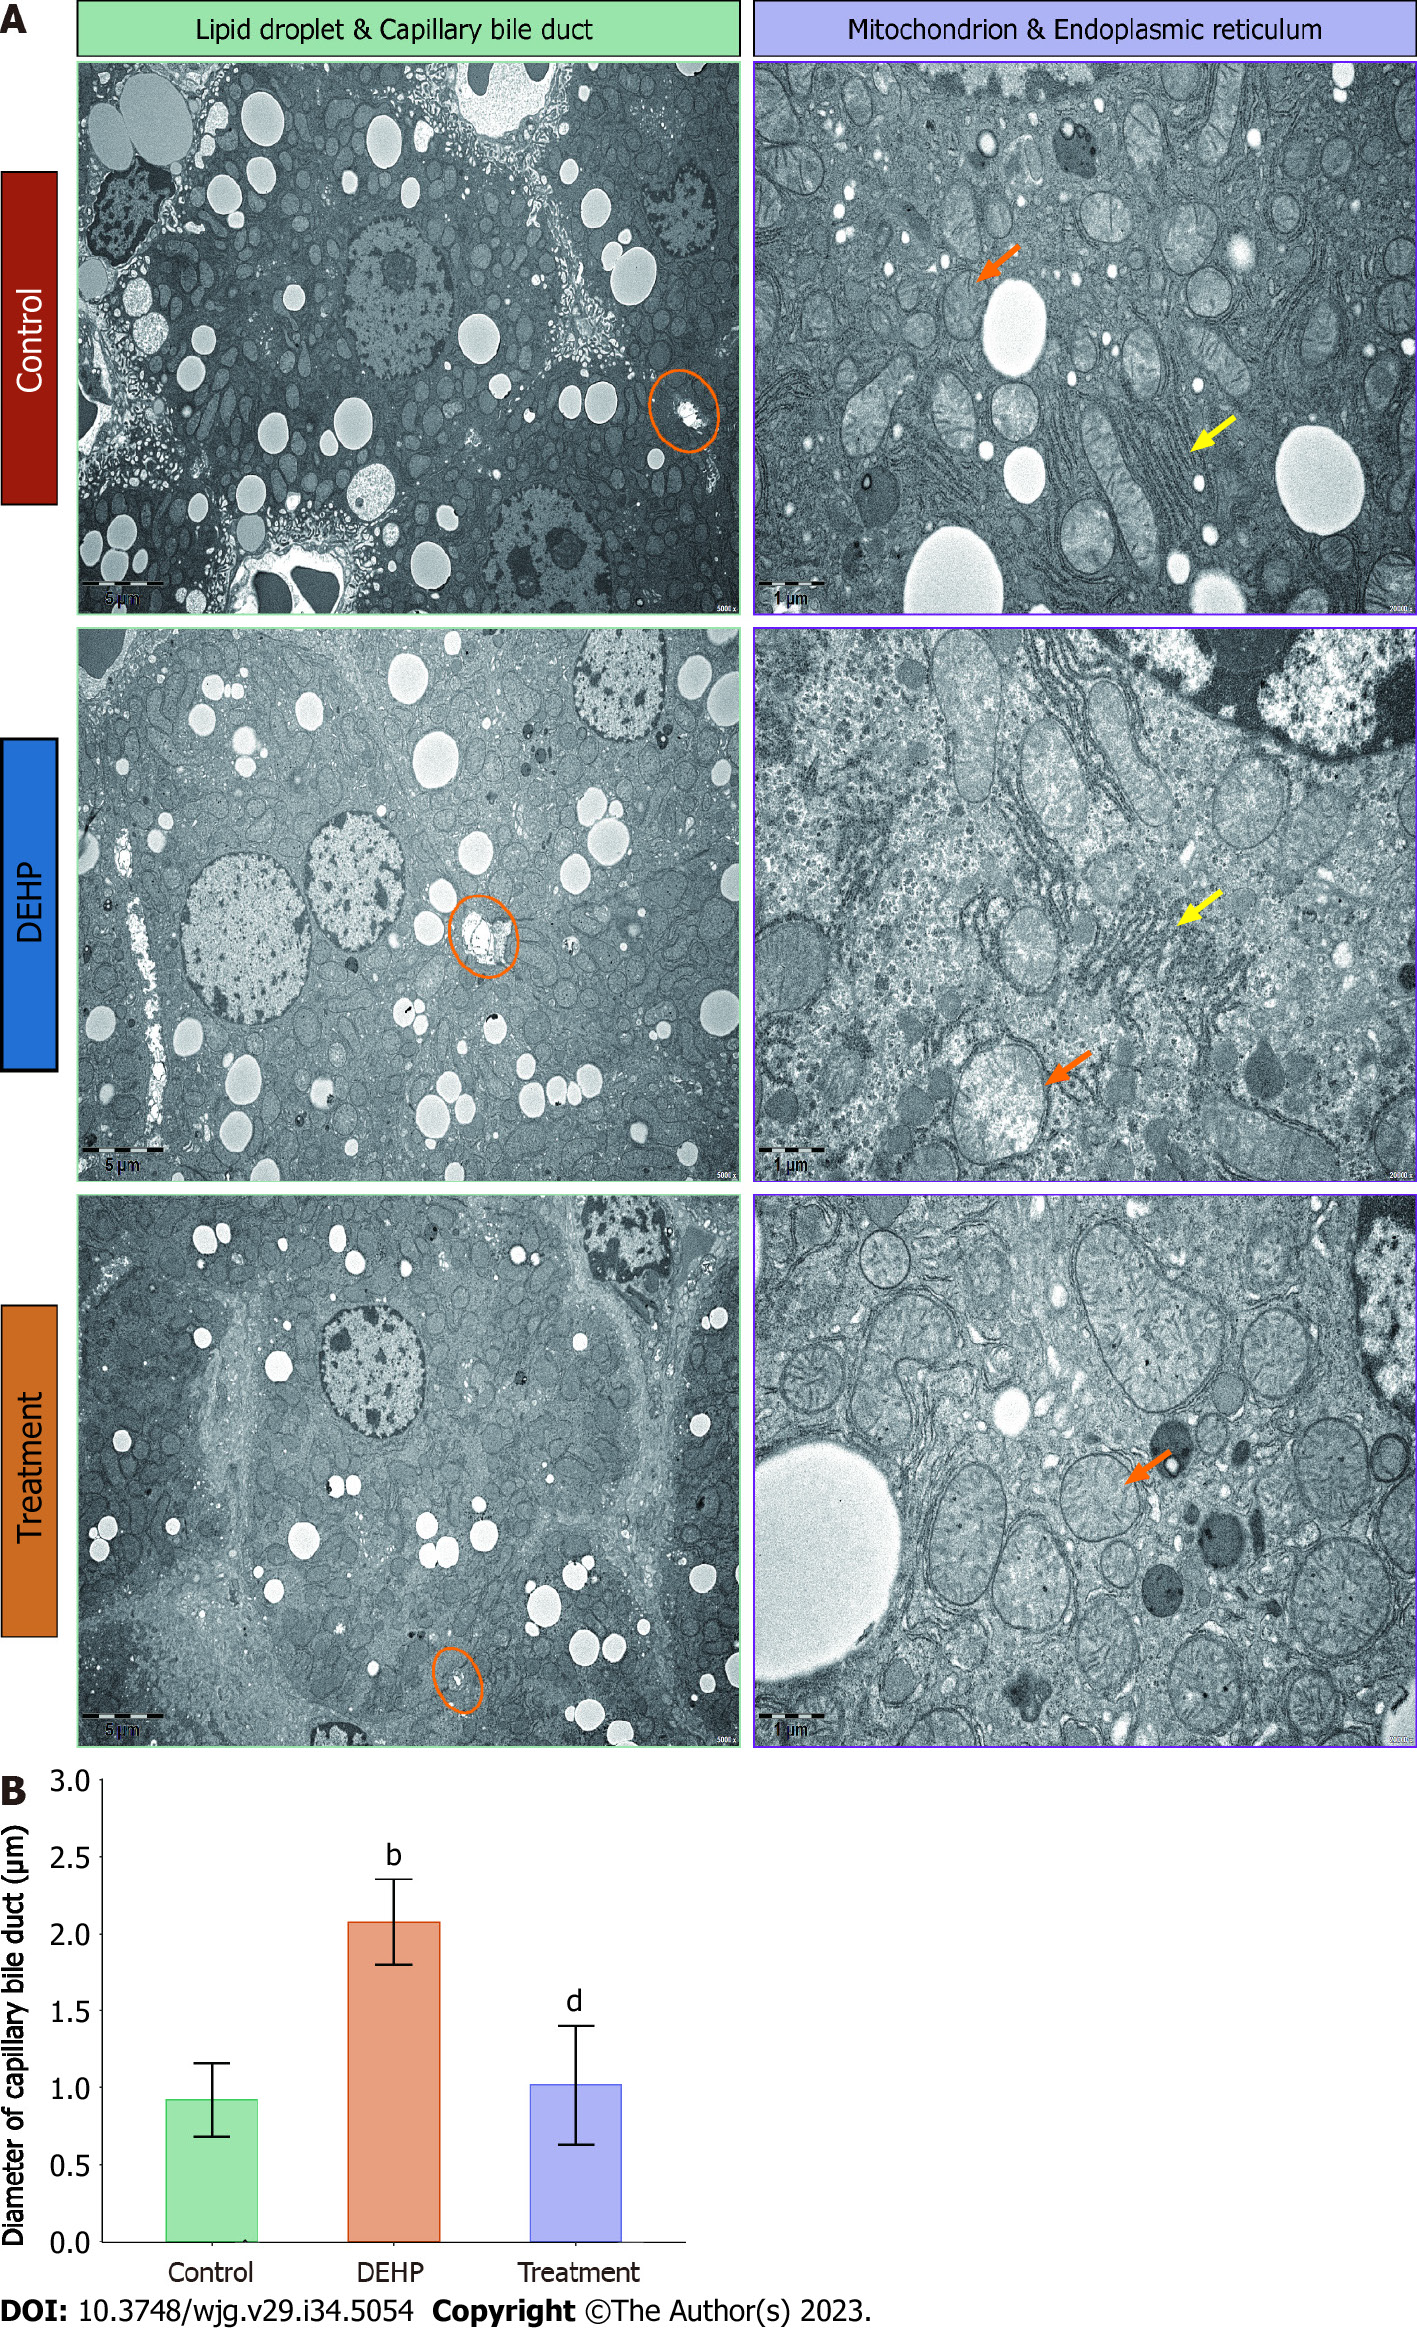
Figure 5 Comparative quantitative analysis of transmission electron microscopy results between the control, model, and treatment groups.
A: Comparison of transmission electron microscopy results between the control, model, and treatment groups. In the model and control groups, increased numbers of fat droplets with enhanced size were visible. Expanded capillary bile ducts (indicated with orange circles), mildly swollen mitochondria (indicated with orange arrows), and disordered rough endoplasmic reticulum (indicated with yellow arrows) were observed in the model group. In the treatment group, the number of fat droplets decreased, capillary bile ducts appeared mostly healthy (indicated with orange circles), and mitochondrial swelling was reduced (indicated with orange arrows); B: Quantitative analysis of small bile duct diameter in mice from the control, model, and treatment groups. bP < 0.01 (compared to the Control group); dP < 0.01 (compared to Di (2-ethylhexyl) phthalate group). DEHP: Di (2-ethylhexyl) phthalate.
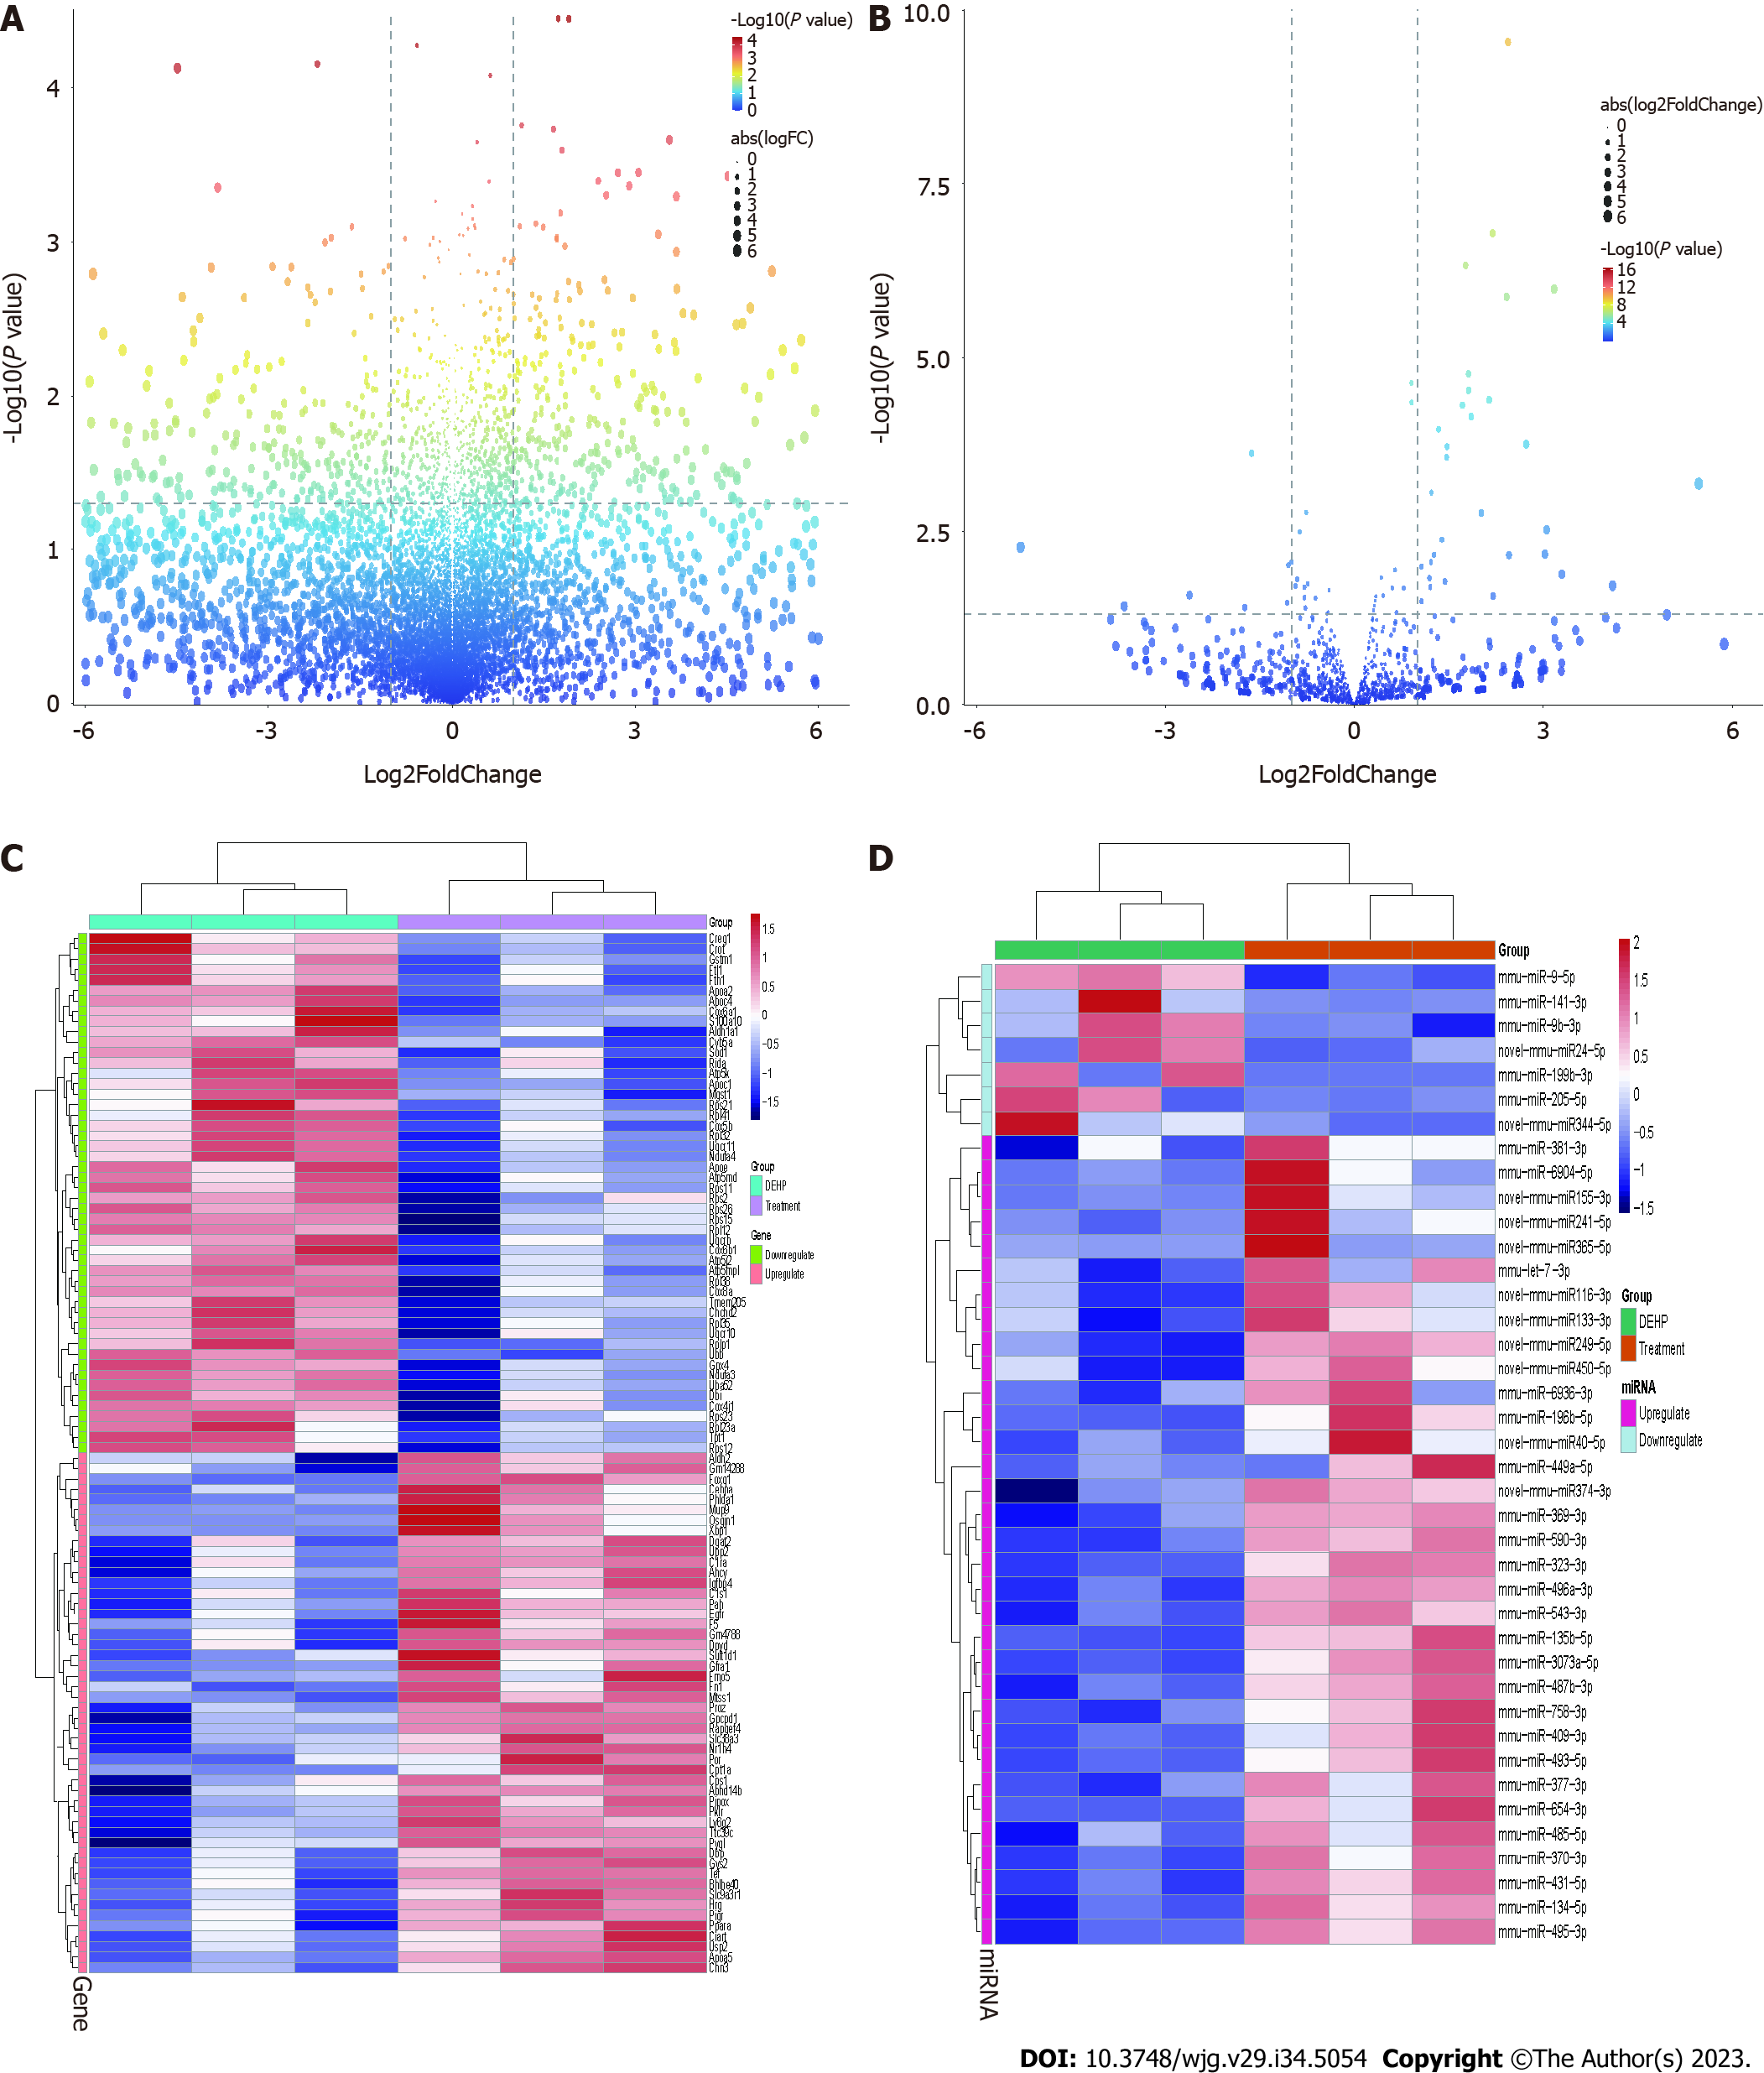
Figure 6 Differential expression of mRNAs and microRNAs between the treatment and model groups.
A: The volcano plot of differentially expressed mRNAs between the treatment and model groups. The upper left quadrant and the upper right quadrant in the figure represent downregulated and upregulated mRNAs, respectively; B: The volcano plot of differentially expressed microRNAs (miRNAs) between the treatment and model groups. The upper left quadrant and the upper right quadrant in the figure represent downregulated and upregulated miRNAs, respectively; C: Heatmap shows the 50 mRNAs that exhibited the highest upregulation and downregulation in the treatment group relative to the model group; D: Heatmap shows the miRNAs that exhibited the highest upregulation and downregulation in the treatment group relative to the model group.
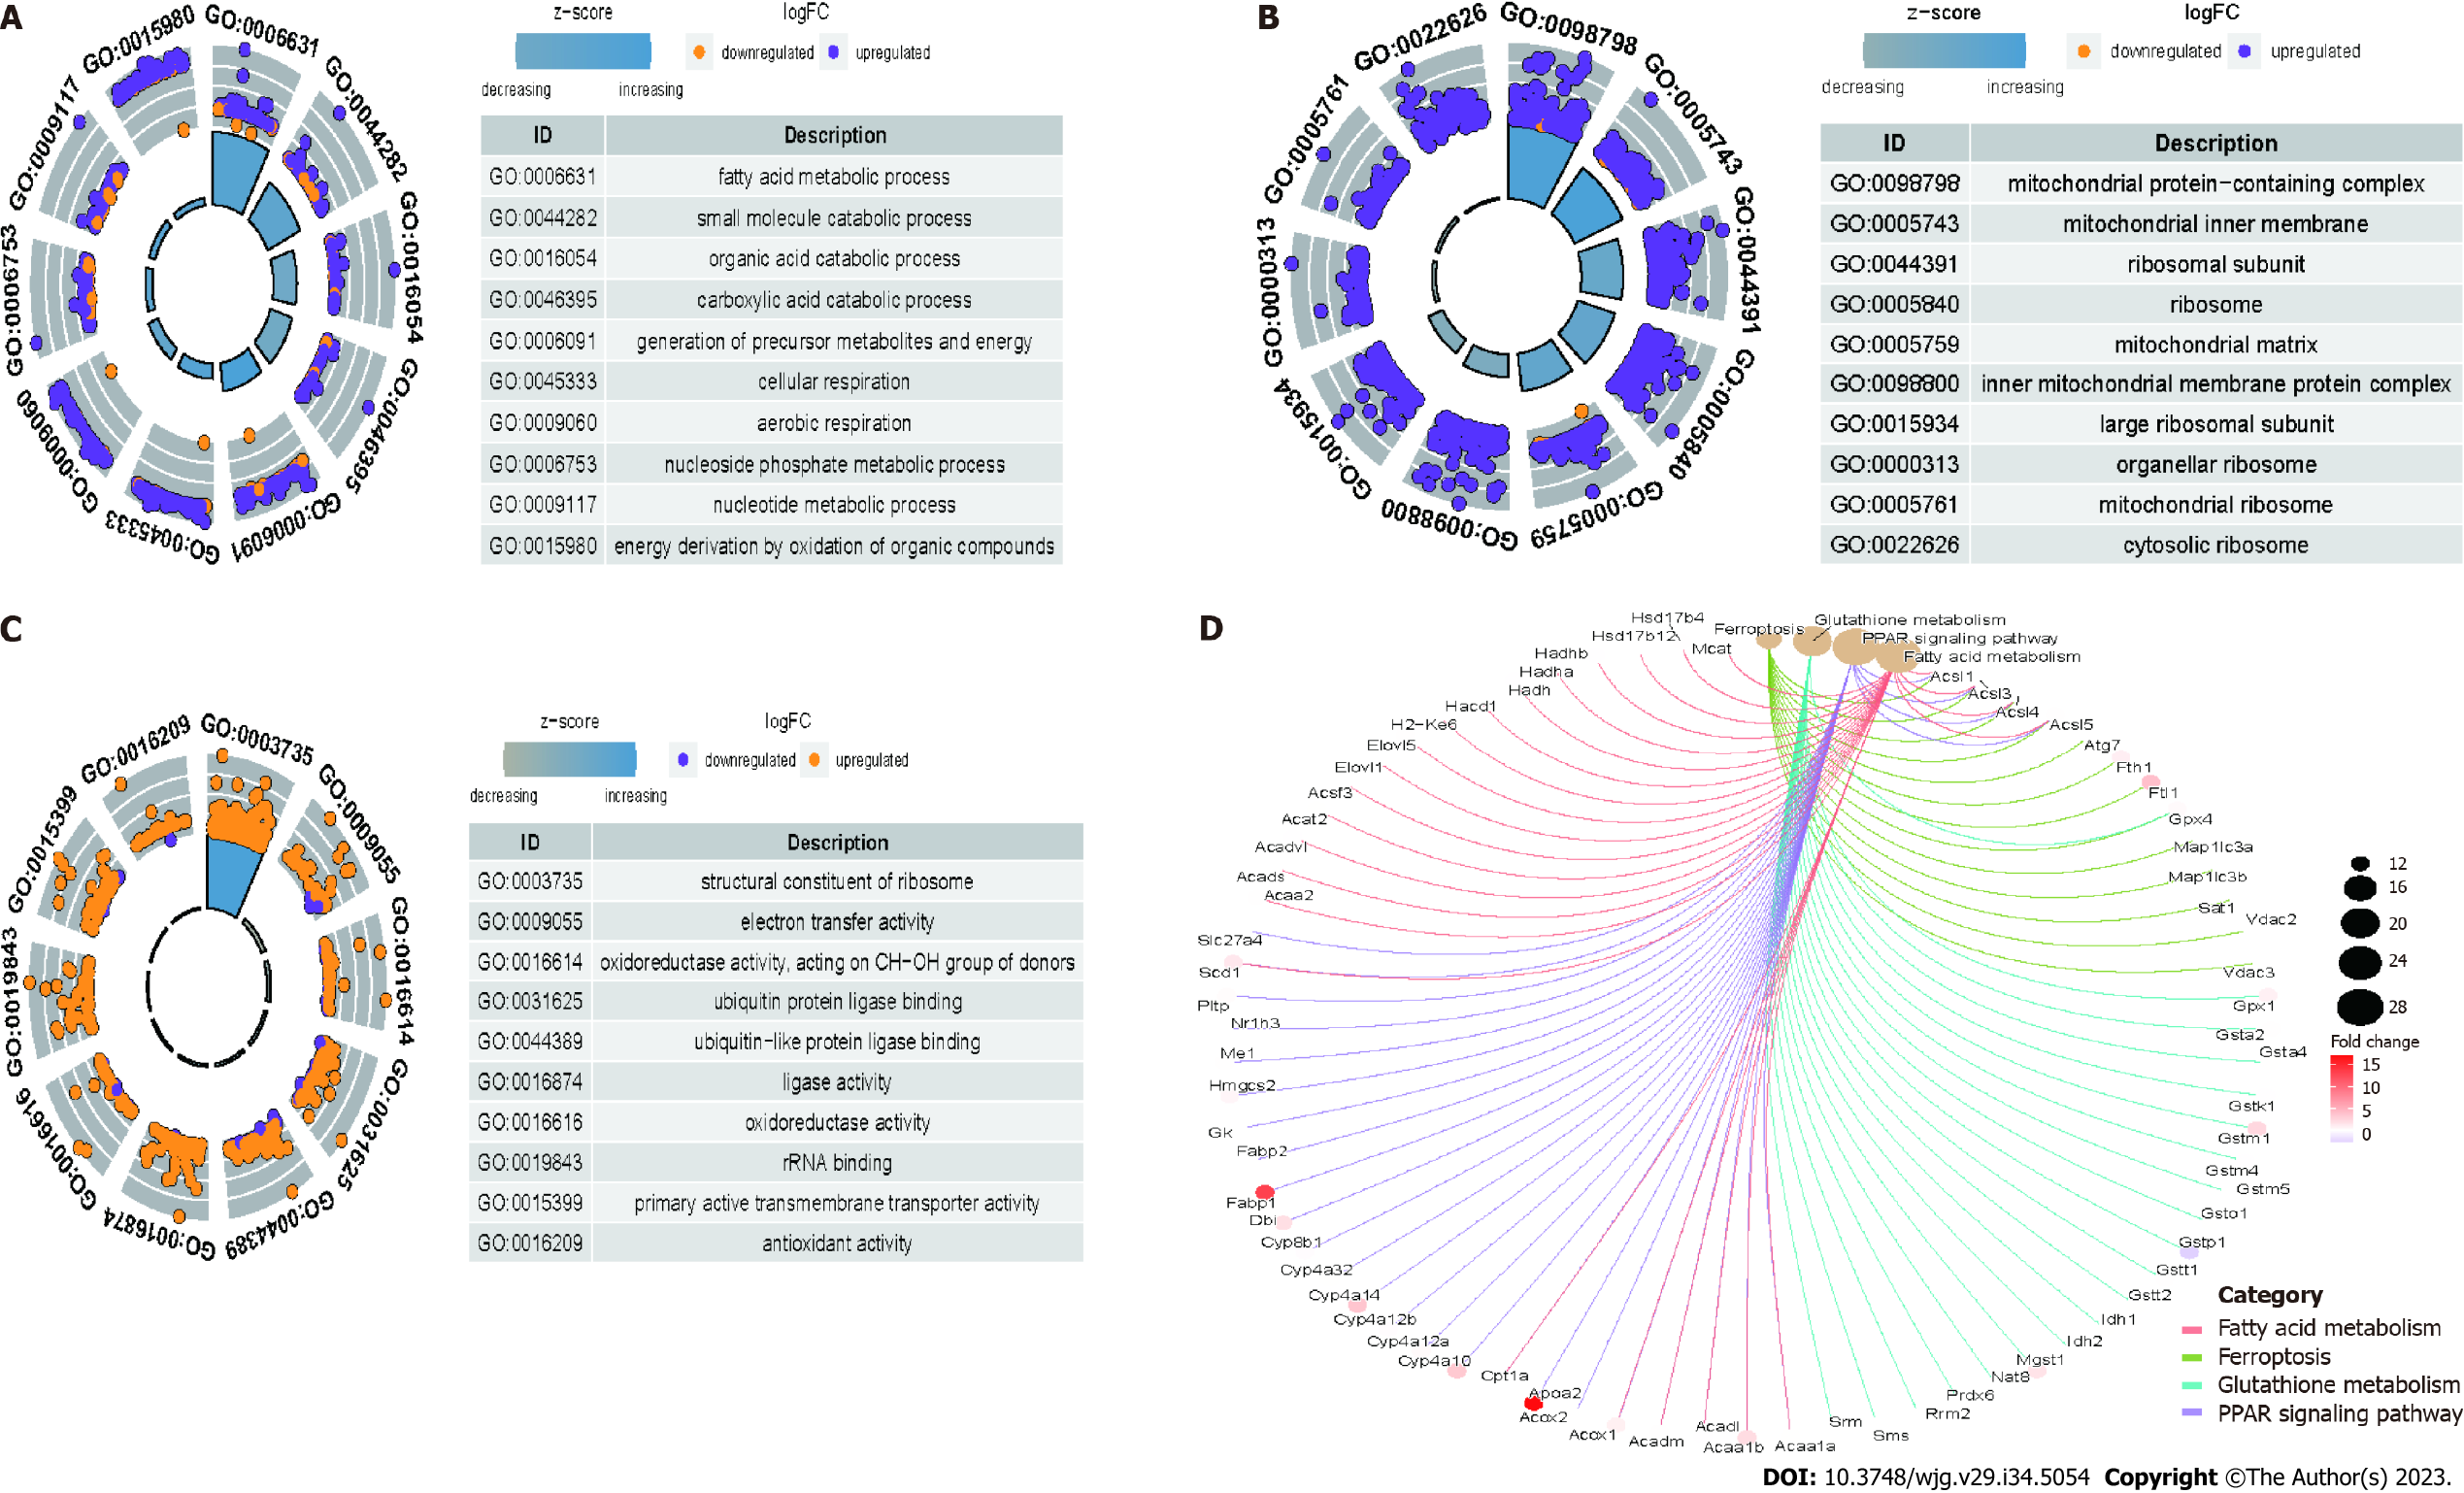
Figure 7 The differentially expressed mRNAs between the model and control groups were enriched in different Gene Ontology terms and Kyoto Encyclopedia of Genes and Genomes pathways.
A: Biological processes; B: Cellular components; C: Molecular function; D: Kyoto Encyclopedia of Genes and Genomes pathways.
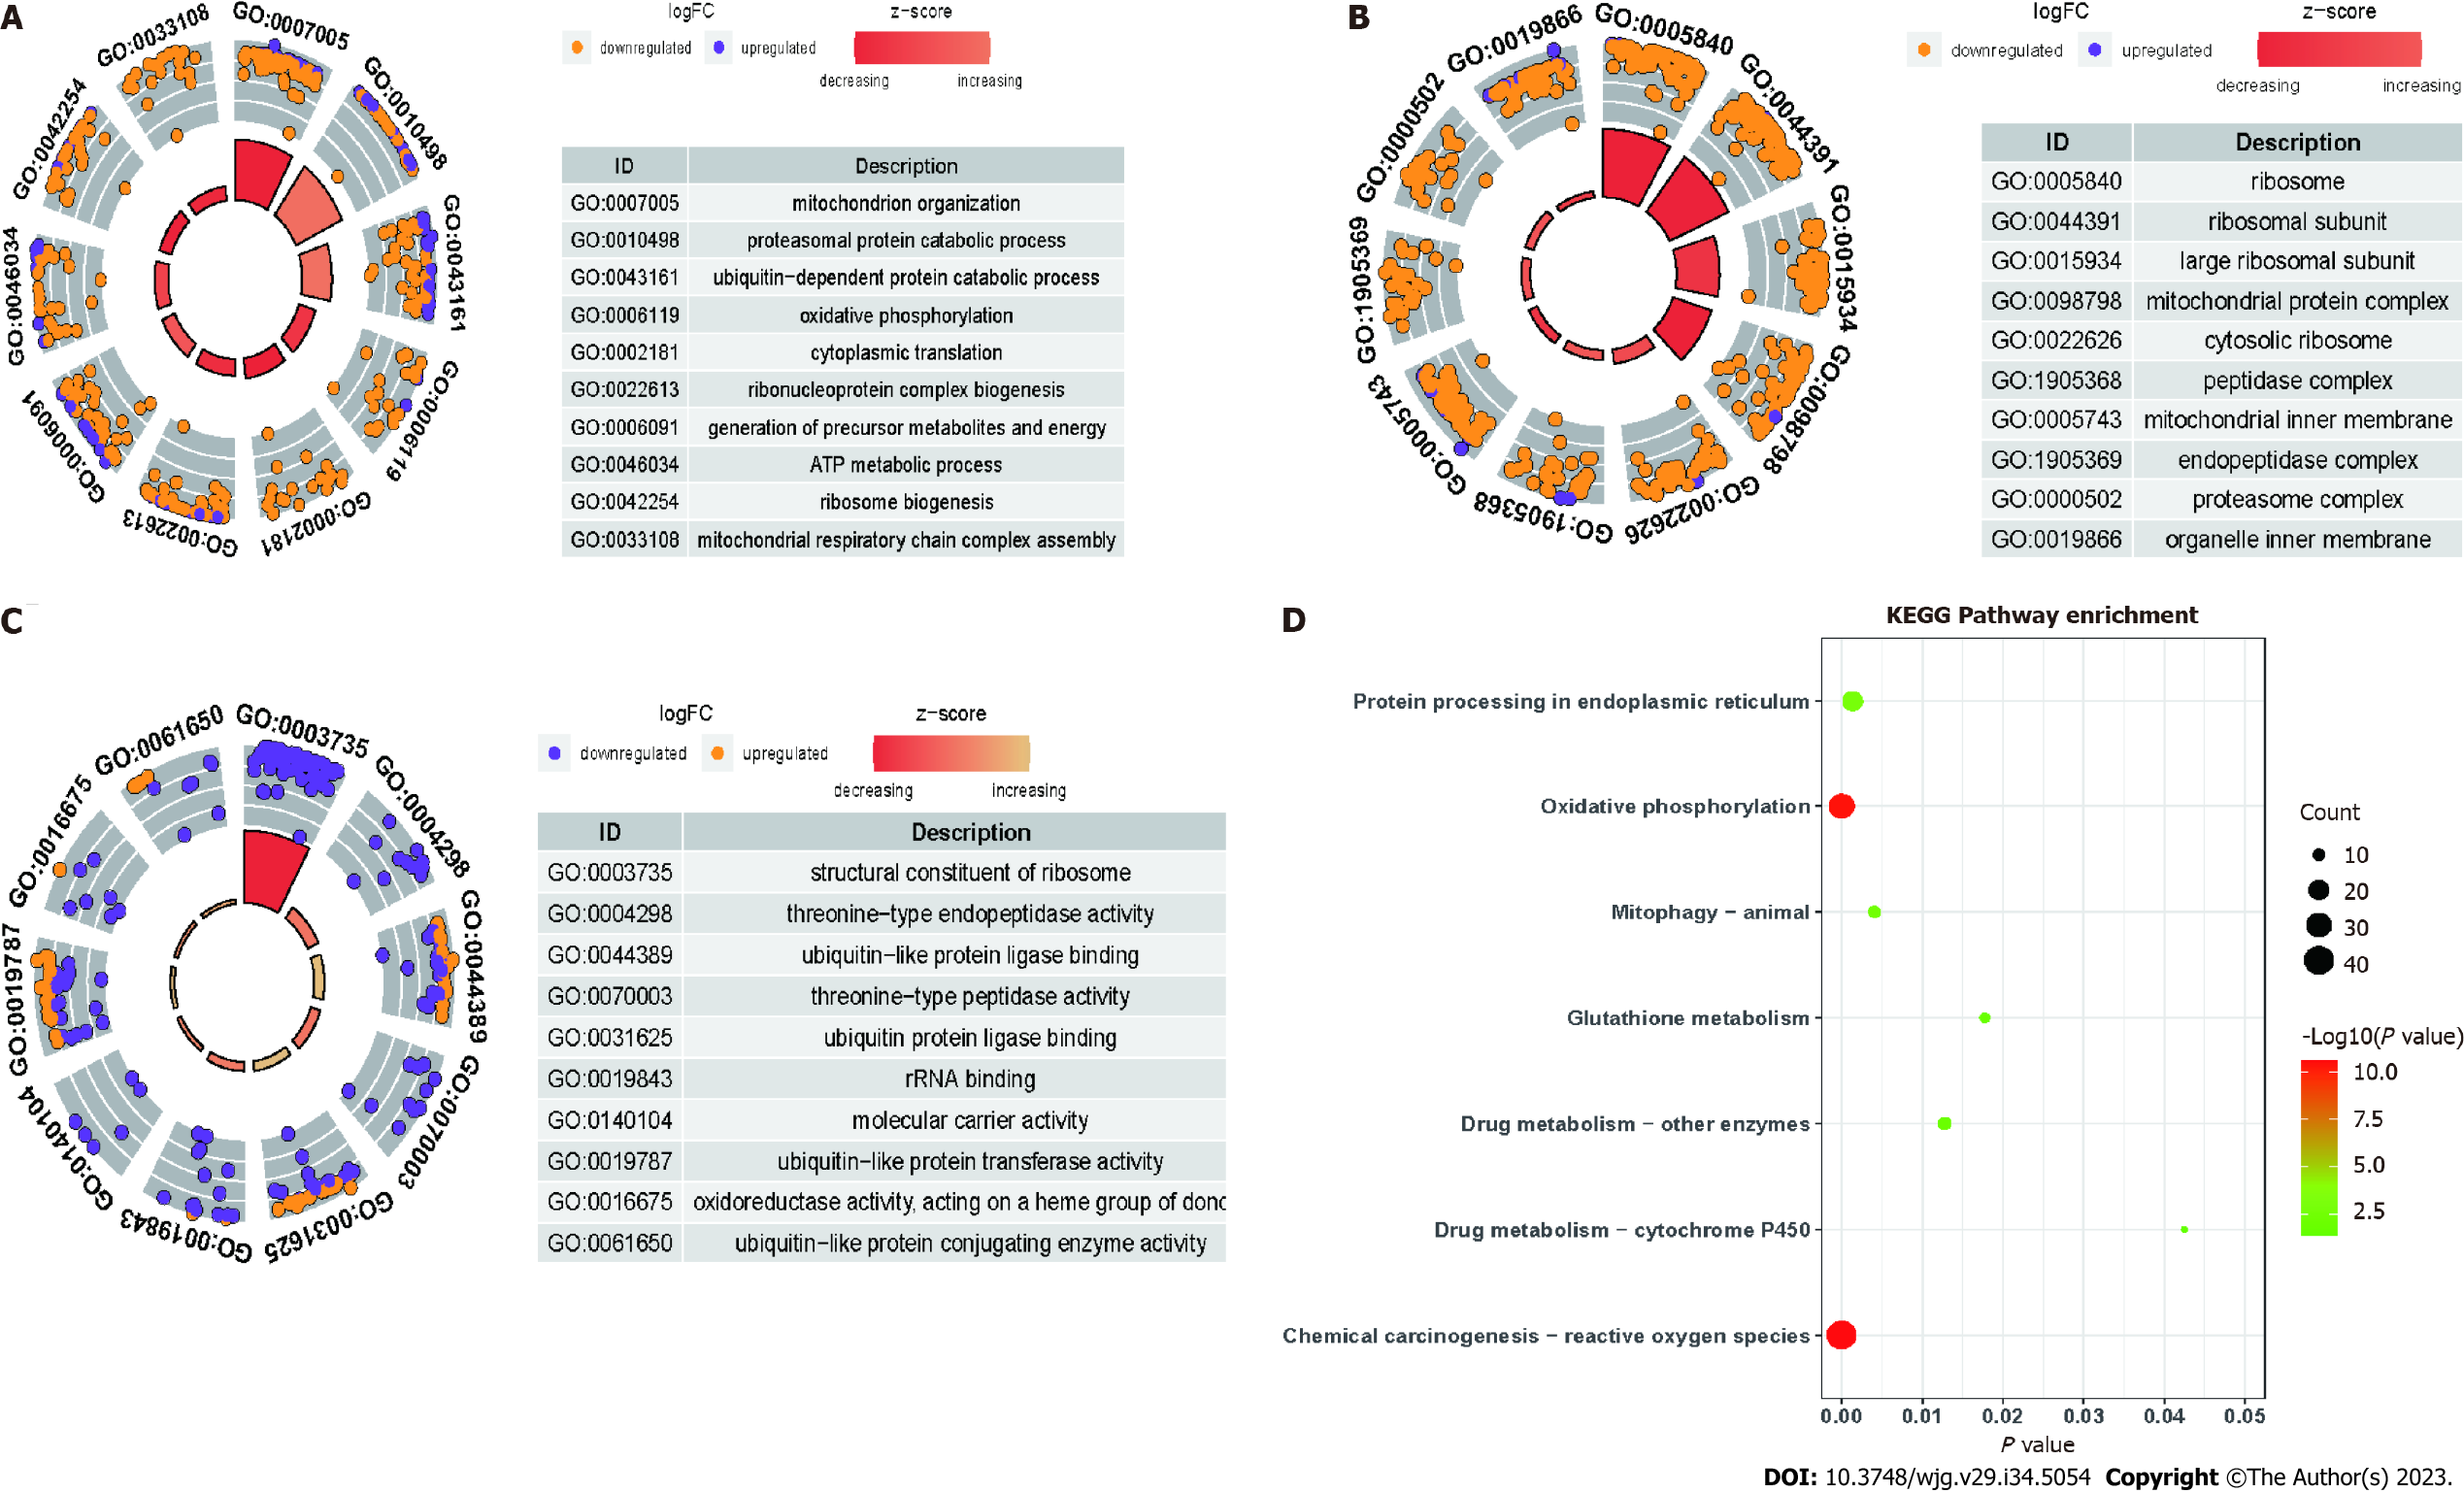
Figure 8 The differentially expressed mRNAs between the treatment and model groups were enriched in different Gene Ontology terms and Kyoto Encyclopedia of Genes and Genomes pathways.
A: Biological processes; B: Cellular components; C: Molecular function; D: Kyoto Encyclopedia of Genes and Genomes pathways.
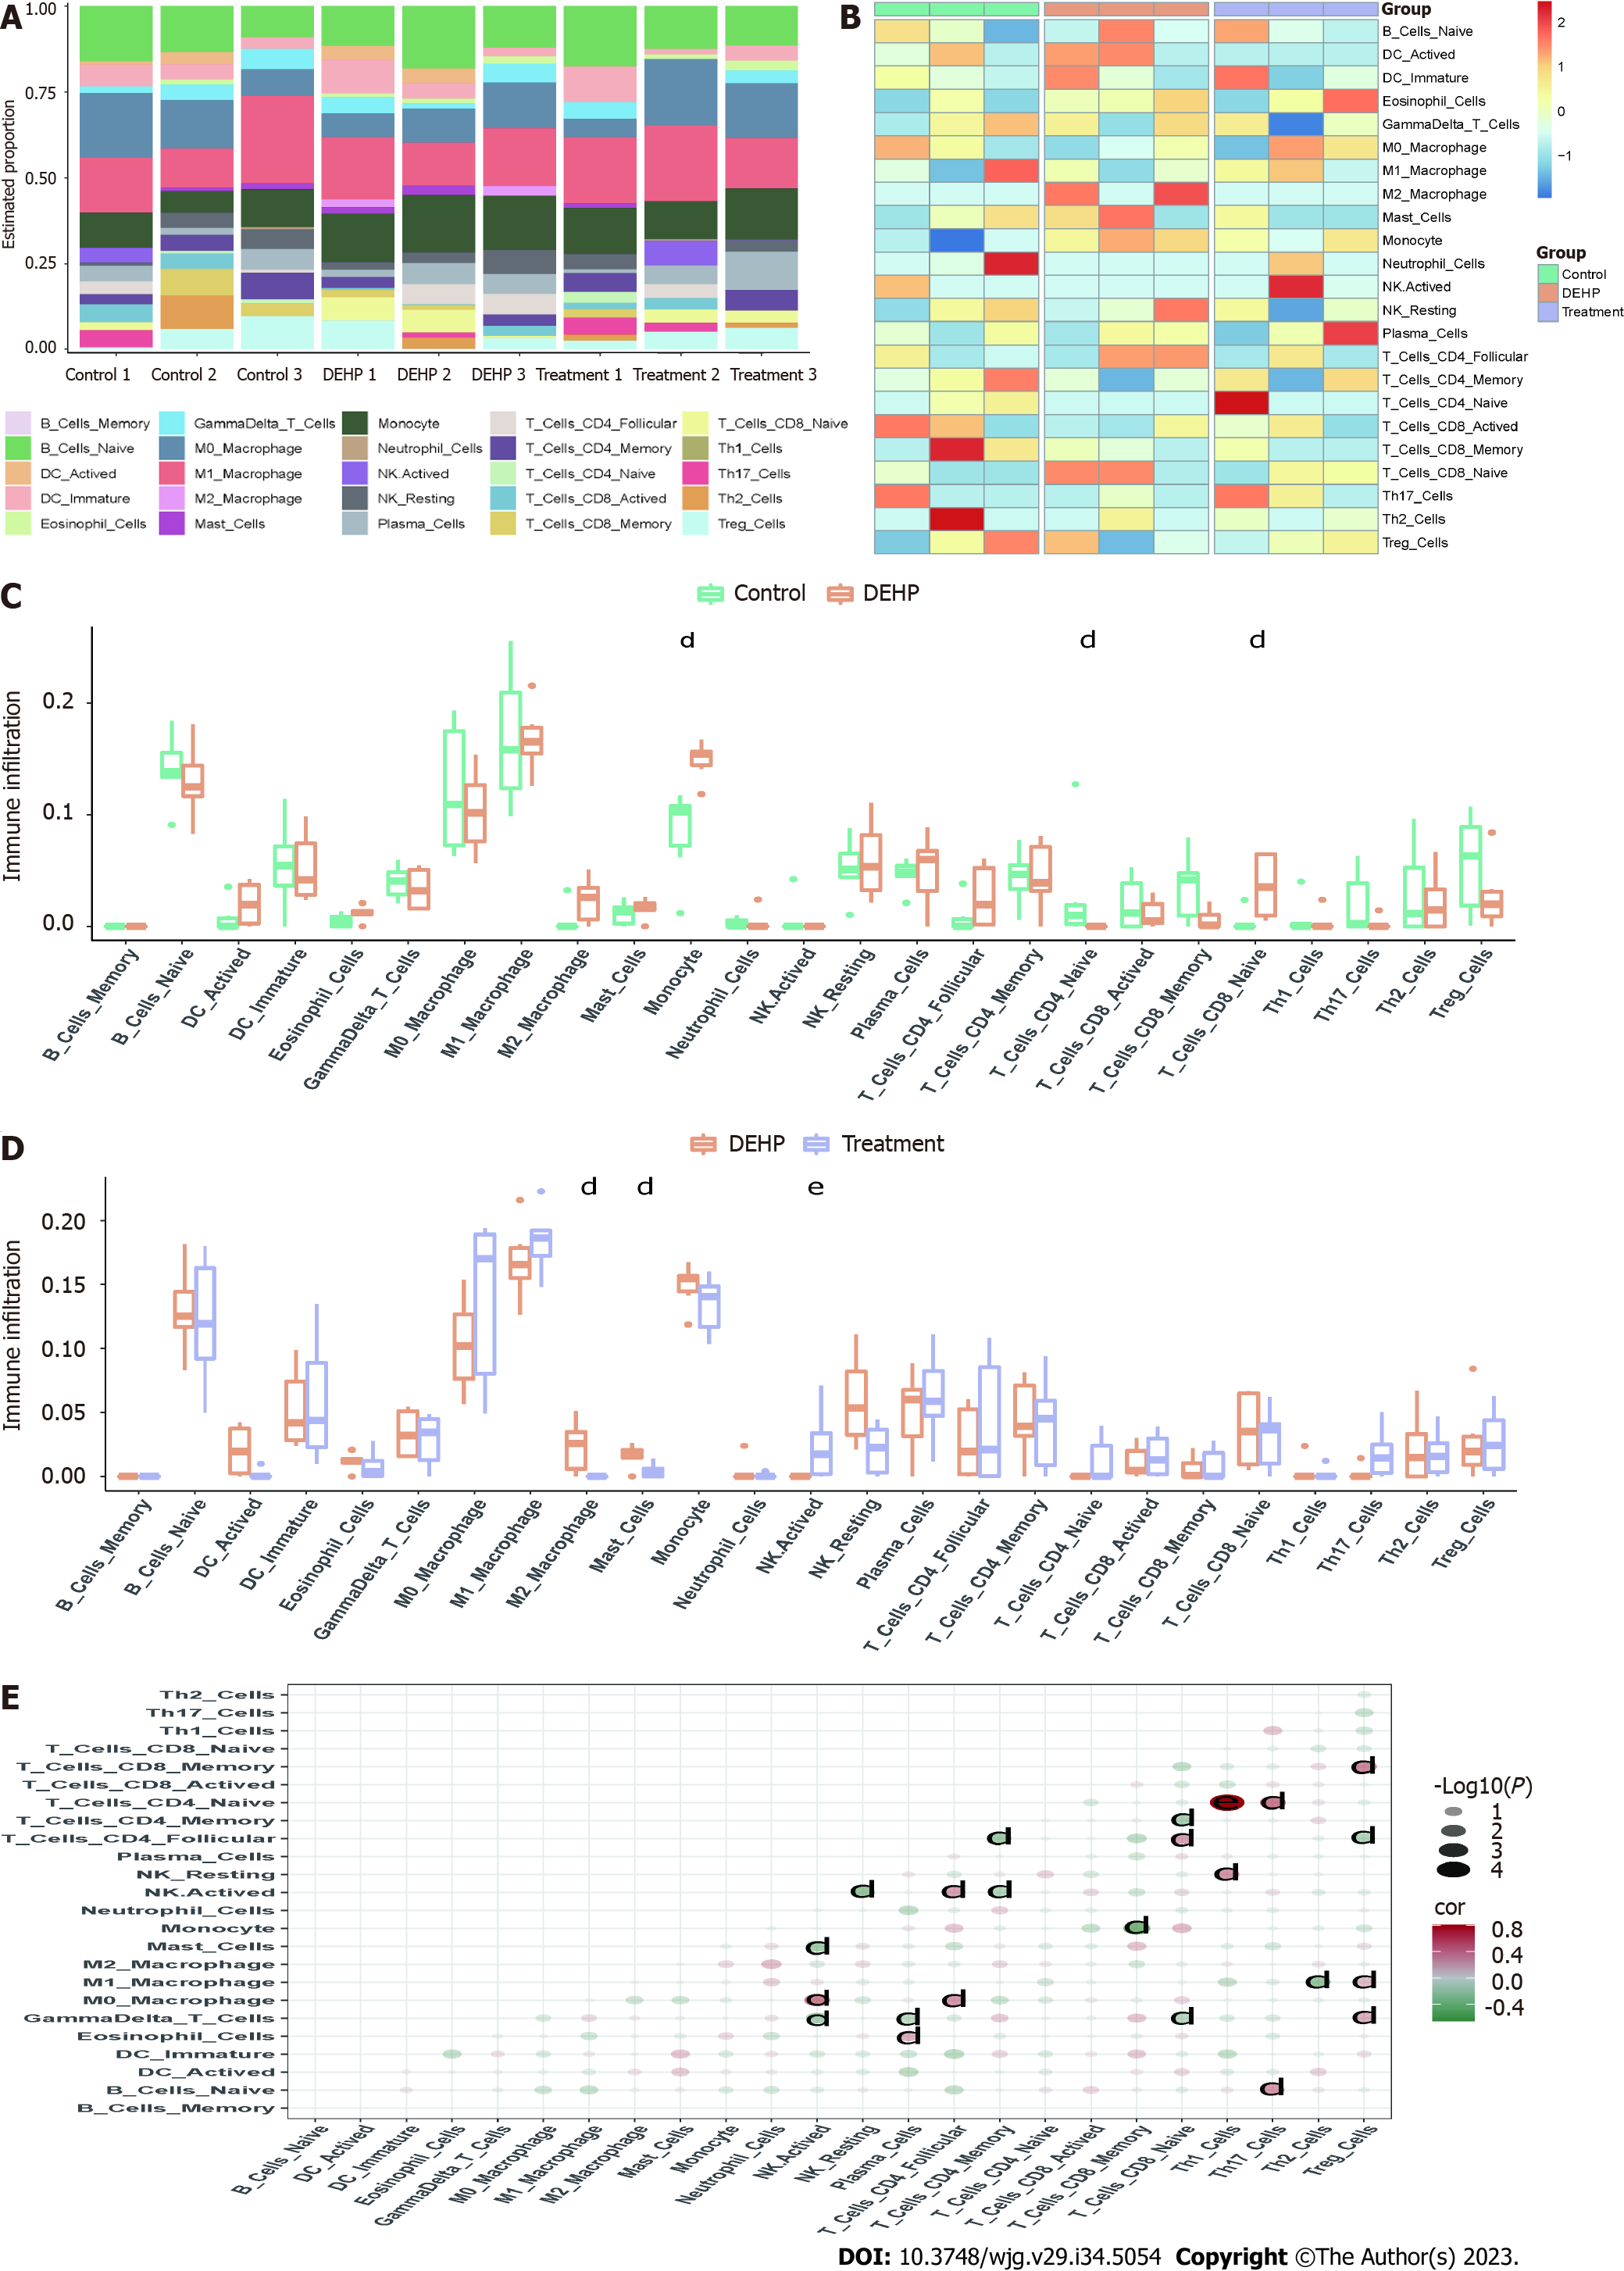
Figure 9 Immune infiltration analyses.
A and B: Histograms (A) and heatmaps (B) of the proportions of immune cells in the control, model, and treatment groups; C and D: Analyses of differential immune cell infiltration between the model and control groups (C), as well as between the treatment and model groups (D); E: Correlation analyses of immune cells in different groups. dP < 0.01 (compared to Di (2-ethylhexyl) phthalate group); eP < 0.05 (compared to Oil group). DEHP: Di (2-ethylhexyl) phthalate.
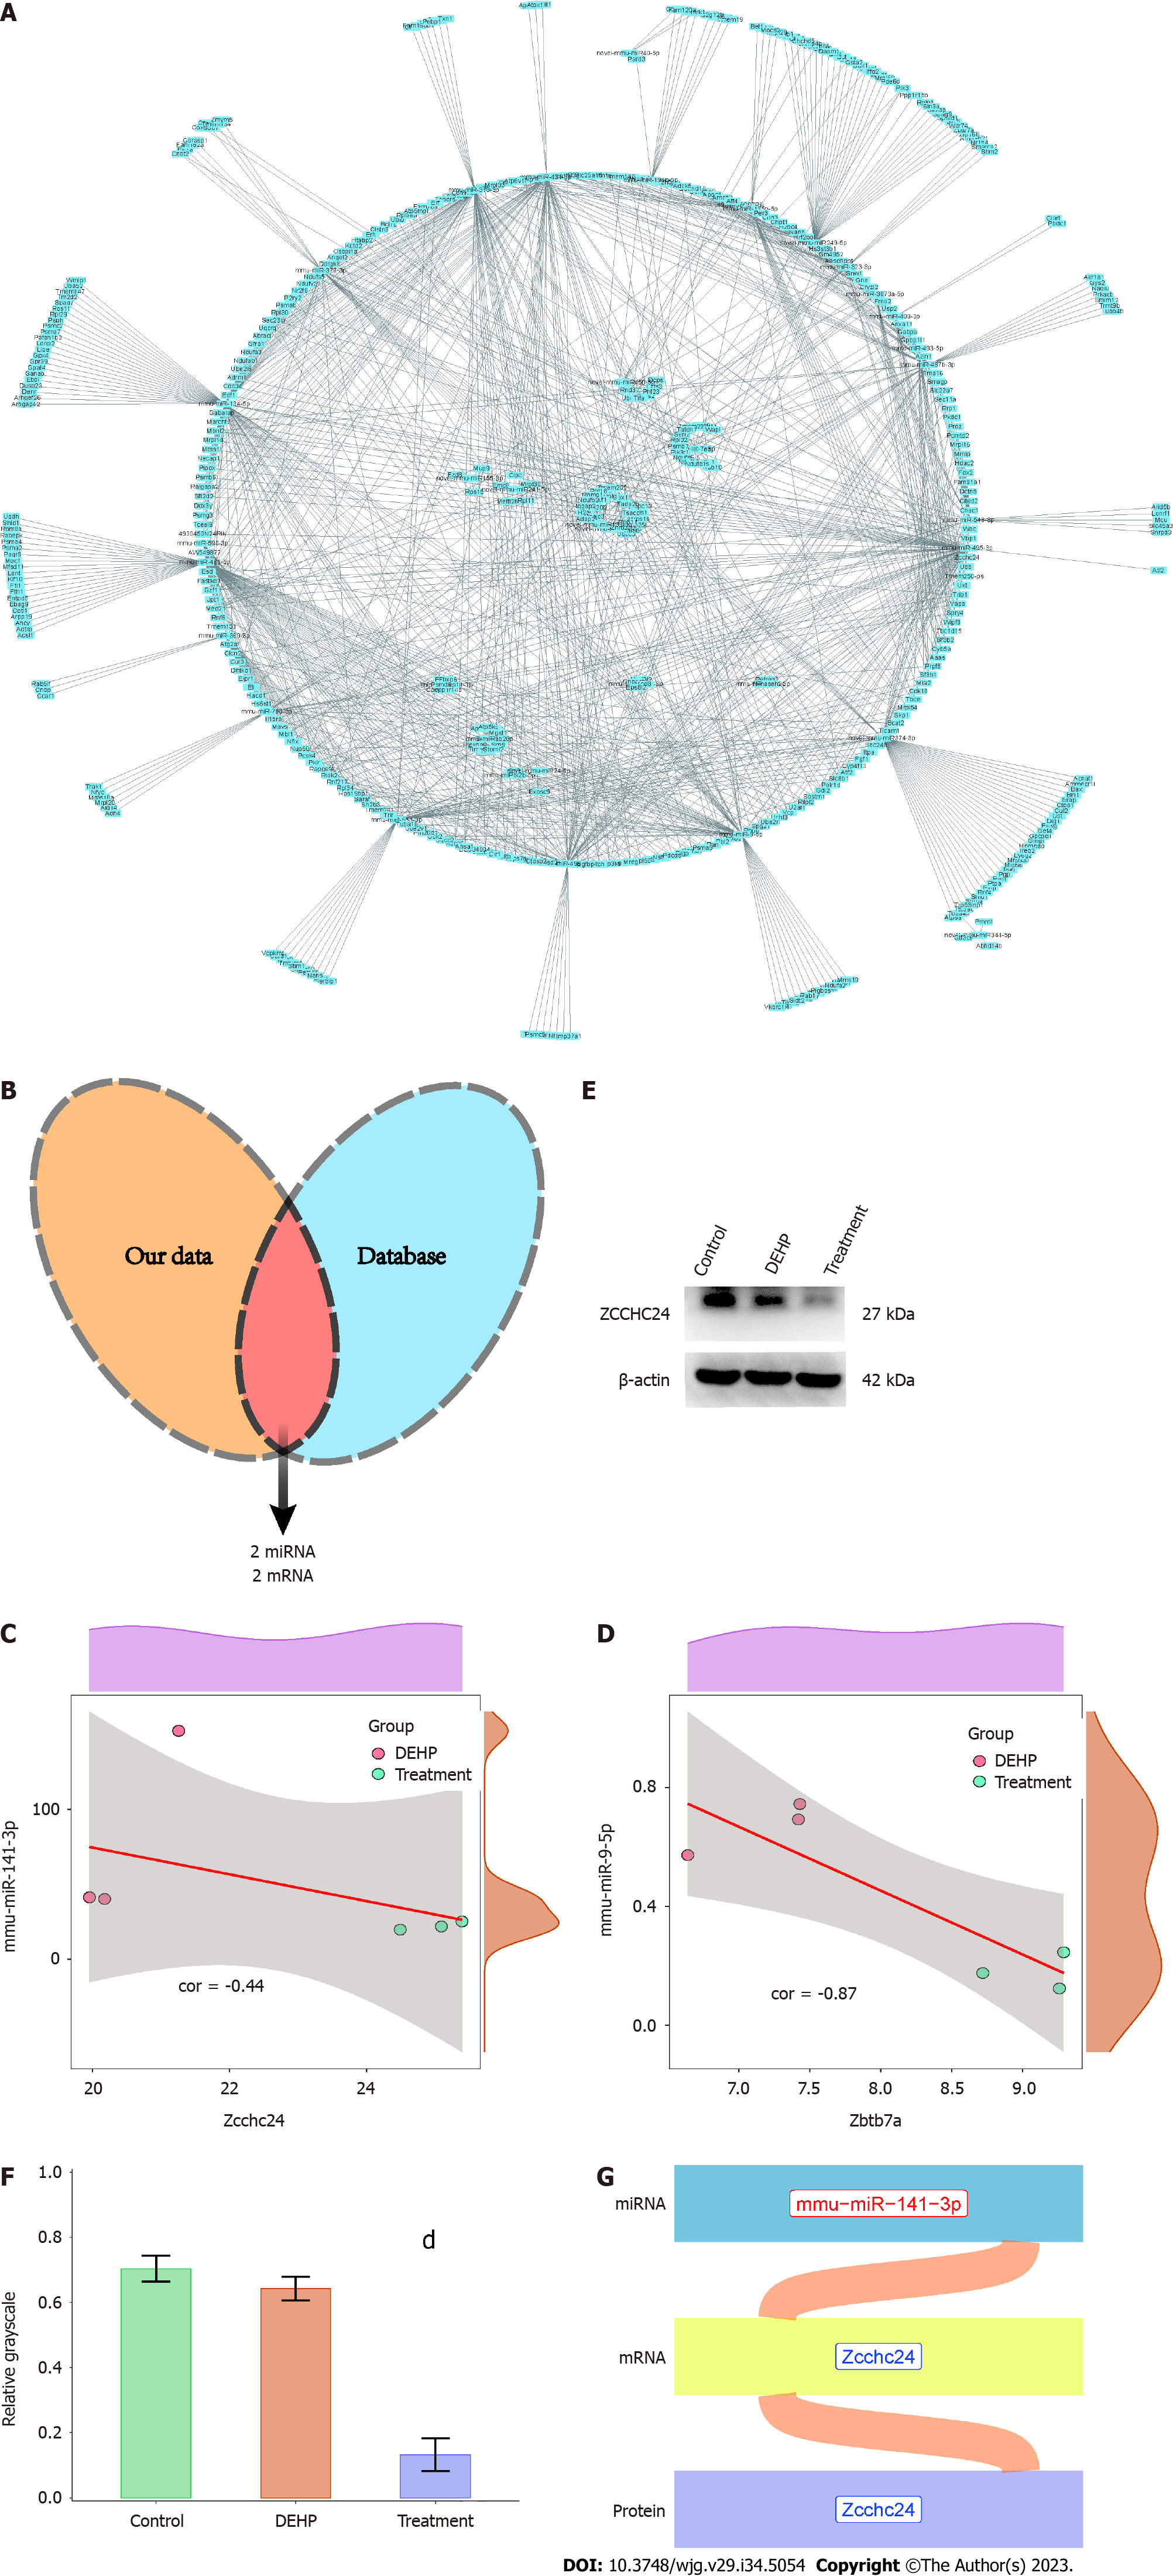
Figure 10 Construction of the microRNA-mRNA-protein regulatory axis.
A: The network diagram was constructed using differentially expressed mRNAs and microRNAs (miRNAs); B: Wayne diagram indicating the intersection of the miRNA-mRNA regulatory axis and mouse interaction network from the starBase database; C: Correlation analyses of mmu-miR-141-3p and Zcchc24; D: Correlation analyses of mmu-miR-9-5p and Zbtb7a; E: Western blotting validation of Zcchc24 protein expression in the control, model, and treatment groups; F: Semiquantitative analysis of Zcchc24 protein levels in the control, model, and treatment groups; G: The Sankey plot of the miRNA-mRNA-protein regulatory axes mediating the suppressive effects of green tea polyphenols (GTPs) on di-(2-ethylhexyl) phthalate (DEHP)-induced liver damage in mice. Red and blue fonts indicate upregulated and downregulated expression, respectively. dP < 0.01 (compared to DEHP group). DEHP: Di (2-ethylhexyl) phthalate; GTPs: Green tea polyphenols.
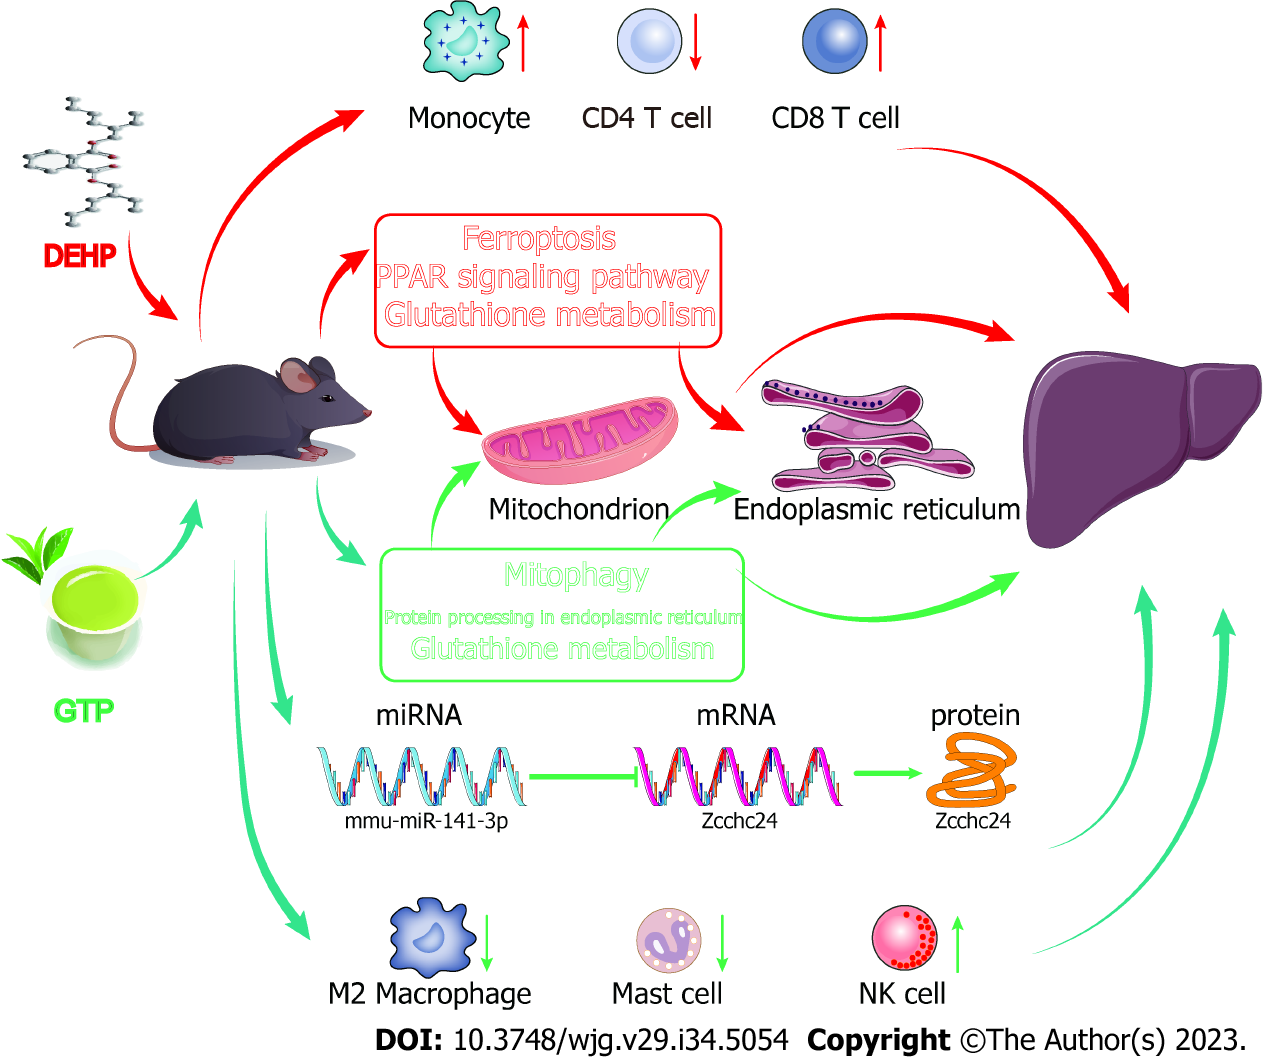
Figure 11 Mechanisms underlying di-(2-ethylhexyl) phthalate exposure-induced liver injury and the therapeutic effects of green tea polyphenols on Di (2-ethylhexyl) phthalate-indued liver injury.
DEHP: Di (2-ethylhexyl) phthalate; GTPs: Green tea polyphenols.
- Citation: Shi H, Zhao XH, Peng Q, Zhou XL, Liu SS, Sun CC, Cao QY, Zhu SP, Sun SY. Green tea polyphenols alleviate di-(2-ethylhexyl) phthalate-induced liver injury in mice. World J Gastroenterol 2023; 29(34): 5054-5074
- URL: https://www.wjgnet.com/1007-9327/full/v29/i34/5054.htm
- DOI: https://dx.doi.org/10.3748/wjg.v29.i34.5054


