Copyright
©The Author(s) 2023.
World J Gastroenterol. Sep 7, 2023; 29(33): 4991-5004
Published online Sep 7, 2023. doi: 10.3748/wjg.v29.i33.4991
Published online Sep 7, 2023. doi: 10.3748/wjg.v29.i33.4991
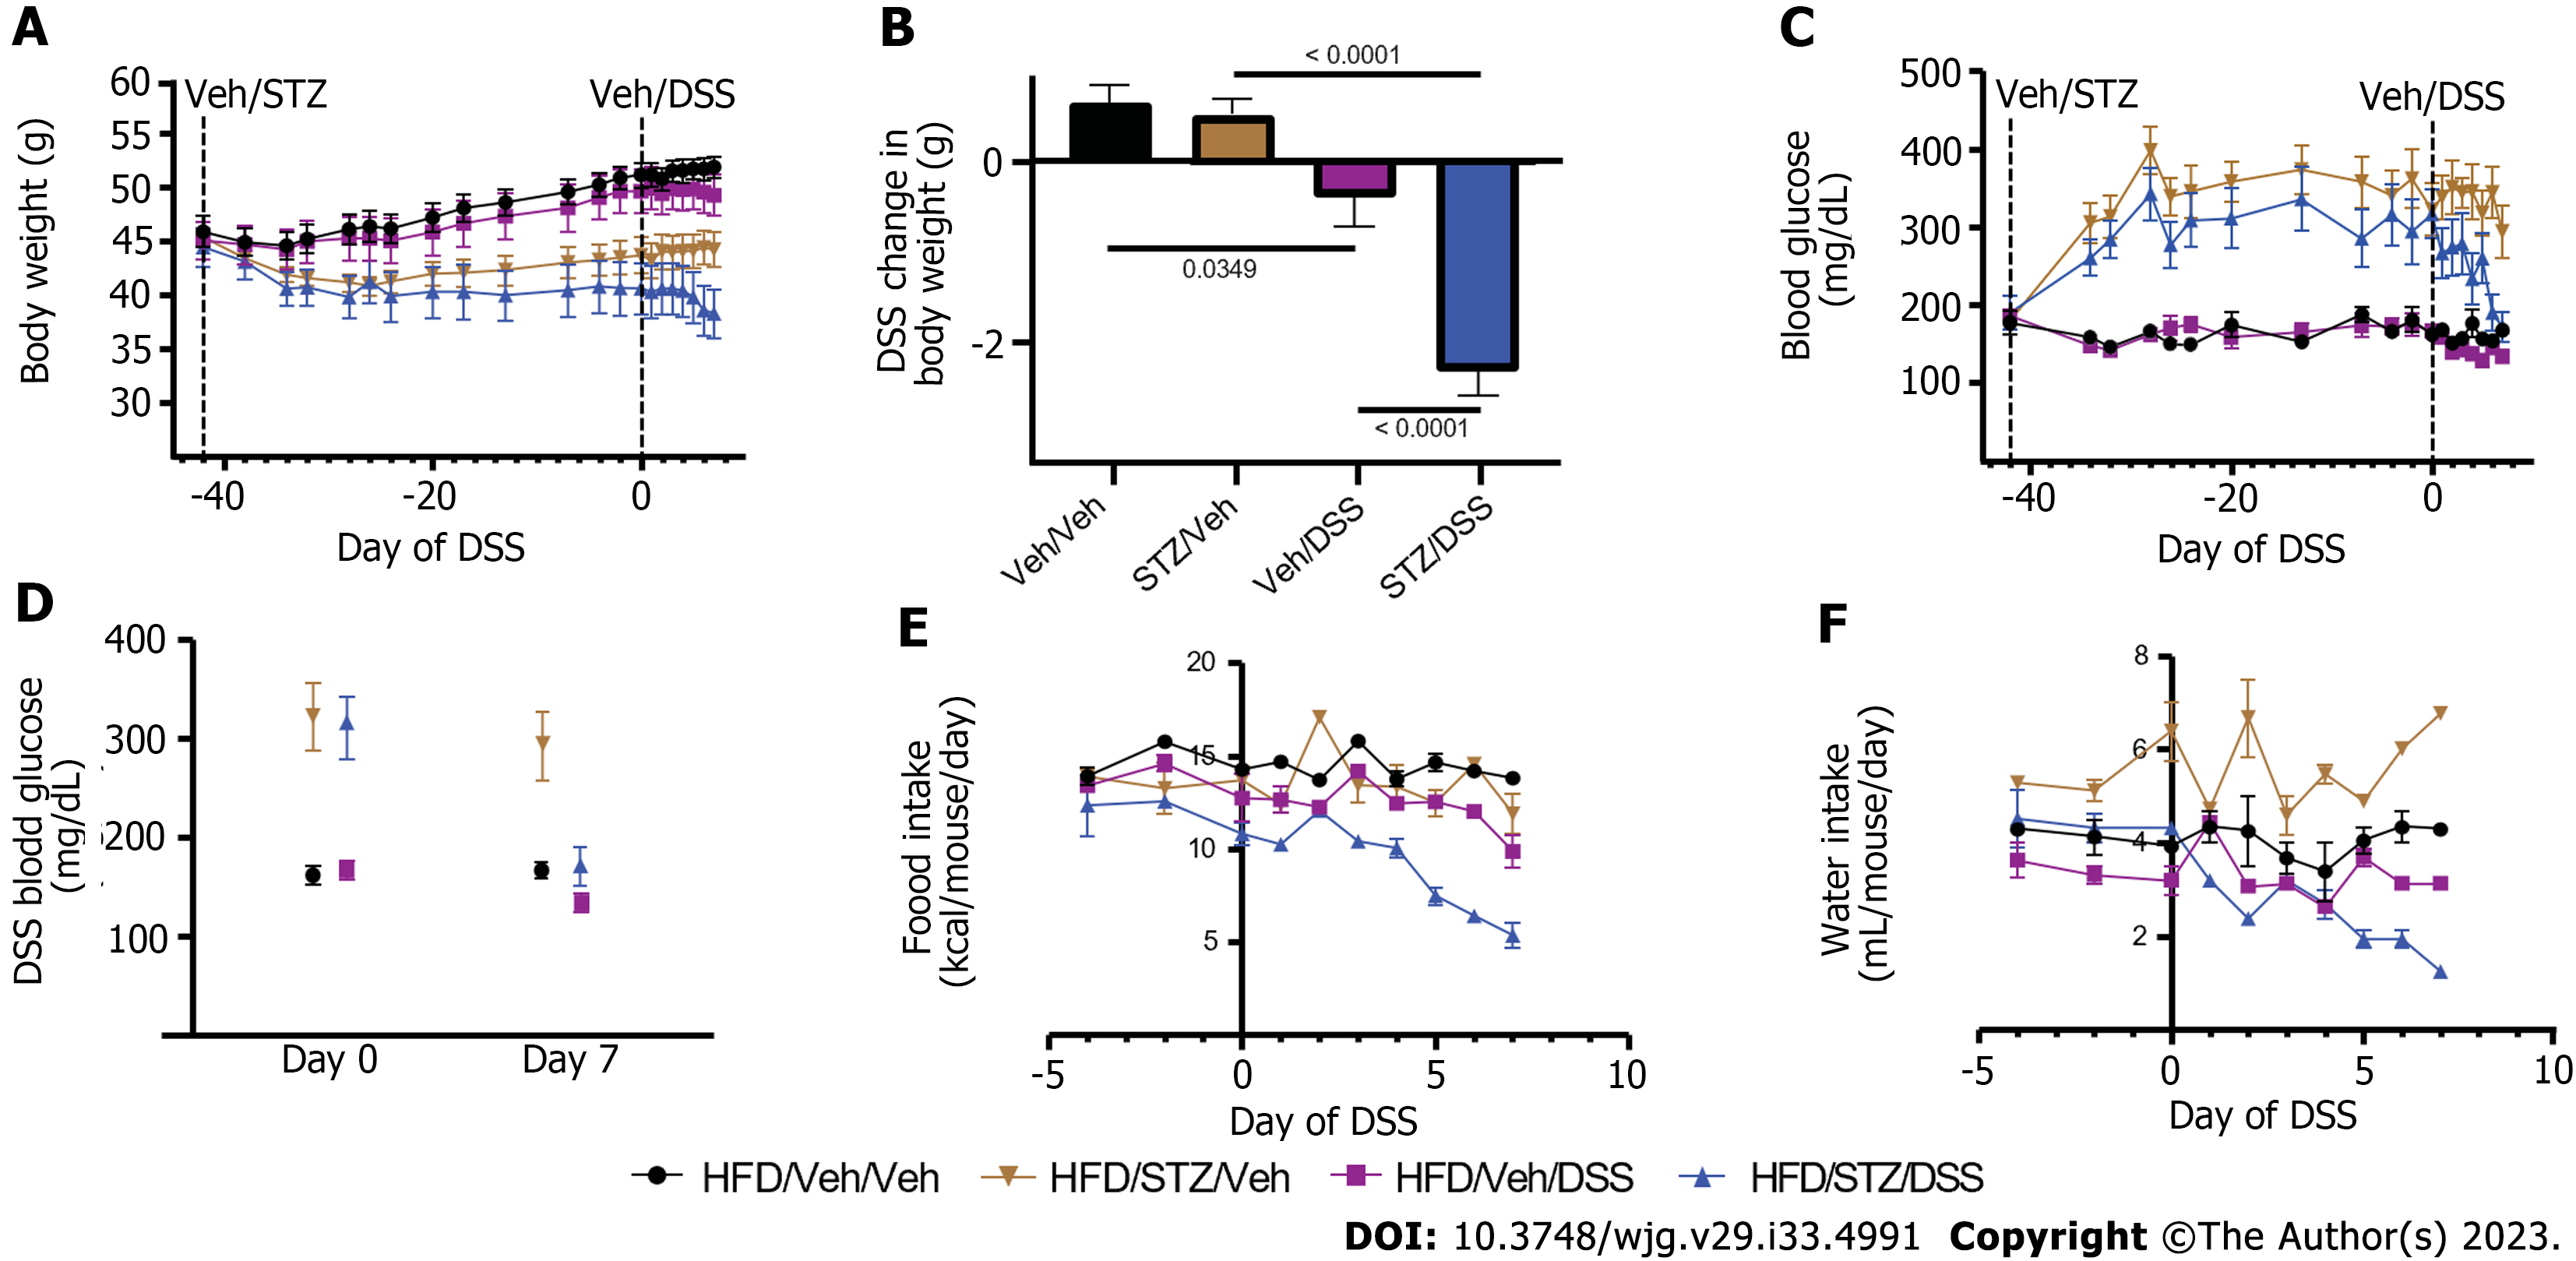
Figure 1 Body weight, blood glucose, food intake, and water consumption in diabetic diet-induced obese mice.
A: Body weight; B: Change in body weight during dextran sodium sulfate (DSS) course; C: Blood glucose; D: Change in blood glucose during the DSS course; E: Food intake; F: Water consumption in high-fat diet-fed, diet-induced obese mice that received either vehicle (Veh) or streptozotocin to induce hyperglycemia and subsequently received Veh or DSS in the drinking water for 7 d to induce colitis. n = 7-8 per group, mean ± standard error of the mean. DSS: Dextran sodium sulfate; Veh: Vehicle; STZ: Streptozotocin.
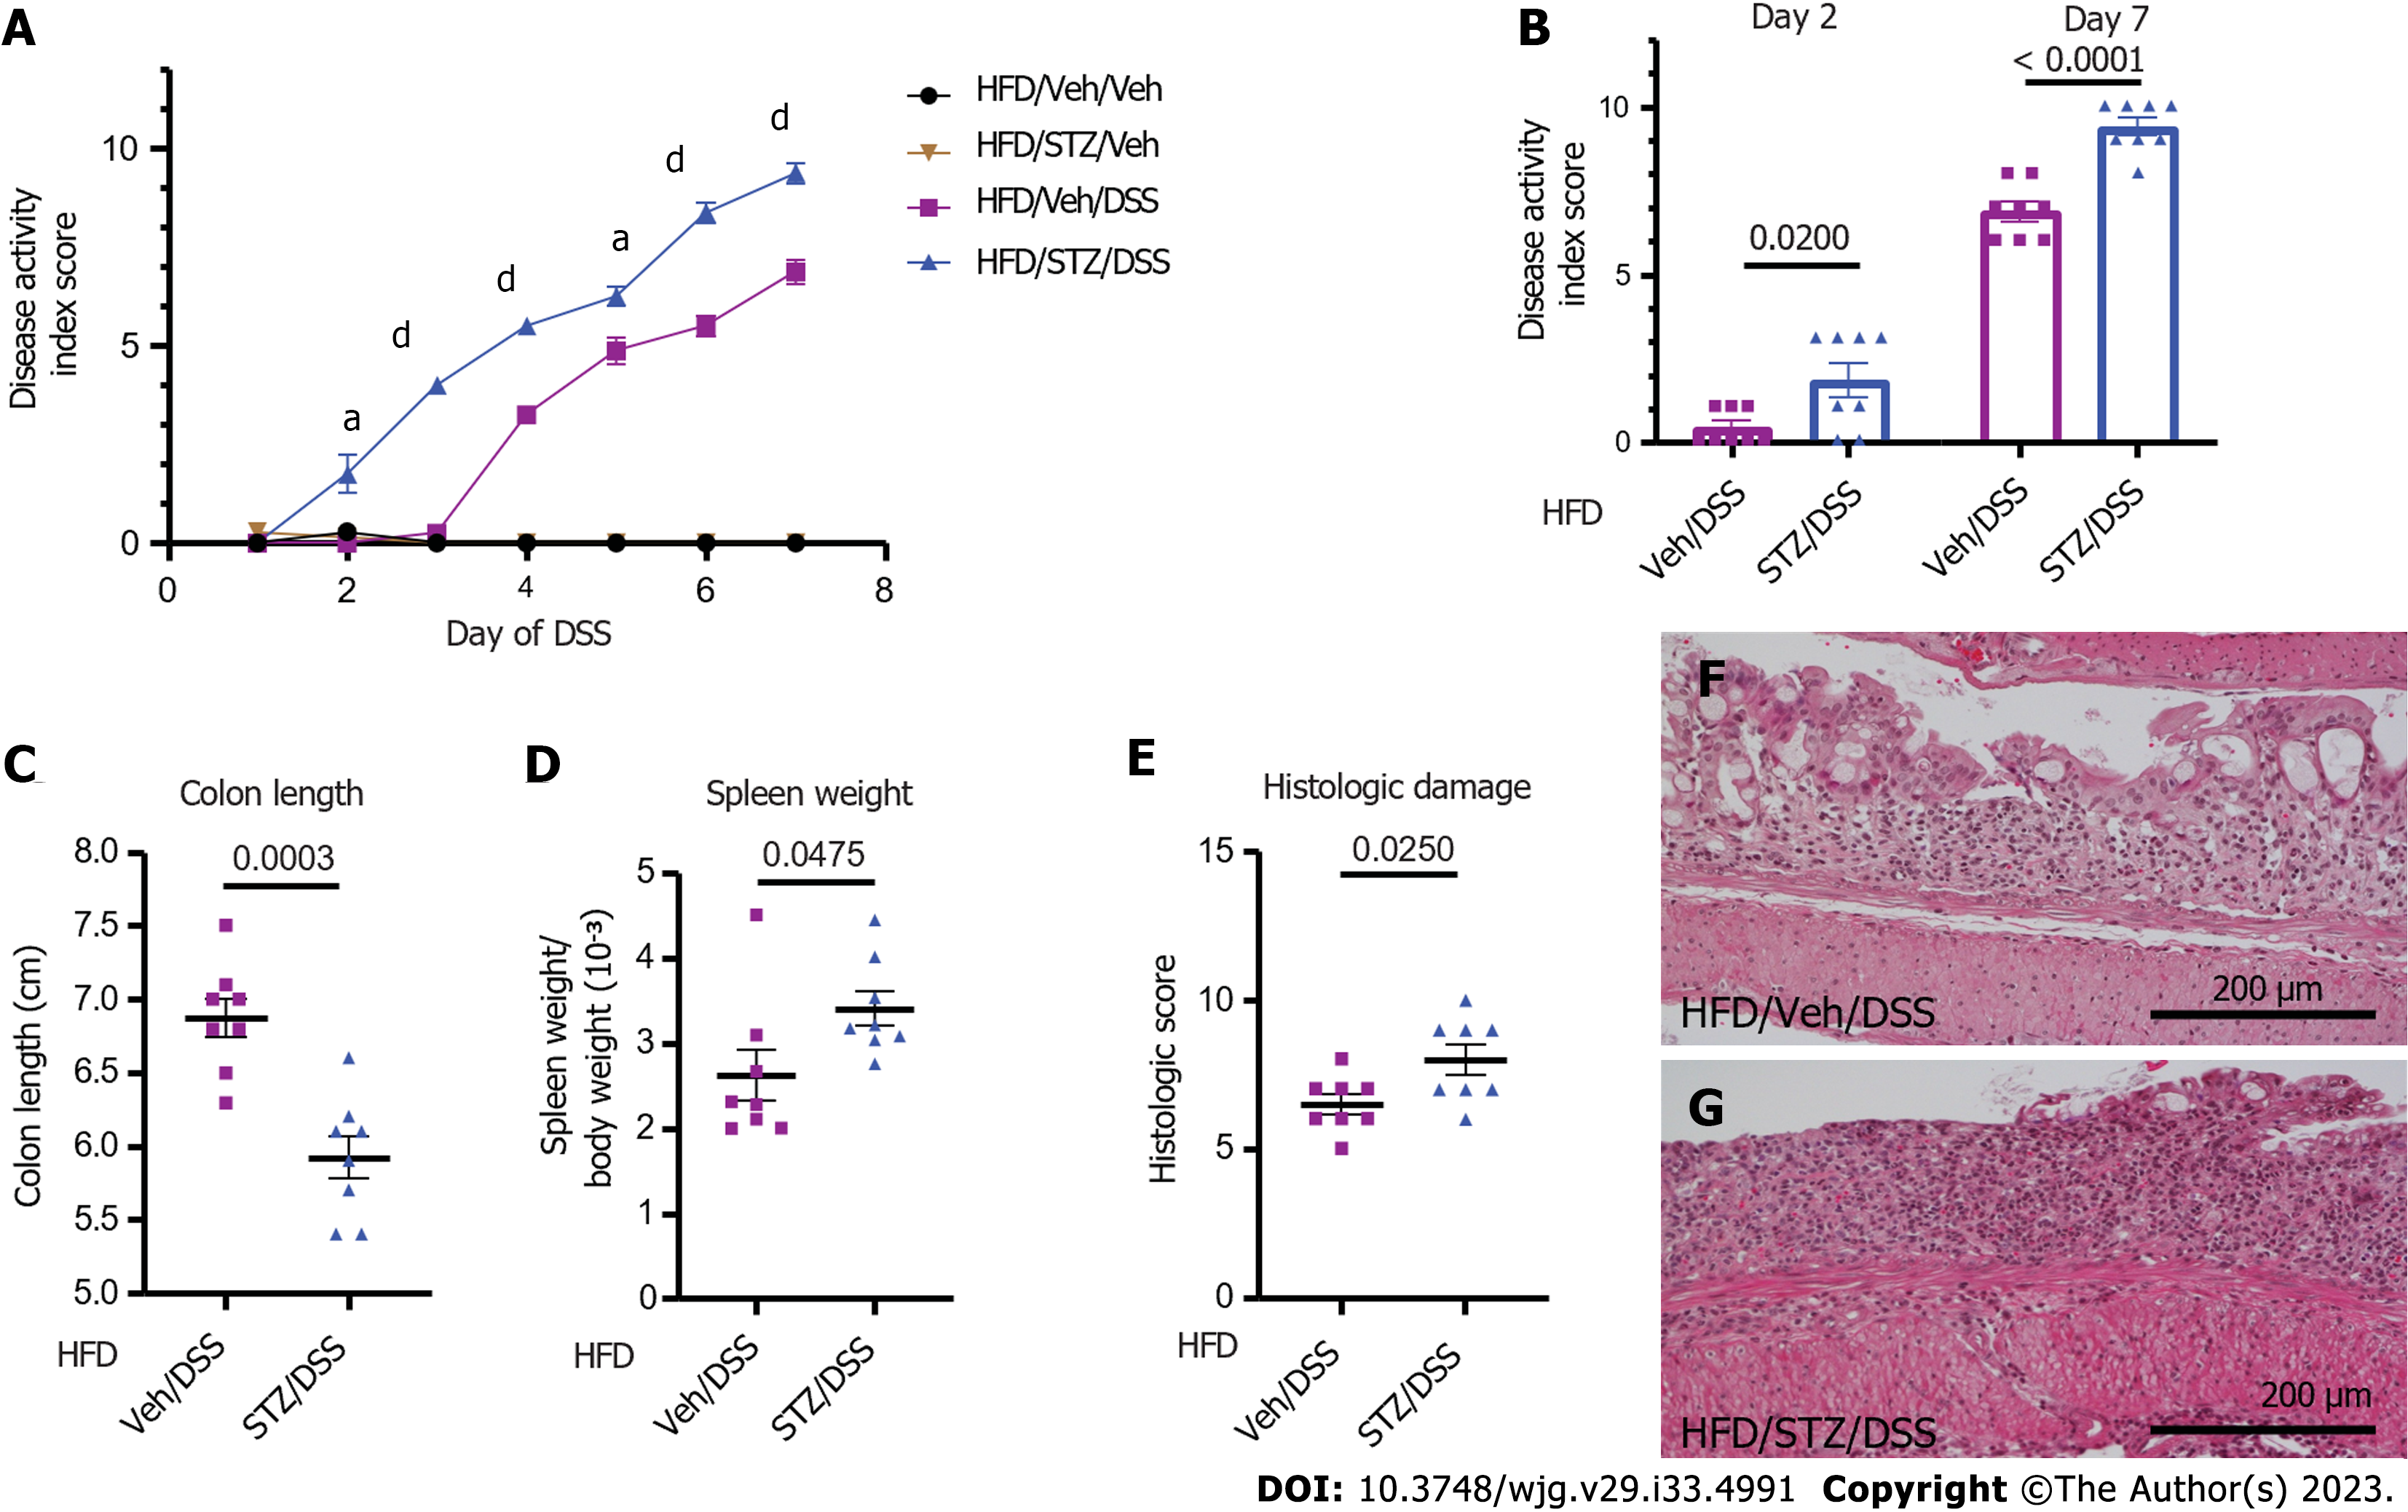
Figure 2 Clinical and pathological outcomes of dextran sodium sulfate colitis in diabetic diet-induced obese mice.
A: Clinical disease activity index scores in high-fat diet (HFD)-fed mice that received either vehicle (Veh) or streptozotocin (STZ) to induce diabetes prior to the dextran sodium sulfate (DSS) course; B: Quantification on days 2 and 7; C: Colon length; D: Spleen weight-to-body weight ratio on day 7 of DSS; E: Histologic scoring of DSS damage in colonic tissues from HFD-fed normoglycemic Veh and hyperglycemic STZ mice treated with DSS; F: Representative × 20 images of normoglycemic Veh mice; G: Hyperglycemic STZ mice. n = 7-8 per group, mean ± standard error of the mean. In (A), aP < 0.05, dP < 0.0001 and comparison noted in (A) is between HFD/Veh/DSS and HFD/STZ/DSS groups for days 2-7 of DSS. DSS: Dextran sodium sulfate; Veh: Vehicle; STZ: Streptozotocin; HFD: High-fat diet.
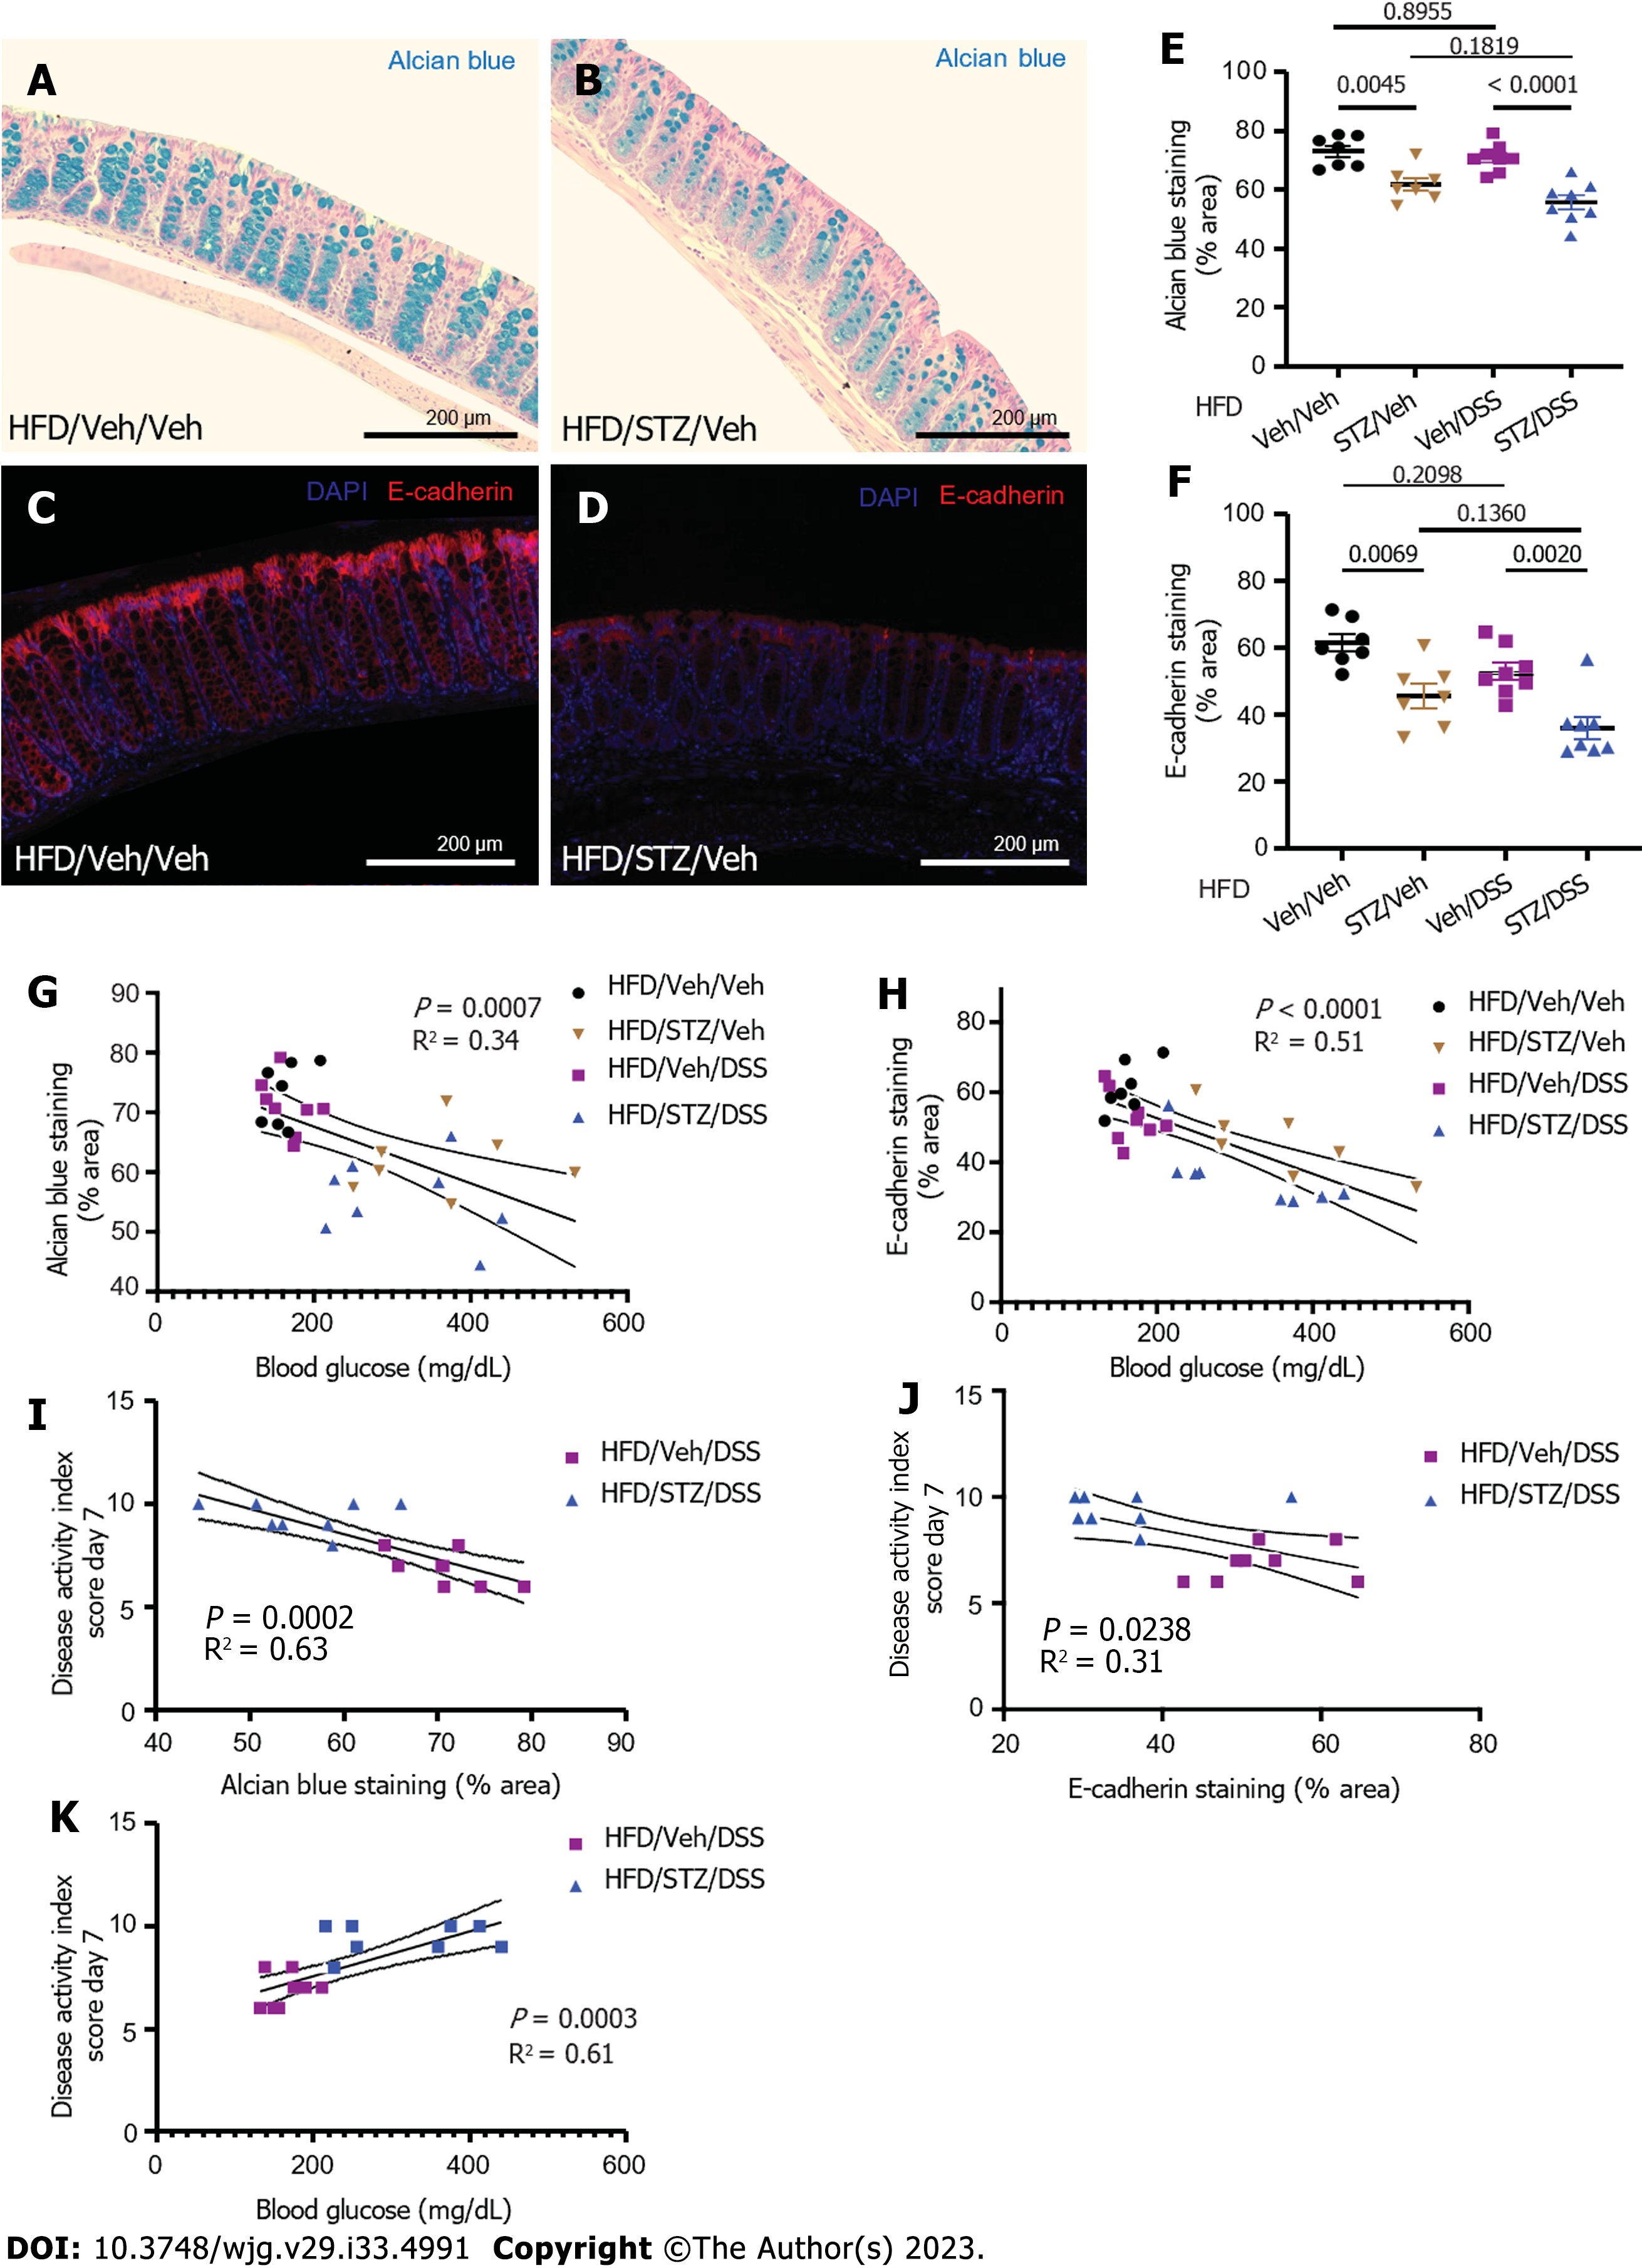
Figure 3 Colonic mucin barrier and tight junction protein abundance in diabetes and dextran sodium sulfate colitis in diet-induced obese mice.
A: Alcian blue (AB) staining highlighted the colonic mucin barrier in normoglycemic mice; B: AB staining highlights the colonic mucin barrier in hyperglycemic mice; C: AB staining in areas of the colon with intact epithelium was quantified for each treatment group that received vehicle (Veh)/streptozotocin (STZ) and/or Veh/dextran sodium sulfate (DSS). D: Tight junction protein E-cadherin was highlighted by immunohistochemical staining in the colons of normoglycemic mice; E: Tight junction protein E-cadherin is highlighted by immunohistochemical staining in the colons of hyperglycemic mice; F: E-cadherin abundance in areas of the colon with intact epithelium was quantified for each experimental treatment group; G: Correlation of degree of hyperglycemia with AB staining; H: Correlation of degree of hyperglycemia with E-cadherin staining; I: Correlation of AB staining with clinical colitis disease severity in DSS-treated groups; J: Correlation of E-cadherin staining with clinical colitis disease severity in DSS-treated groups; K: Correlation of degree of hyperglycemia with colitis disease severity in DSS-treated groups. n = 7-8 per group, mean ± standard error of the mean. DSS: Dextran sodium sulfate; Veh: Vehicle; STZ: Streptozotocin; HFD: High-fat diet.
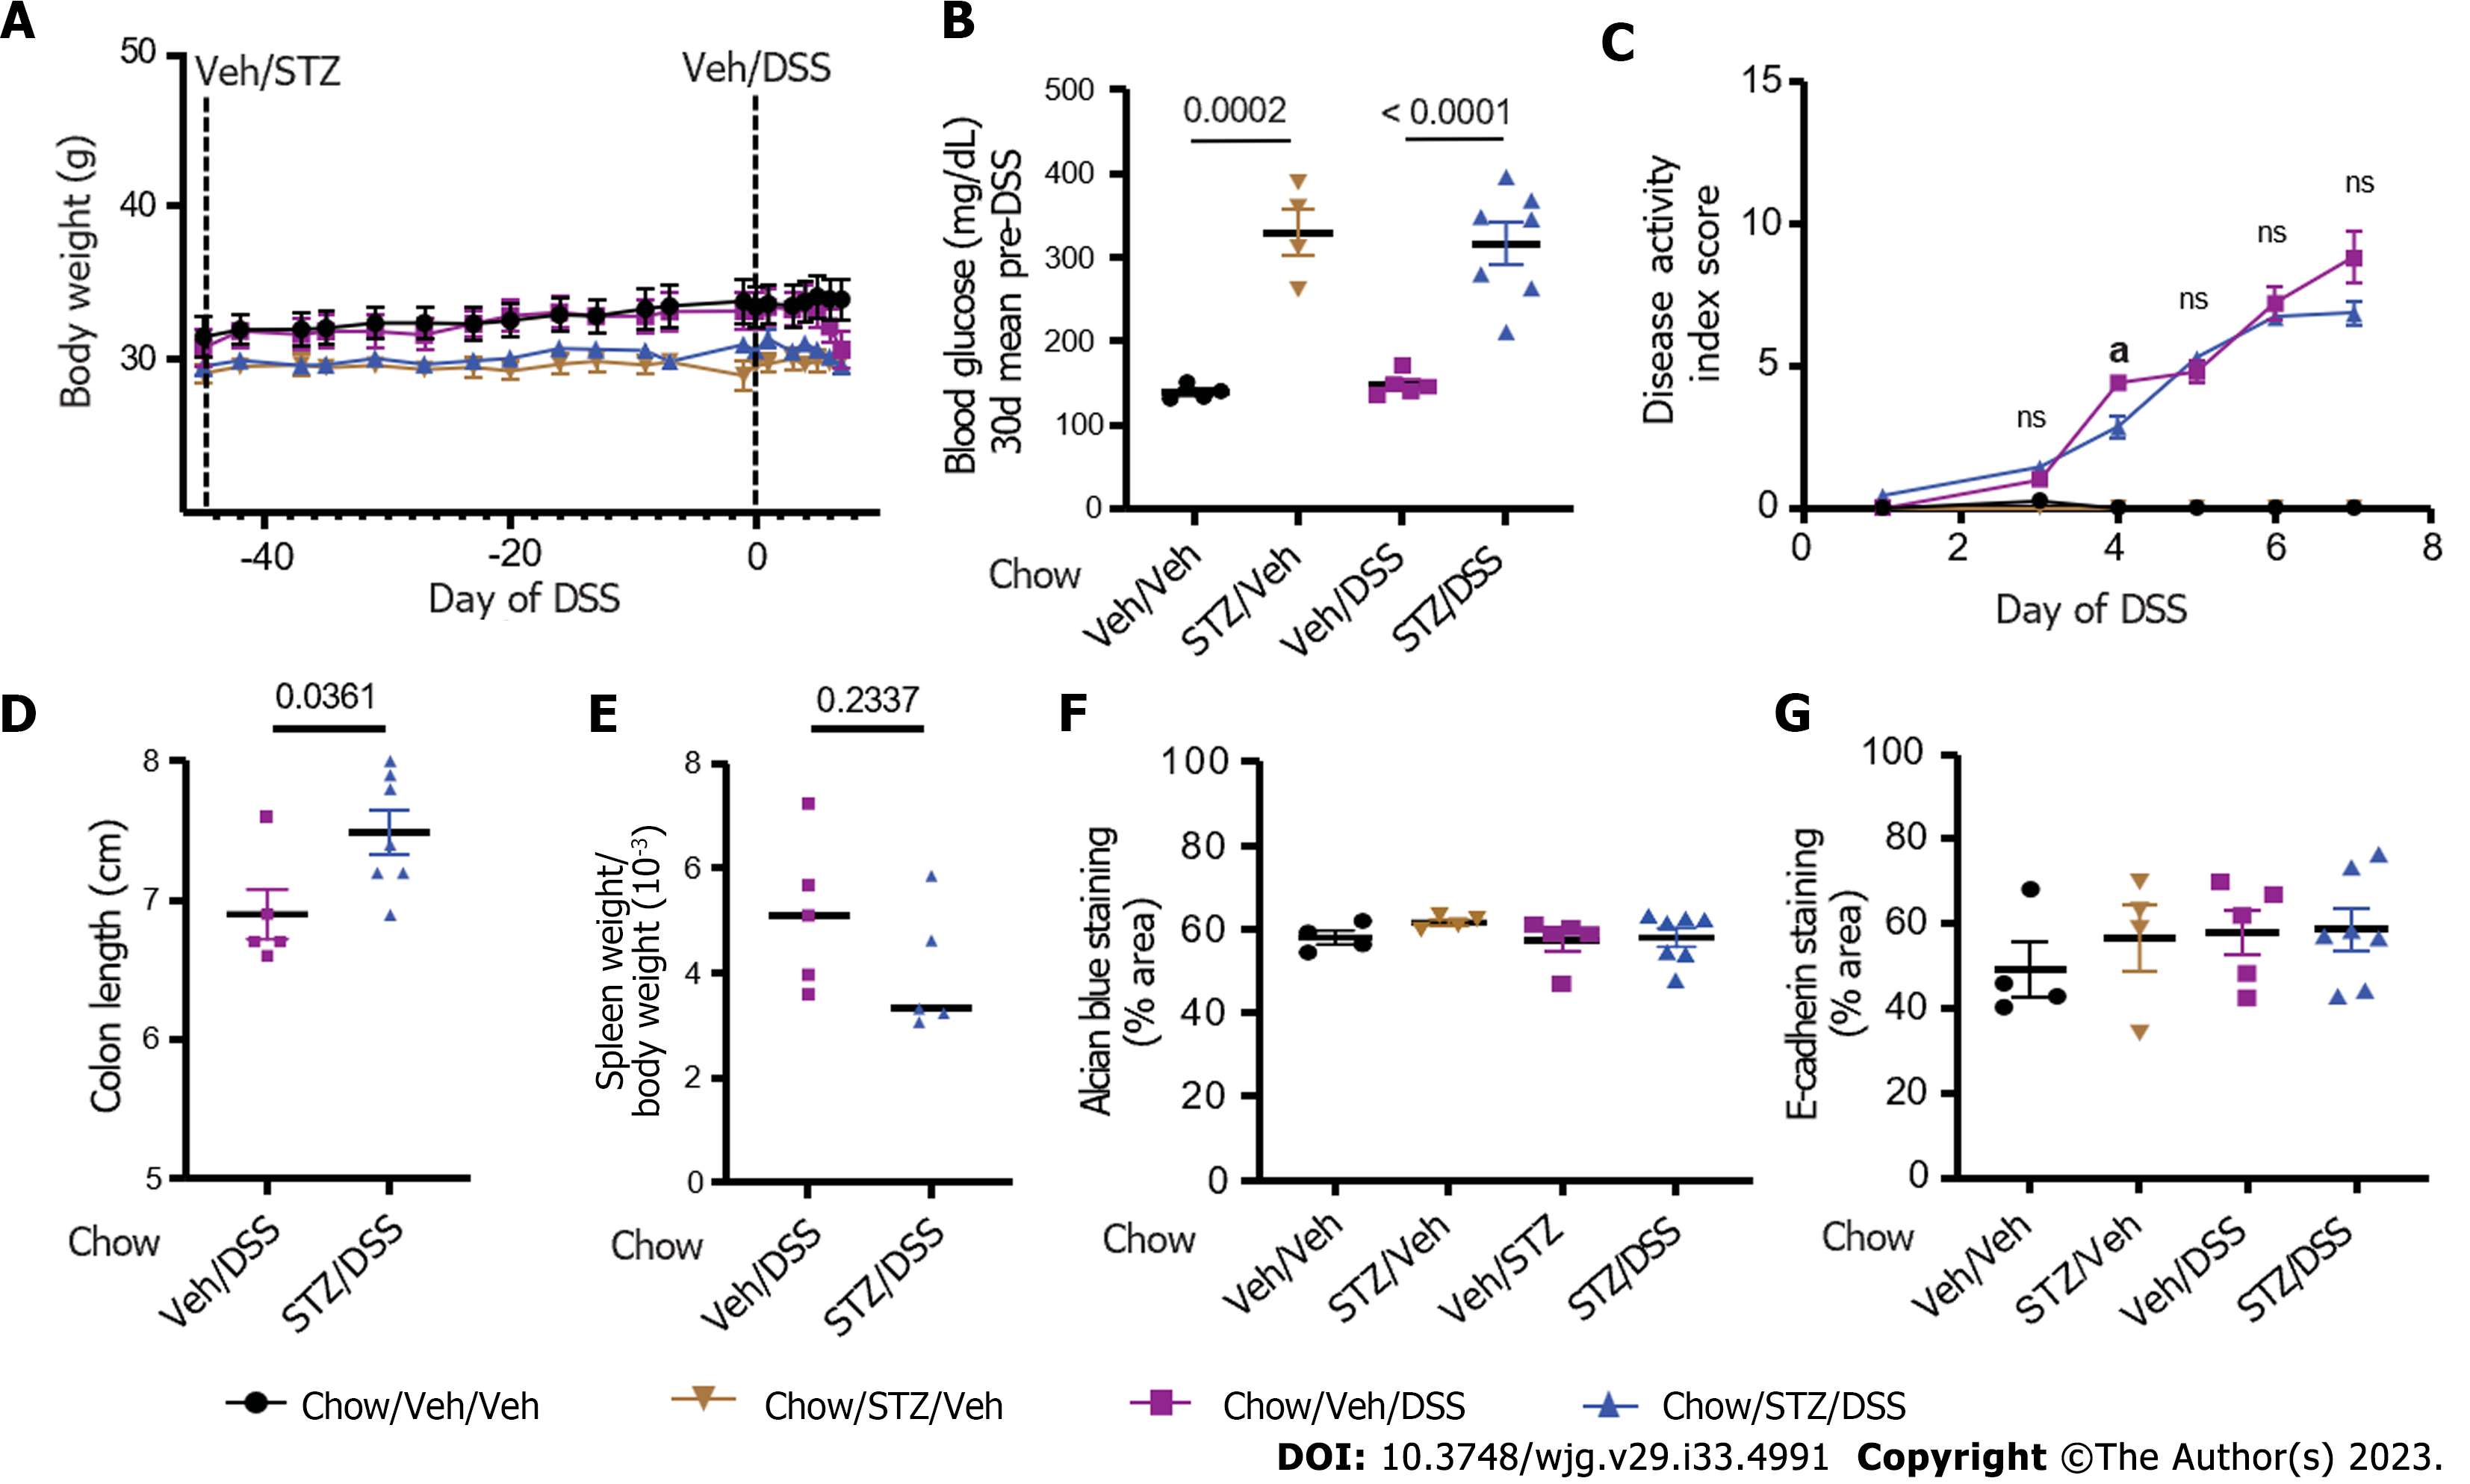
Figure 4 Body weight, blood glucose, clinical disease activity, histopathologic disease activity, and intestinal barrier integrity in diabetic chow-fed mice.
A: Body weight; B: Blood glucose in chow-fed non-obese mice that received either vehicle (Veh) or streptozotocin (STZ) to induce diabetes and were then given dextran sodium sulfate (DSS) to induce colitis; C: Clinical DSS colitis disease activity scores in normoglycemic and hyperglycemic mice; D: Colon length; E: Spleen weight-to-body weight ratios; F: Colonic Alcian blue staining; G: Tight junction protein E-cadherin staining quantified from areas with intact colonic epithelium. n = 4-7 per group, mean ± standard error of the mean. aP < 0.05, and comparison noted in (C) is between chow/Veh/DSS and chow/STZ/DSS groups for days 3-7 of DSS. DSS: Dextran sodium sulfate; Veh: Vehicle; STZ: Streptozotocin.
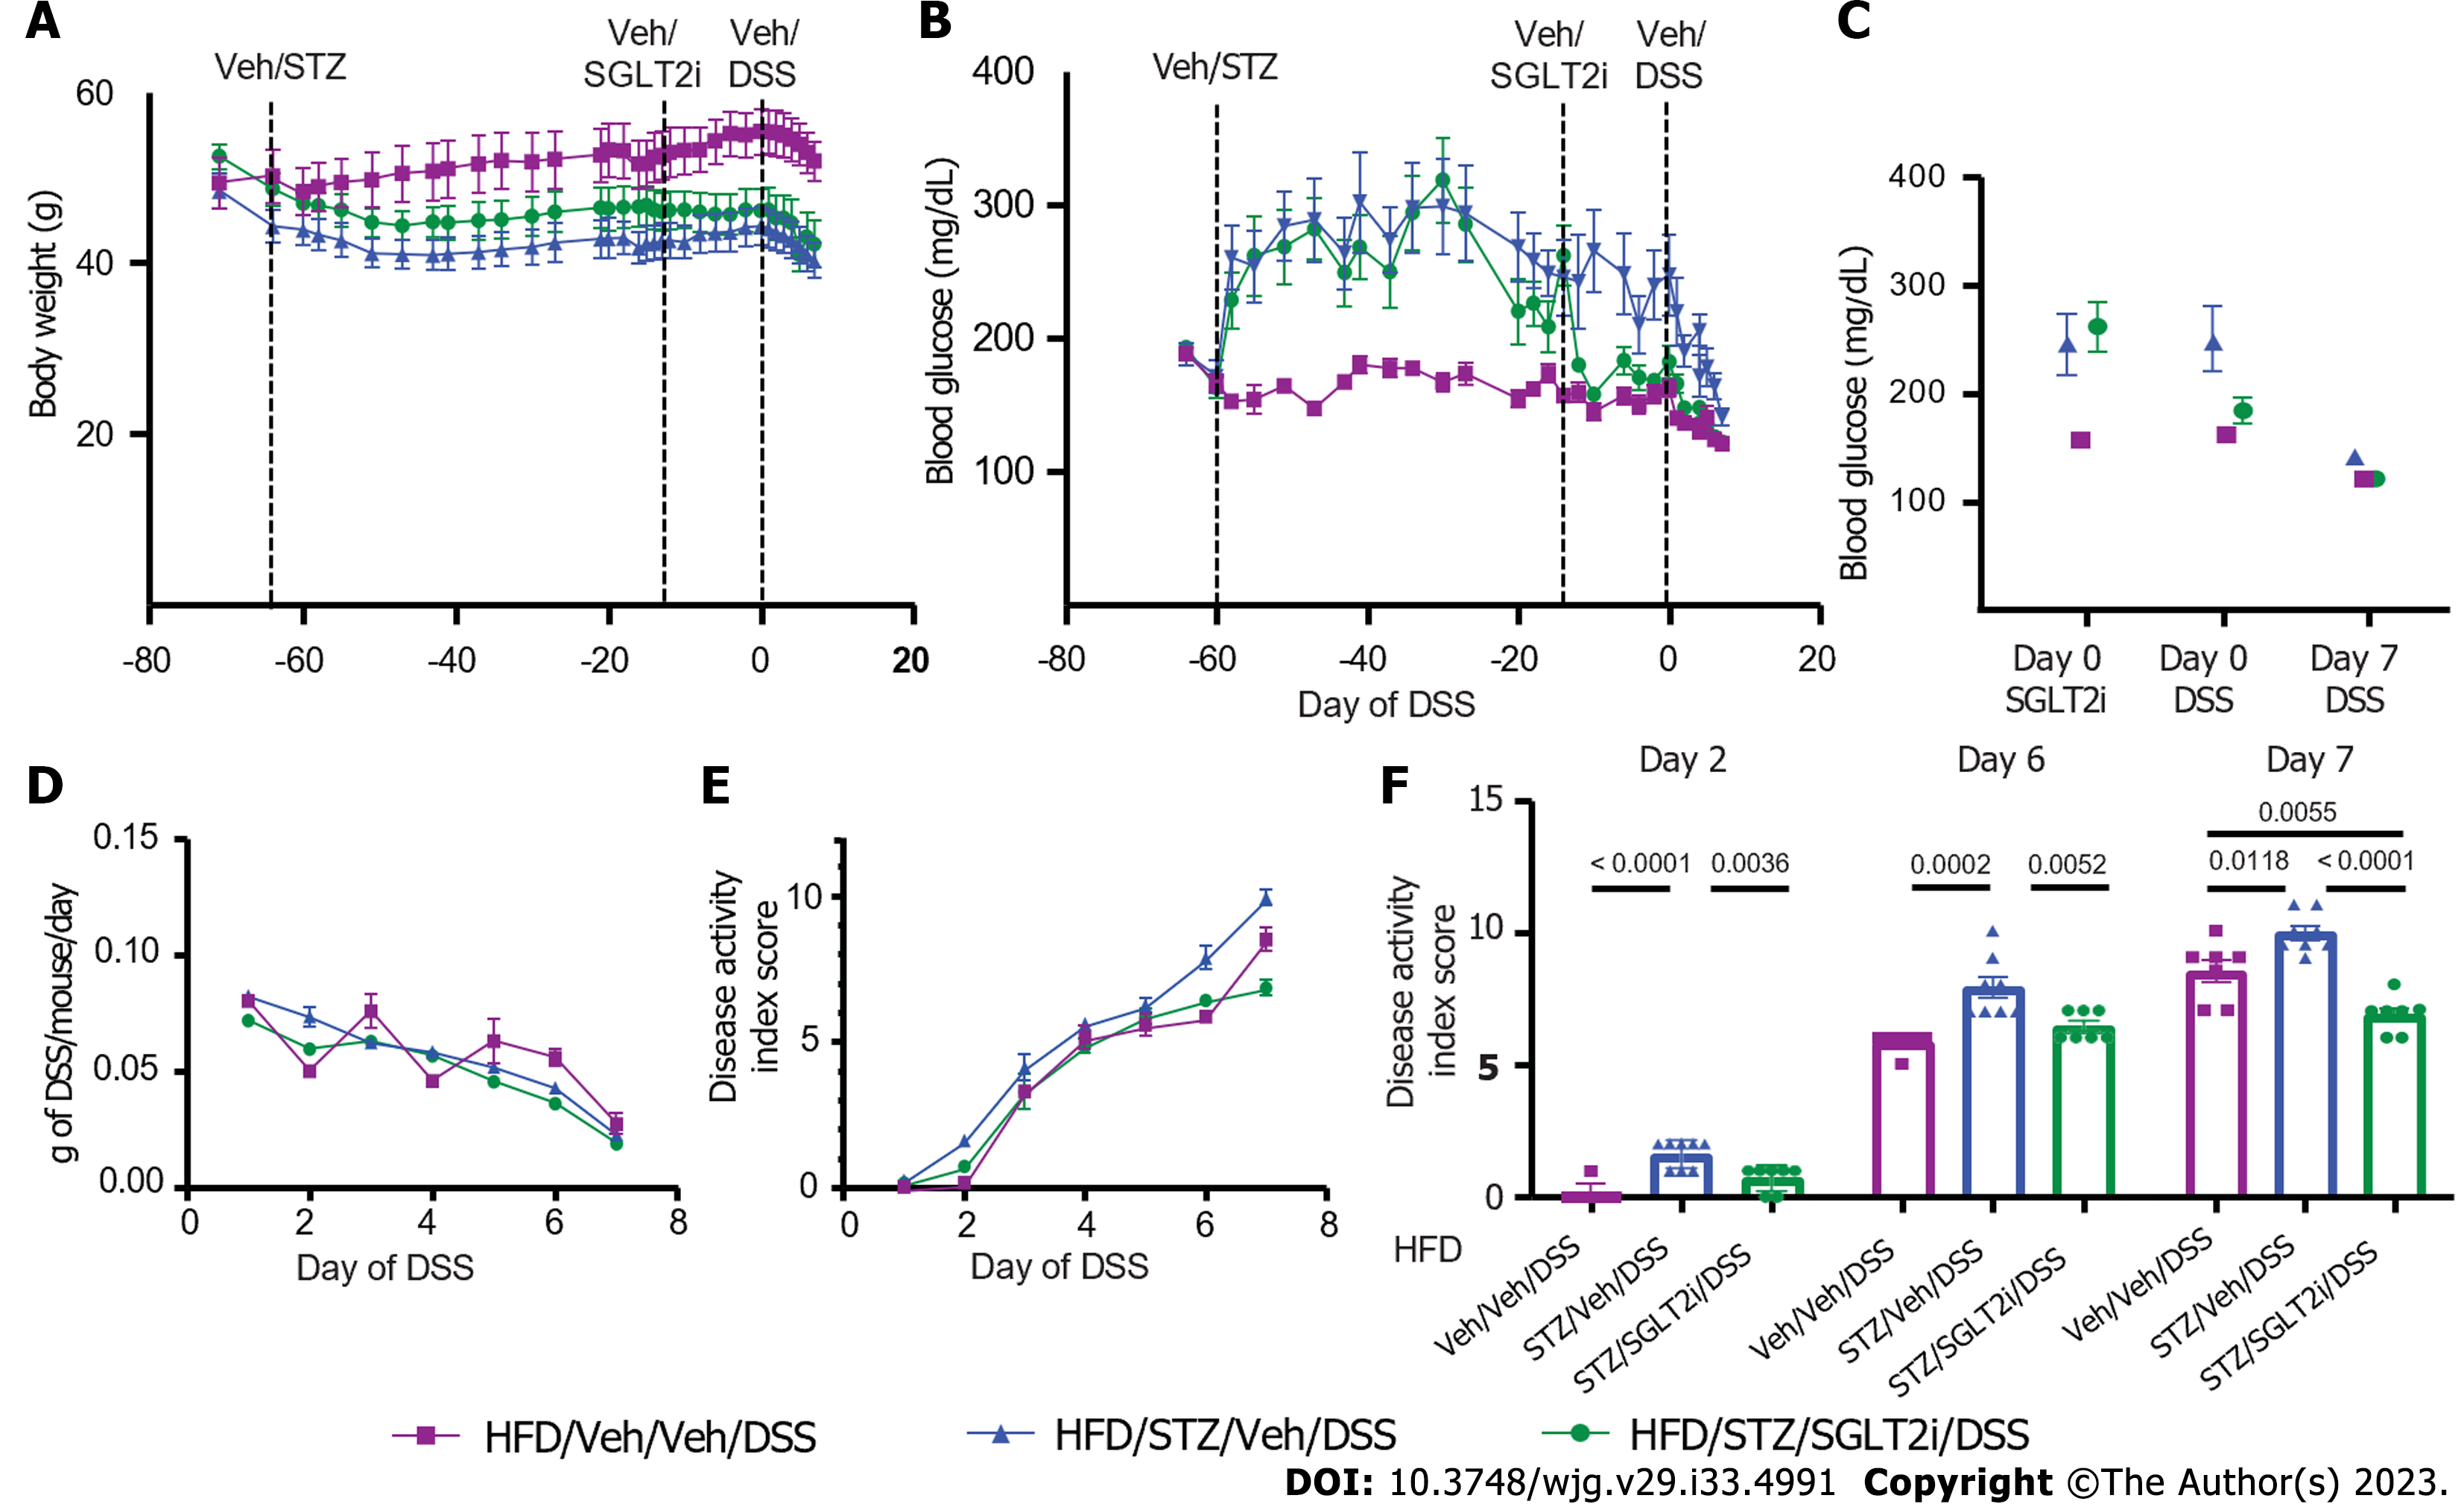
Figure 5 Body weight, blood glucose, and dextran sodium sulfate colitis activity in diabetic diet-induced obese mice on antidiabetic treatment.
A: Body weight; B: Blood glucose; C: Change in blood glucose in high-fat diet-fed mice that received either vehicle (Veh) or streptozotocin to induce diabetes and were then treated with the sodium-glucose cotransporter-2 inhibitor dapagliflozin or Veh, prior to dextran sodium sulfate (DSS) colitis onset; D: Amount of DSS consumed during the DSS course; E: DSS colitis disease activity index scores through the 7 d course of DSS; F: DSS colitis disease activity index scores quantified on days 2, 6, and 7. n = 7-8 per group, mean ± standard error of the mean. DSS: Dextran sodium sulfate; Veh: Vehicle; STZ: Streptozotocin; HFD: High-fat diet.
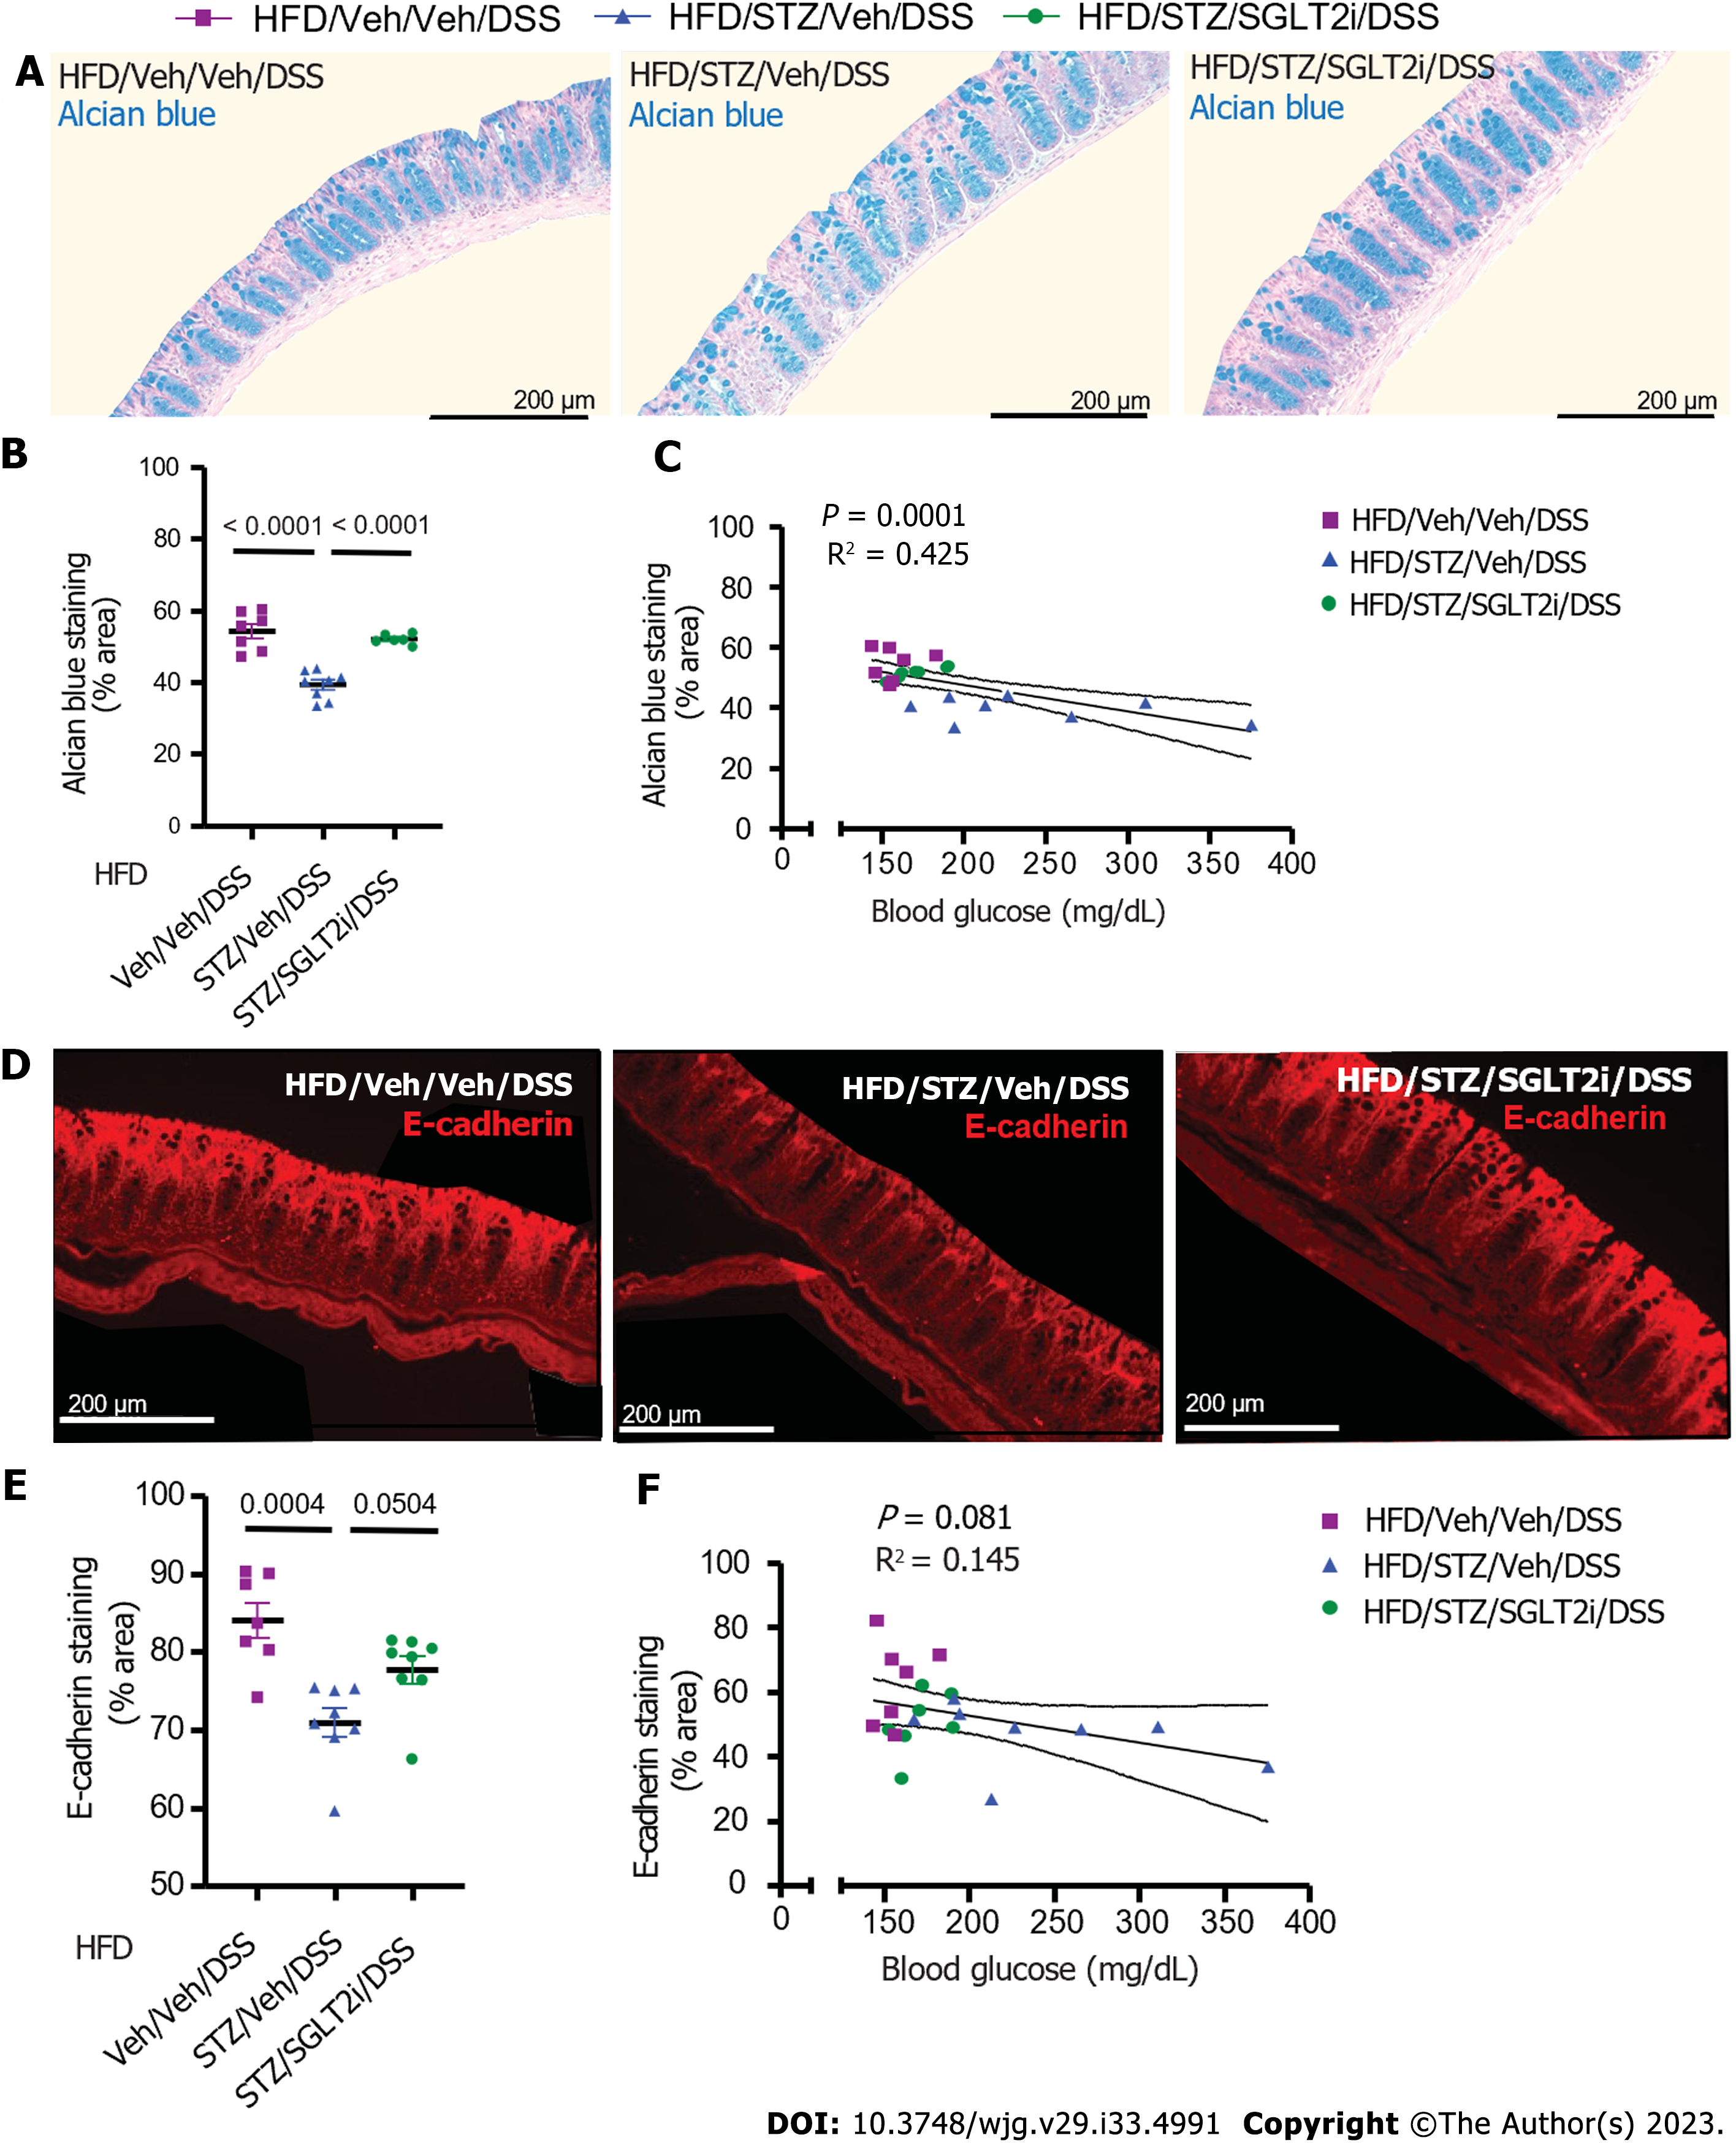
Figure 6 Colonic mucin barrier and tight junction protein abundance in diet-induced obese mice on antidiabetic treatment with dextran sodium sulfate colitis.
A: Alcian blue (AB) staining highlighted the colonic mucin barrier in high-fat diet (HFD)-fed mice administered either vehicle (Veh) or streptozotocin (STZ), followed by antidiabetic treatment with Veh or a sodium-glucose cotransporter-2 inhibitor (SGLT2i) prior to the dextran sodium sulfate (DSS) course; B: AB staining following the DSS course in areas of the colon with intact epithelium was quantified for each treatment group that received Veh/STZ or Veh/SGLT2i; C: Correlation of degree of hyperglycemia with AB staining; D: Tight junction protein E-cadherin staining in the same HFD-fed, DSS-treated mice that received Veh/STZ and Veh/SGLT2i; E: E-cadherin abundance following the DSS course in areas of the colon with intact epithelium; F: Correlation of degree of hyperglycemia with E-cadherin abundance. n = 7-8 per group, mean ± standard error of the mean. DSS: Dextran sodium sulfate; Veh: Vehicle; STZ: Streptozotocin; HFD: High-fat diet; SGLT2i: Sodium-glucose cotransporter-2 inhibitor.
- Citation: Francis KL, Alonge KM, Pacheco MC, Hu SJ, Krutzsch CA, Morton GJ, Schwartz MW, Scarlett JM. Diabetes exacerbates inflammatory bowel disease in mice with diet-induced obesity. World J Gastroenterol 2023; 29(33): 4991-5004
- URL: https://www.wjgnet.com/1007-9327/full/v29/i33/4991.htm
- DOI: https://dx.doi.org/10.3748/wjg.v29.i33.4991


