Copyright
©The Author(s) 2023.
World J Gastroenterol. Sep 7, 2023; 29(33): 4975-4990
Published online Sep 7, 2023. doi: 10.3748/wjg.v29.i33.4975
Published online Sep 7, 2023. doi: 10.3748/wjg.v29.i33.4975
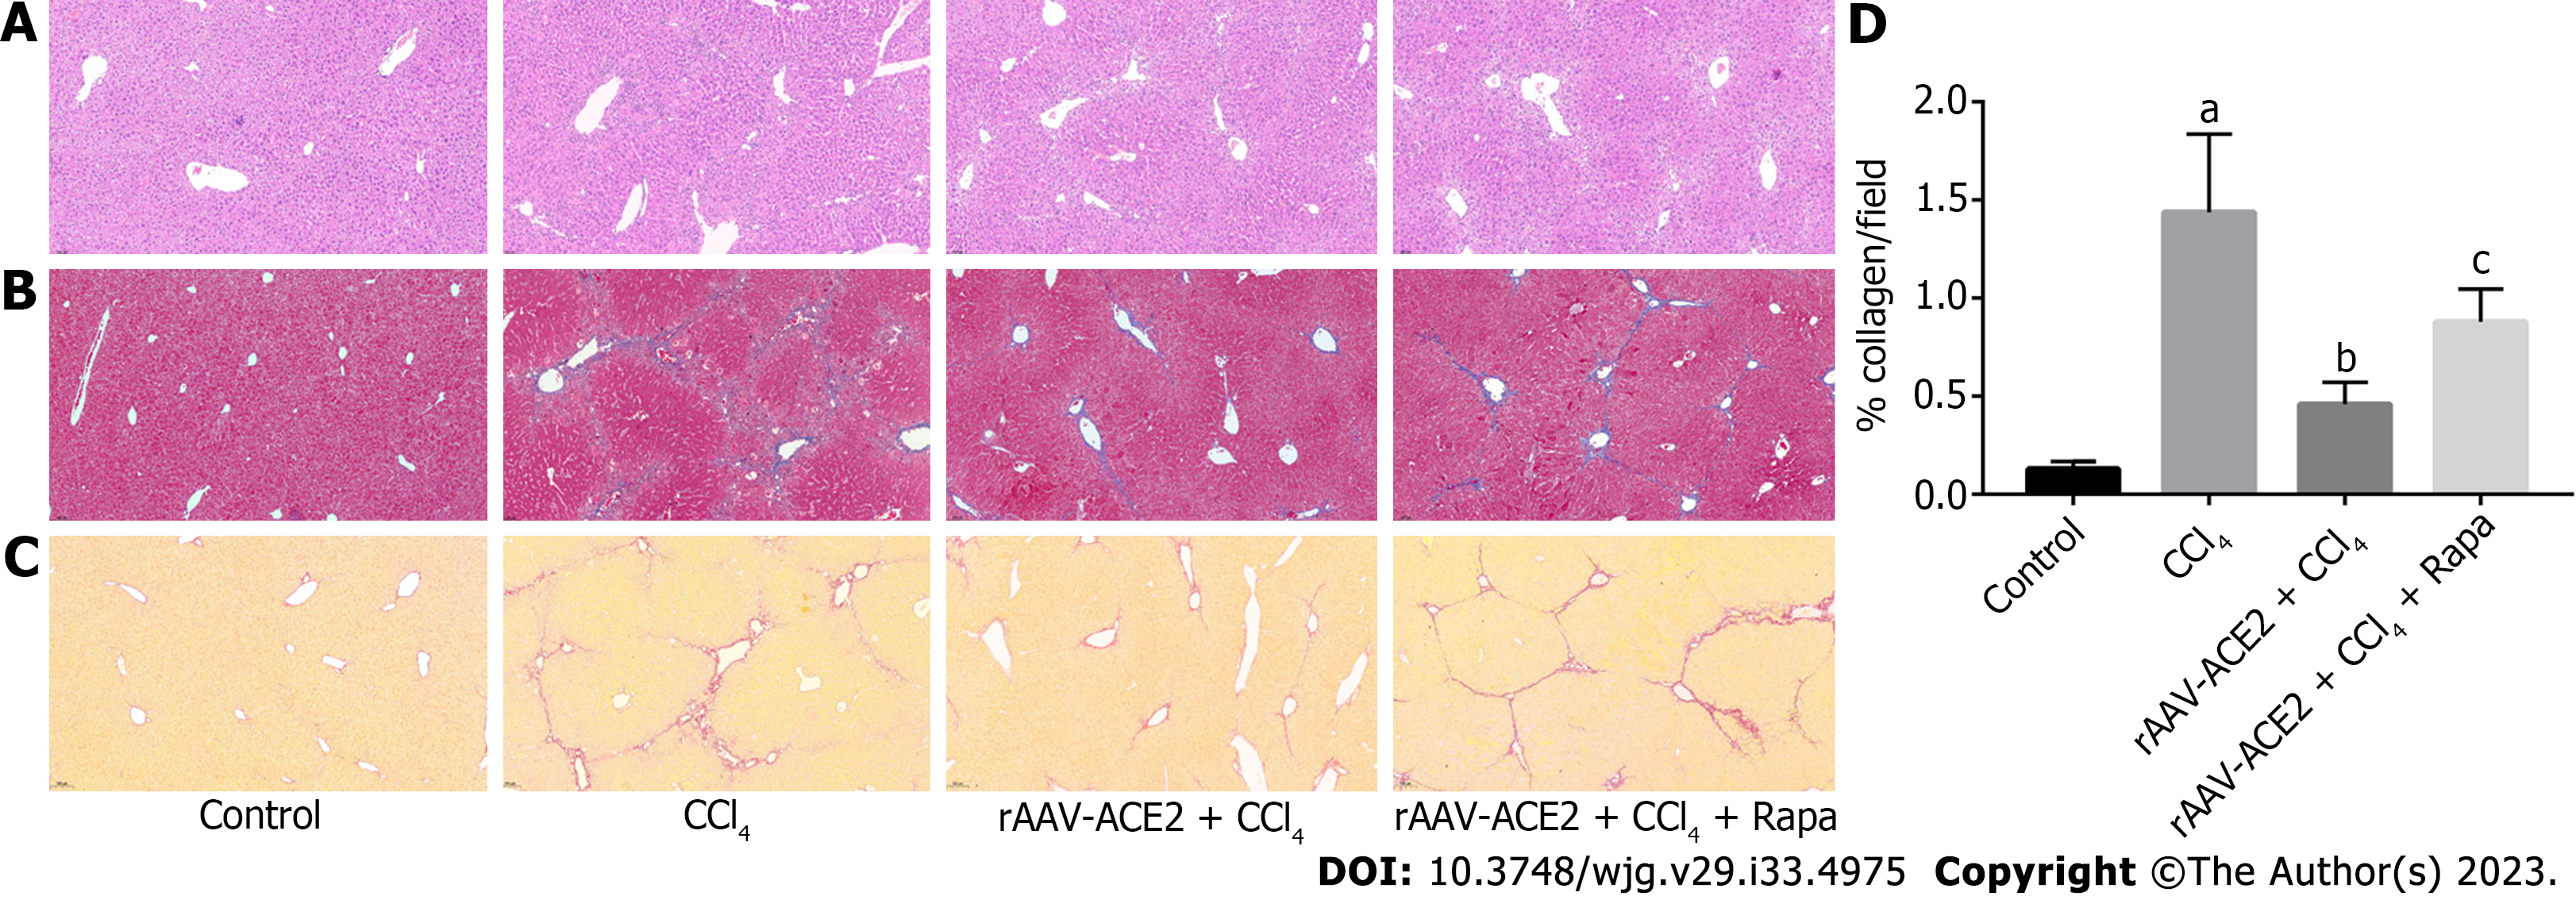
Figure 1 Pathological changes in mouse liver tissues after rAAV-Angiotensin-converting enzyme 2 treatment (magnification × 100).
A: Effect of rAAV-ACE2 treatment on liver fibrosis in mice was assessed by Hematoxylin and eosin staining; B: Effect of rAAV-ACE2 treatment on liver fibrosis in mice was assessed by Masson trichrome staining; C: Effect of rAAV-ACE2 treatment on liver fibrosis in mice was assessed by Sirius red staining; D: The quantity of collagen production in each group was analyzed using Image-Pro Plus 6.0. aP < 0.01 vs Control; bP < 0.05 vs CCl4; cP < 0.05 vs rAAV-ACE2 + CCl4. Rapa: Rapamycin; ACE2: Angiotensin-converting enzyme 2.
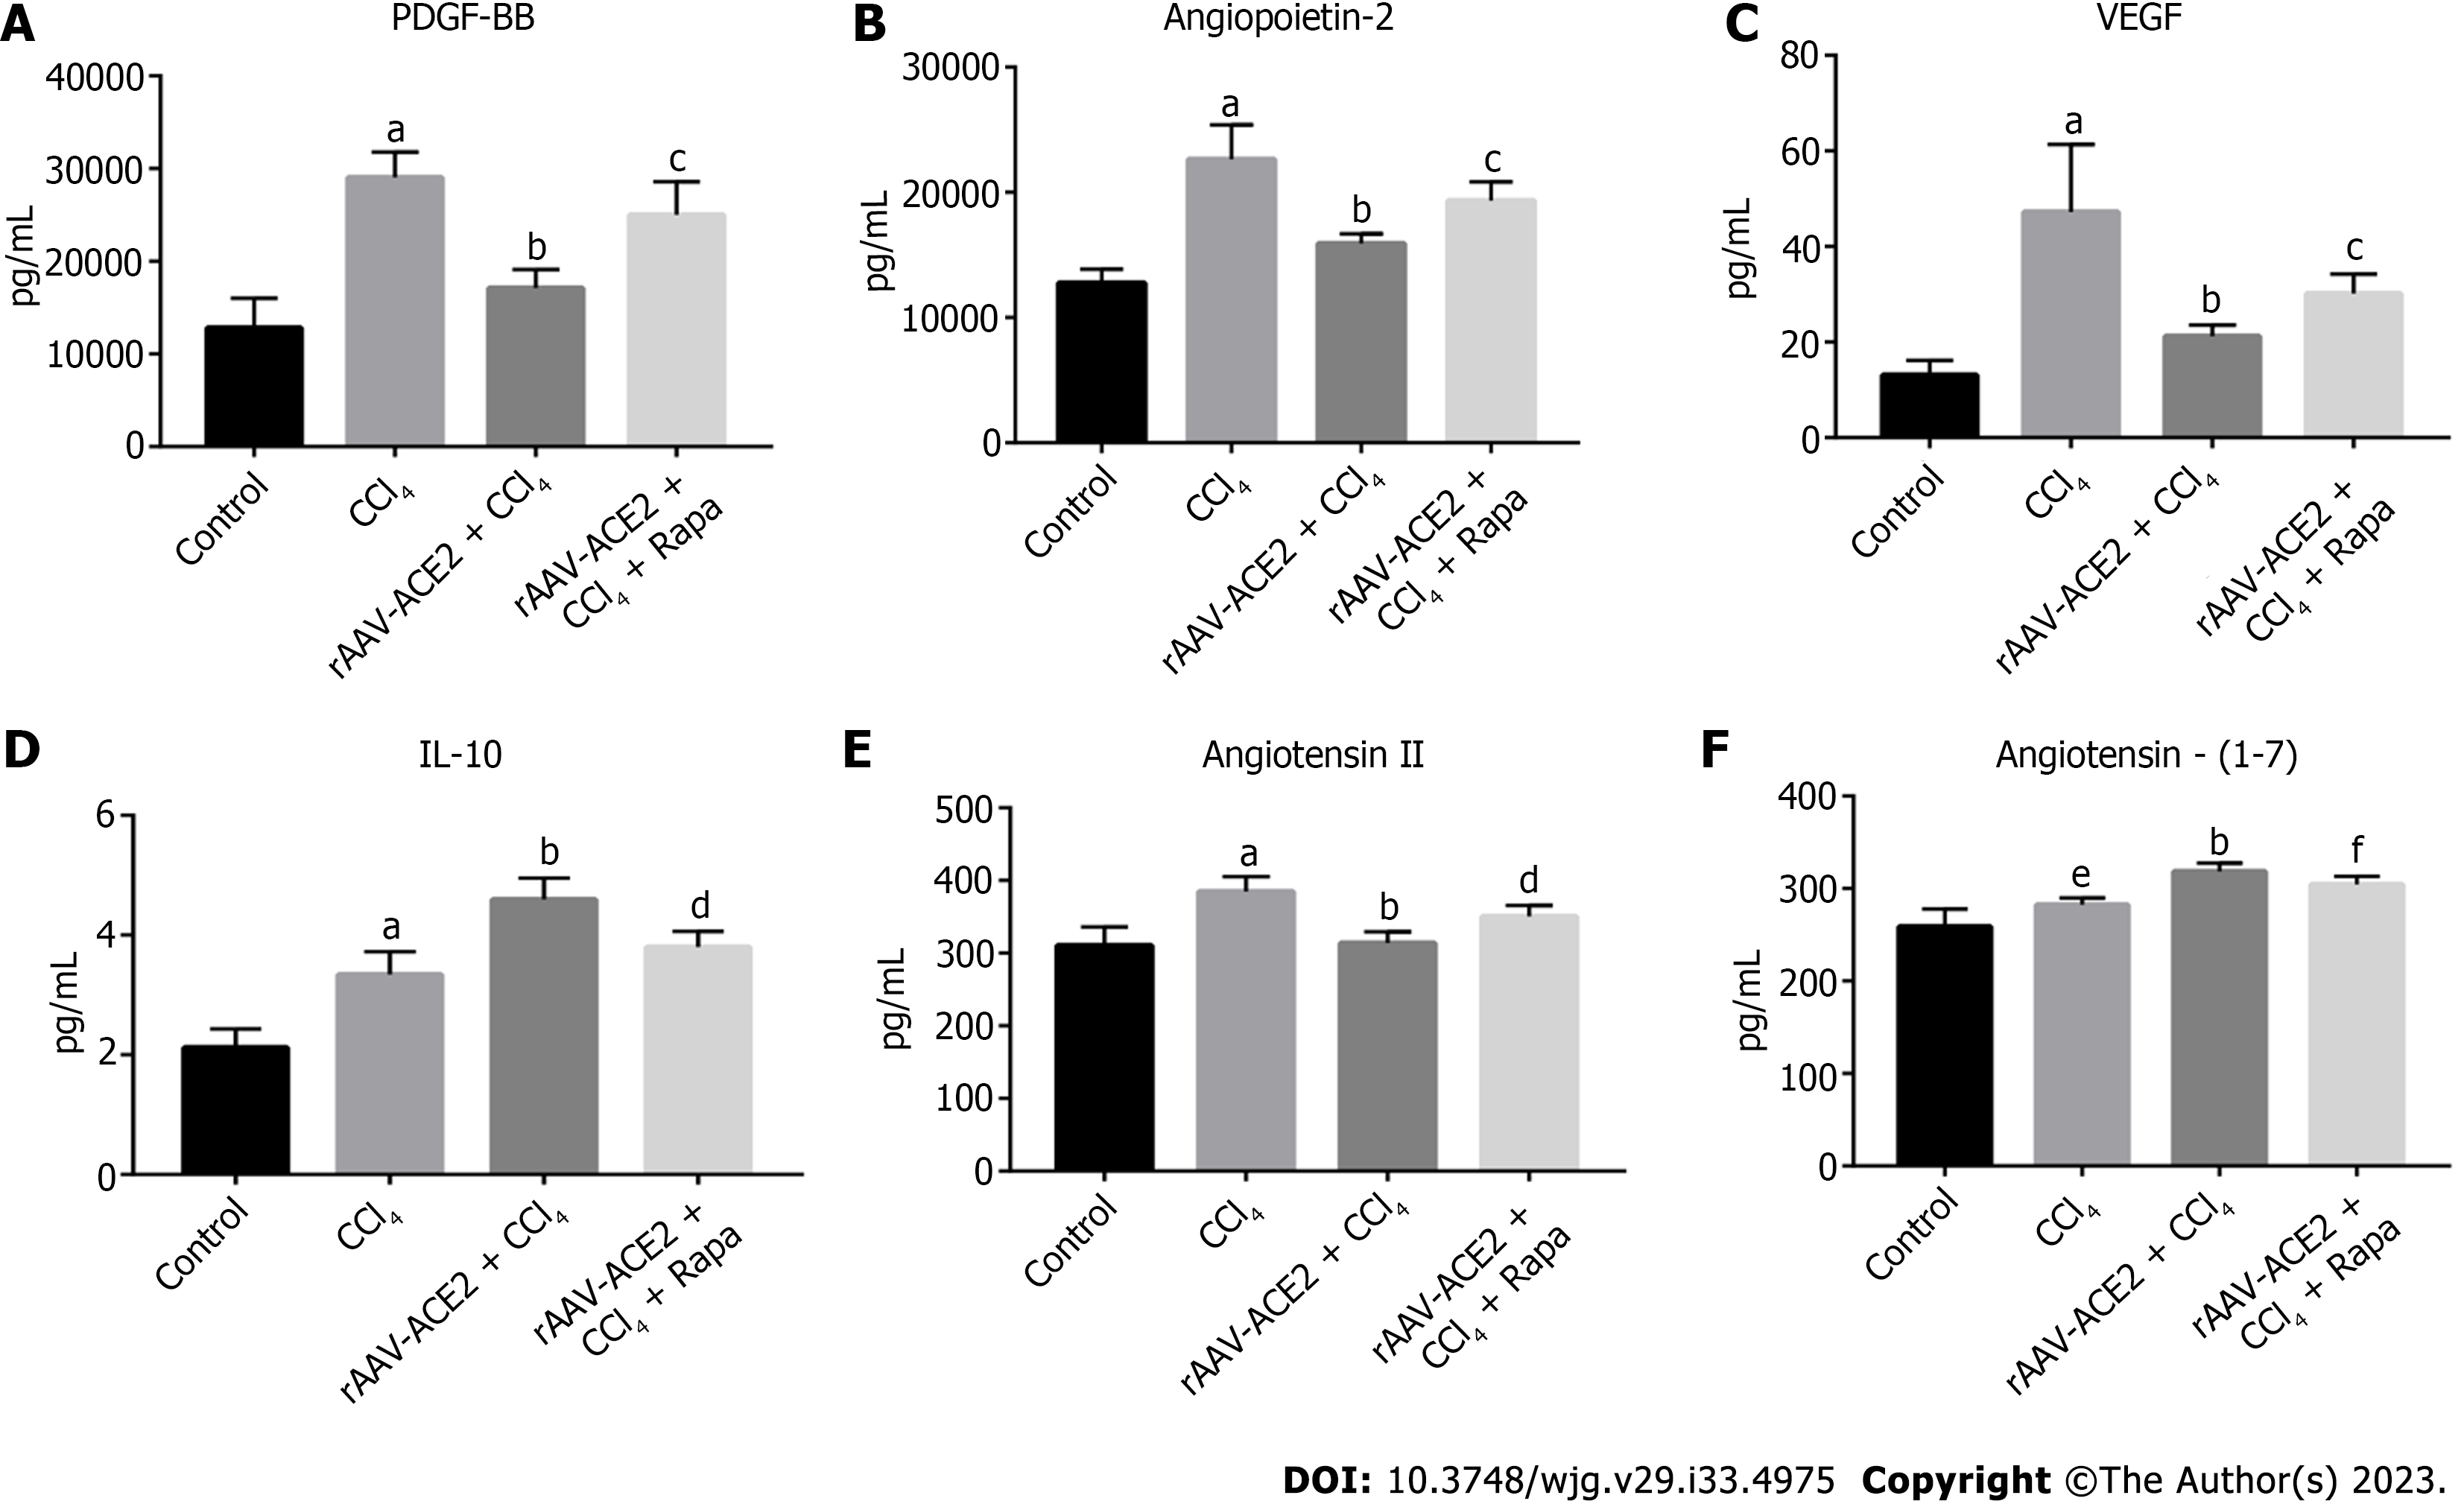
Figure 2 Effect of rAAV-Angiotensin-converting enzyme 2 treatment on the levels of multiple biomarkers in mouse serum.
A: The level of platelet-derived growth factor BB in each group was measured by Luminex assay; B: The level of angiopoietin-2 in each group was measured by Luminex assay; C: The level of vascular endothelial growth factor in each group was measured by Luminex assay; D: The level of interleukin-10 in each group was measured by Luminex assay; E: The level of angiotensin II in each group was measured by Enzyme Linked Immunosorbent Assay; F: The level of angiotensin- (1-7) in each group was measured by Enzyme Linked Immunosorbent Assay. aP < 0.001 vs Control; bP < 0.001 vs CCl4; cP < 0.001 vs rAAV-ACE2 + CCl4; dP < 0.01 vs rAAV-ACE2 + CCl4; eP < 0.01 vs Control; fP < 0.05 vs rAAV-ACE2 + CCl4. Rapa: Rapamycin; PDGF-BB: Platelet-derived growth factor BB; VEGF: Vascular endothelial growth factor; IL-10: Interleukin-10; ACE2: Angiotensin-converting enzyme 2.
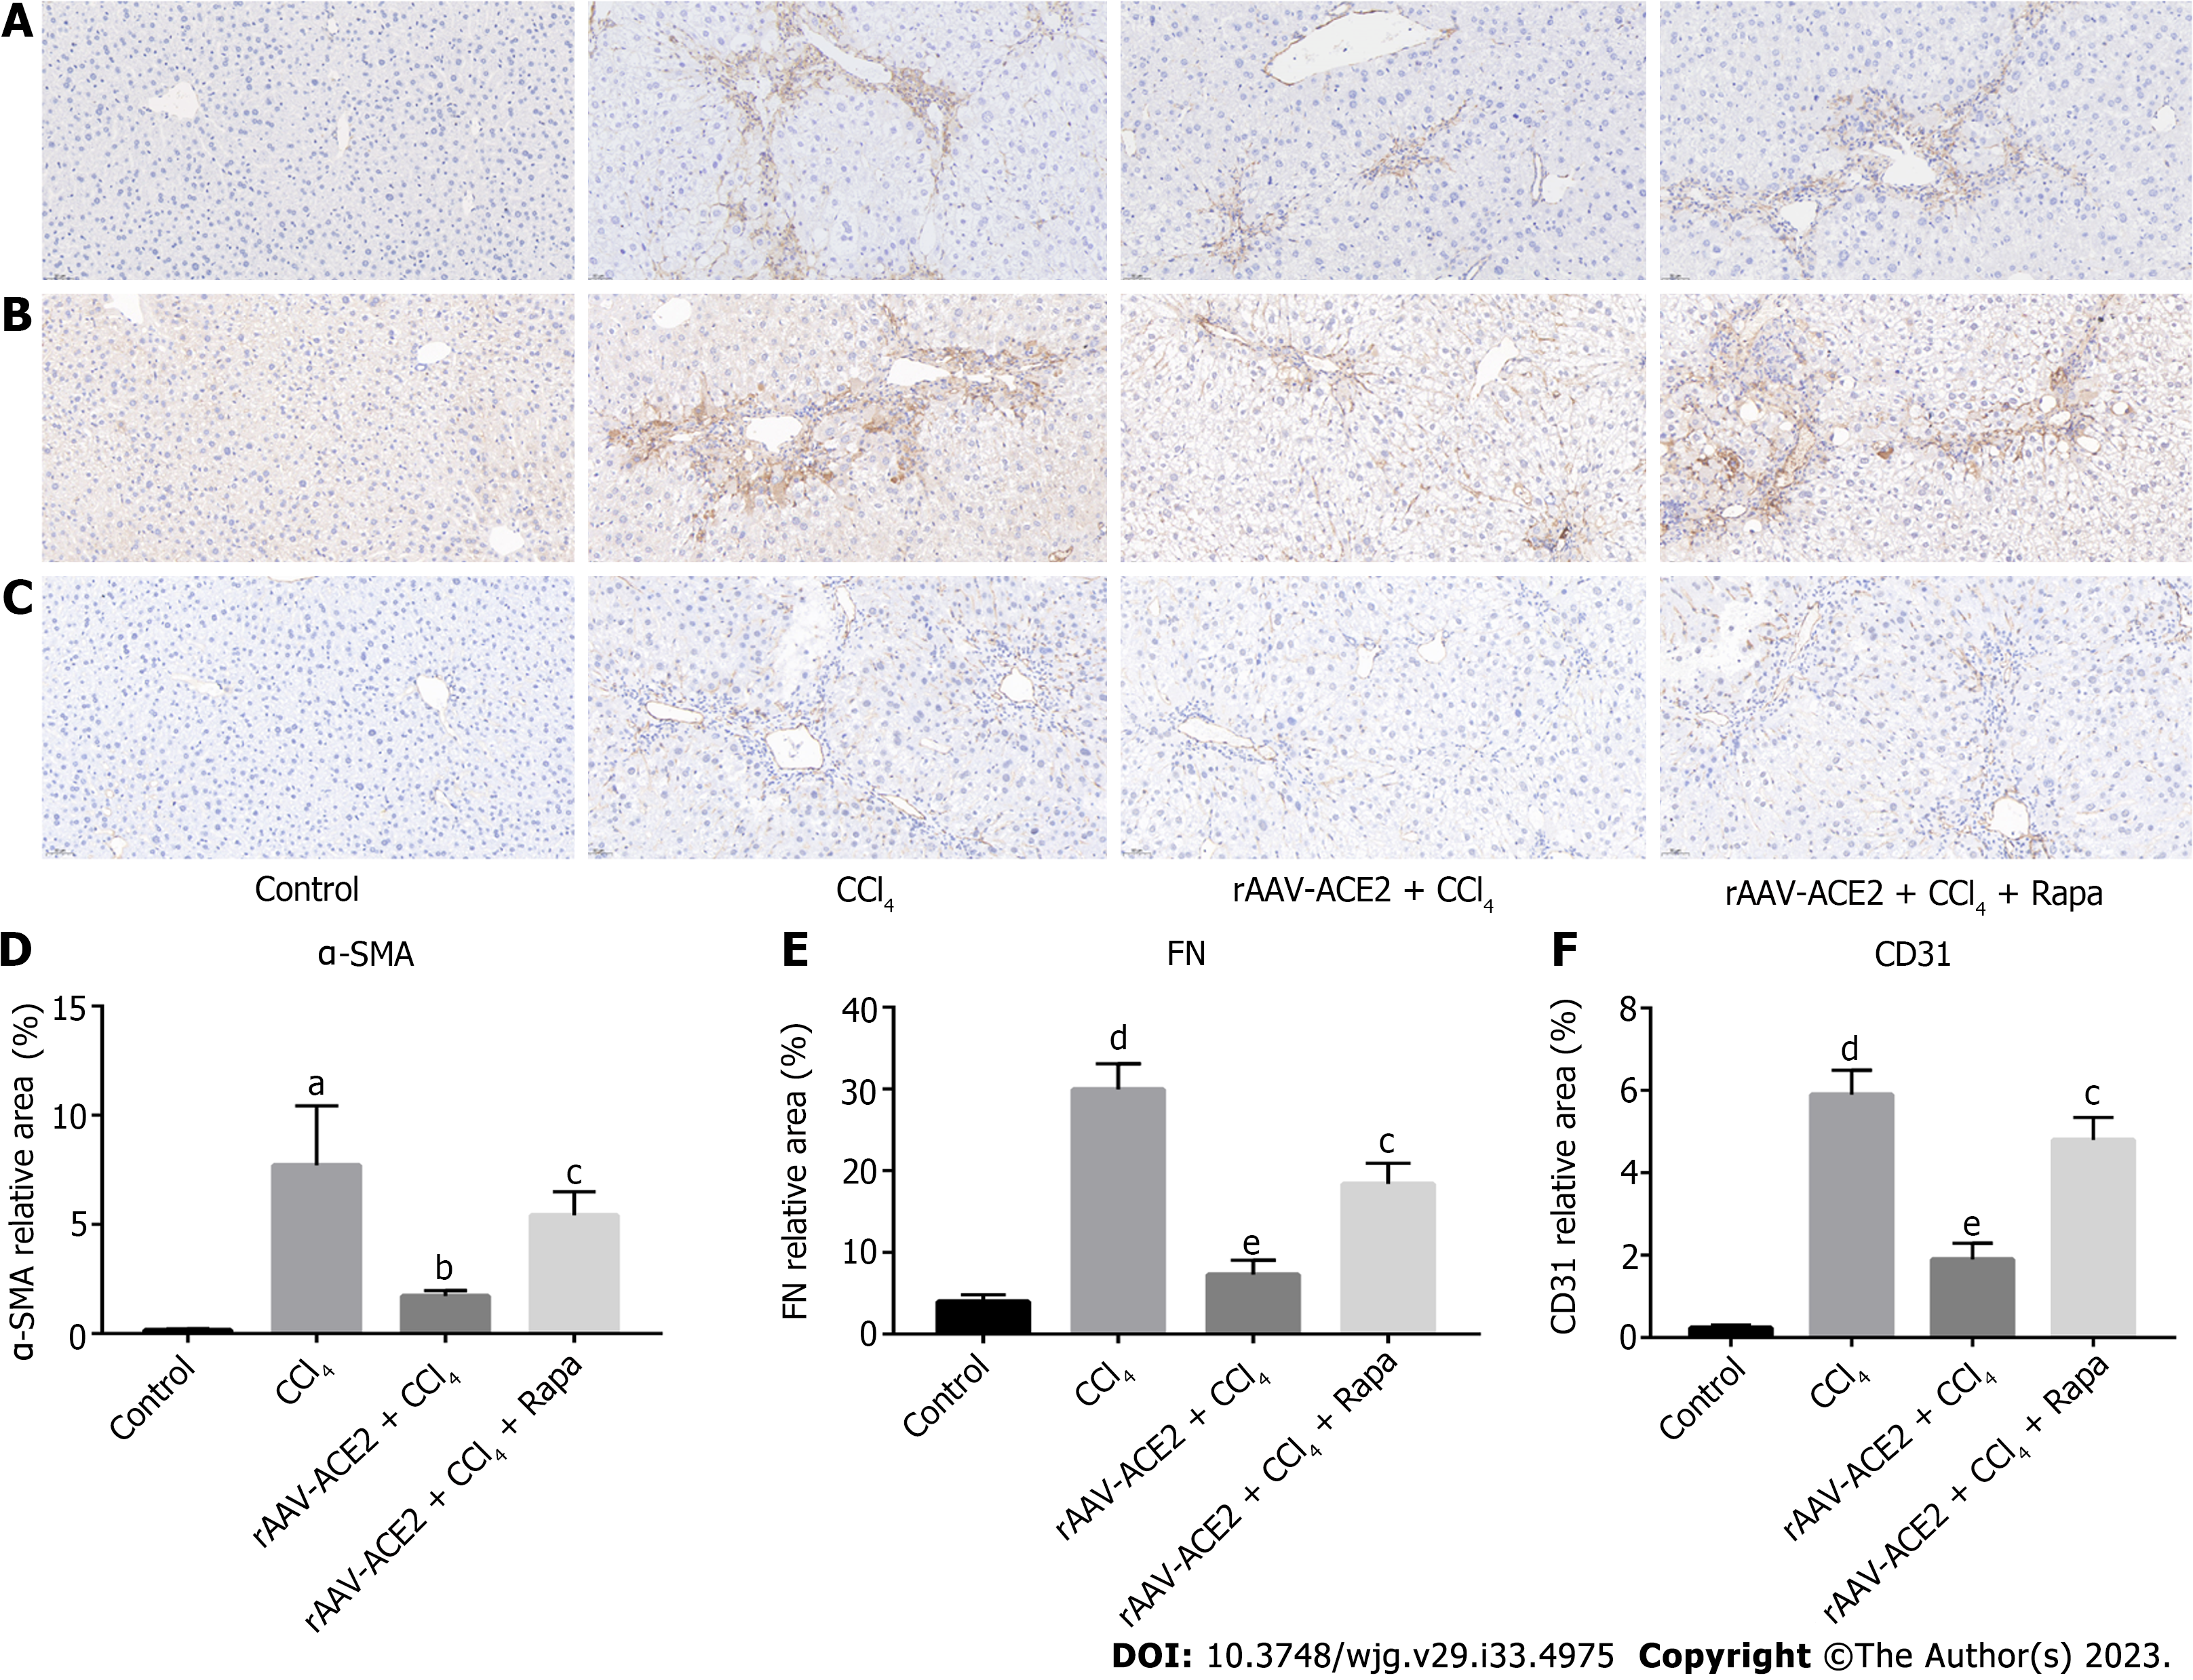
Figure 3 Effect of rAAV-Angiotensin-converting enzyme 2 treatment on the expression of Alpha-smooth muscle actin, Fibronectin and CD31 in CCl4-induced fibrotic mice was evaluated by immunohistochemistry staining (magnification × 200).
A: The expression level of Alpha-smooth muscle actin in the liver tissues of each group was detected; B: The expression level of Fibronectin in the liver tissues of each group was detected; C: The expression level of CD31 in the liver tissues of each group was detected; D-F: The relative expression levels of the three proteins in each group were analyzed using Image-Pro Plus 6.0. aP < 0.01 vs Control; bP < 0.05 vs CCl4; cP < 0.01 vs rAAV-ACE2 + CCl4; dP < 0.001 vs Control; eP < 0.001 vs CCl4. Rapa: Rapamycin; α-SMA: Alpha-smooth muscle actin; FN: Fibronectin; ACE2: Angiotensin-converting enzyme 2.
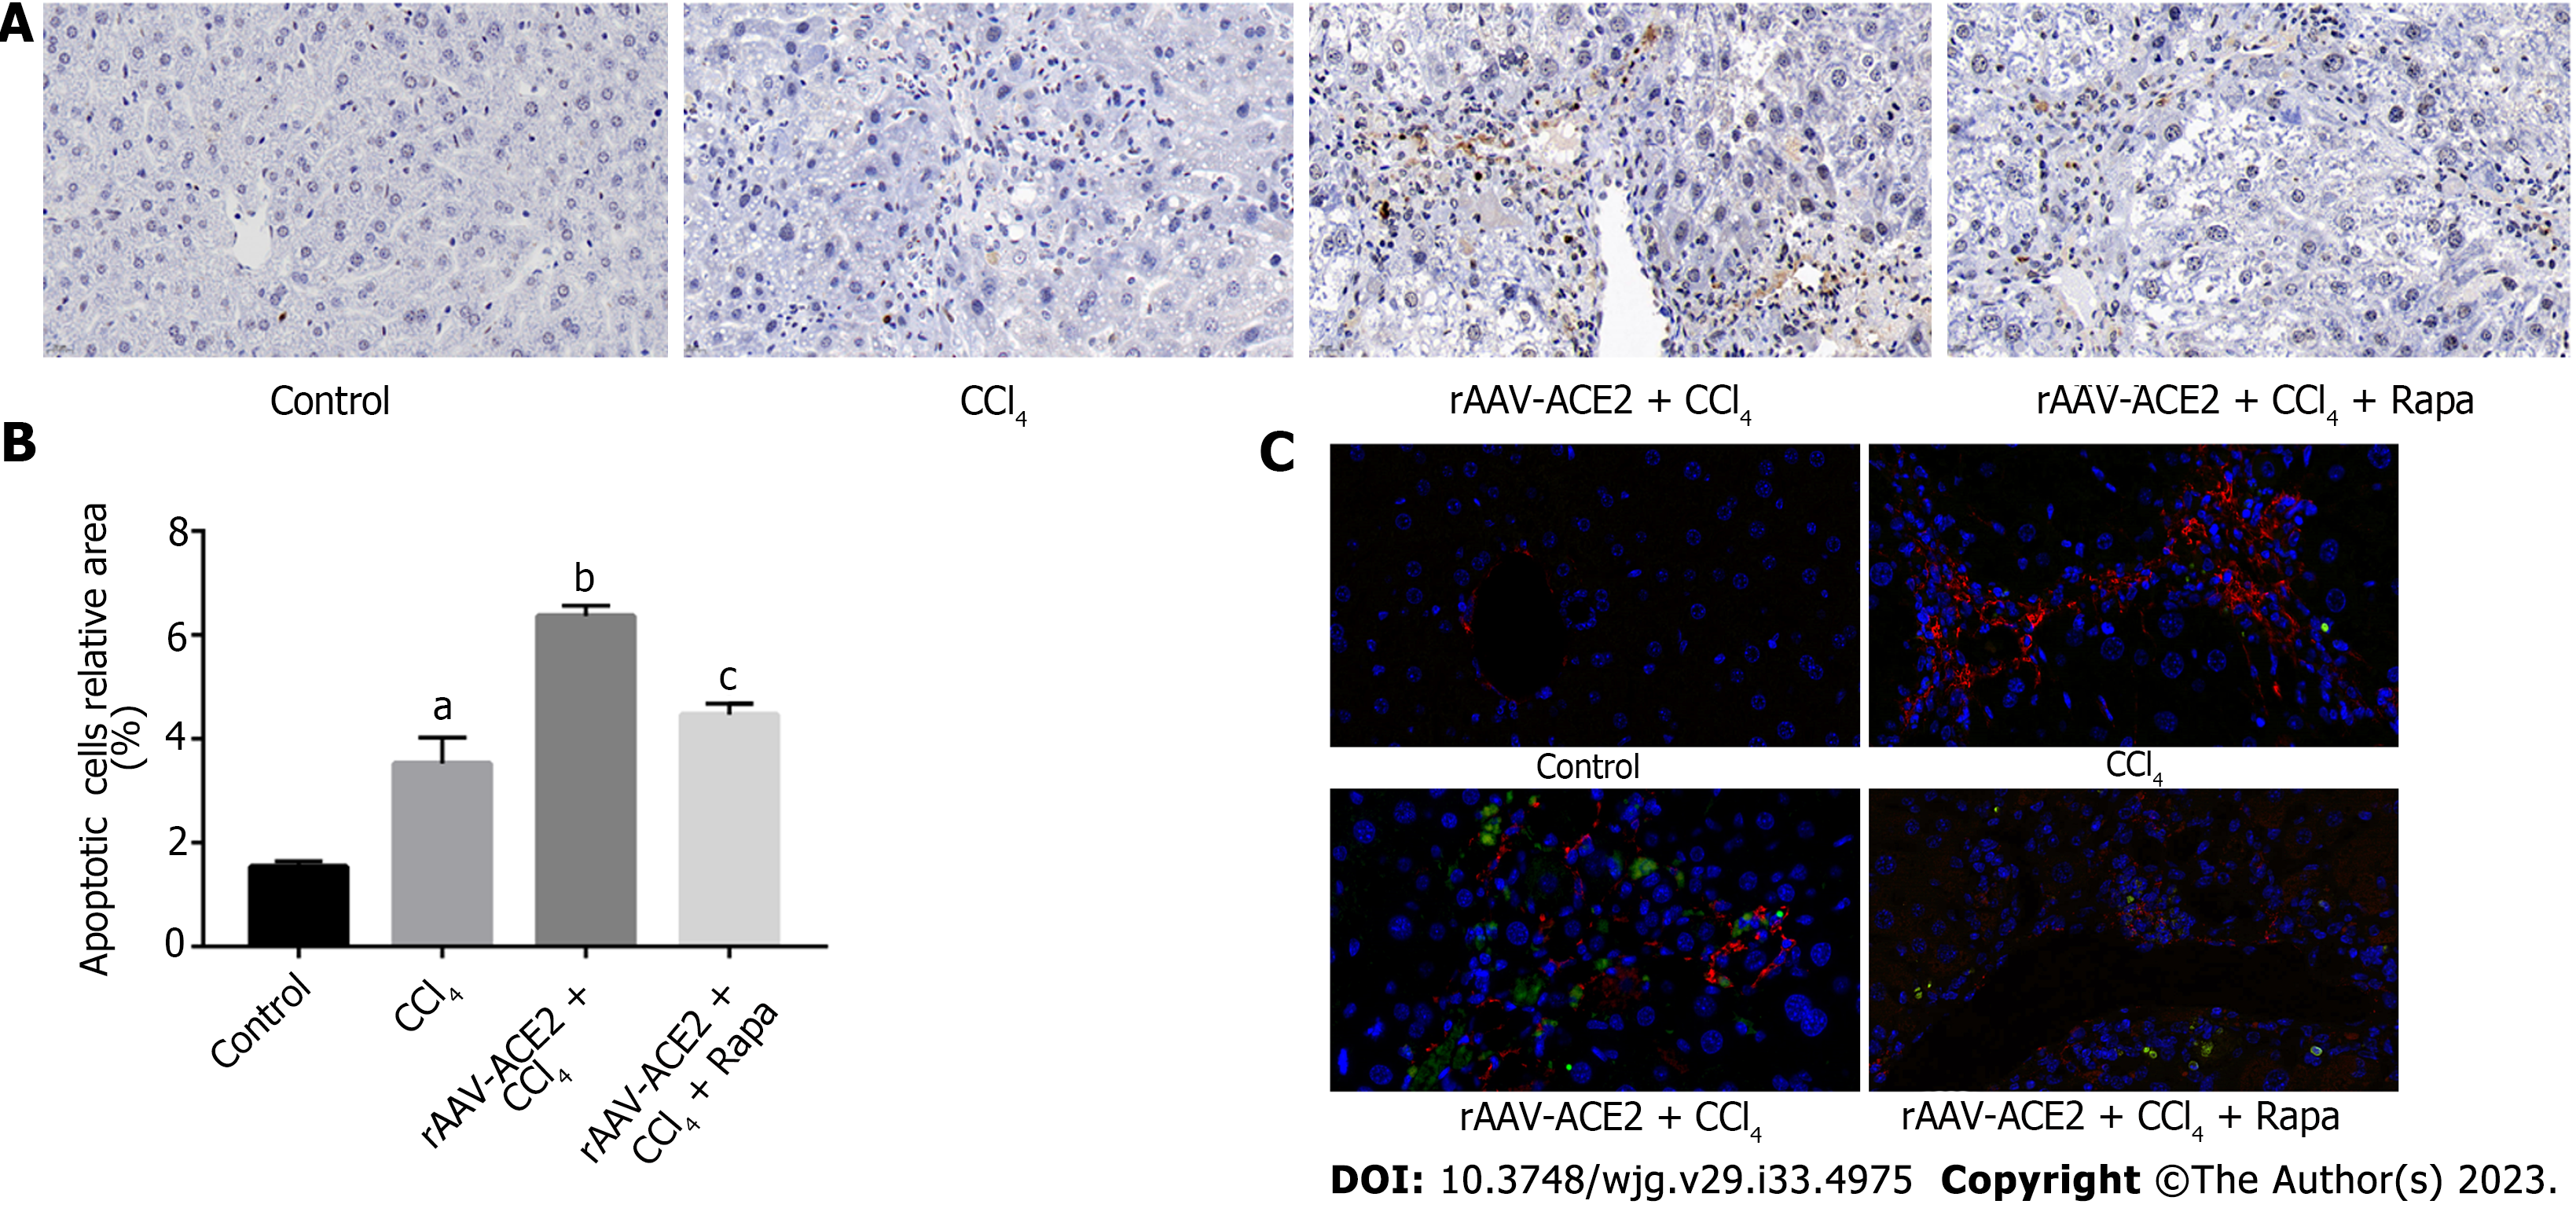
Figure 4 Effect of rAAV-Angiotensin-converting enzyme 2 treatment on hepatic stellate cell apoptosis.
A: Transferase-mediated dUTP nick-end labeling (TUNEL) staining (magnification × 400); B: The relative number of apoptotic cells in each group was analyzed using Image-Pro Plus 6.0. aP < 0.05 vs Control; bP < 0.05 vs CCl4; cP < 0.05 vs rAAV-ACE2 + CCl4; C: TUNEL and Alpha-smooth muscle actin (α-SMA) immunofluorescence co-localization staining (magnification × 630). The nuclei stained by DAPI were blue, FITC luciferin-labeled apoptotic cells were green, and α-SMA displayed red. Rapa: Rapamycin; ACE2: Angiotensin-converting enzyme 2; DAPI: 4',6-diamidino-2-phenylindole; FITC: Fluorescein isothiocyanate.
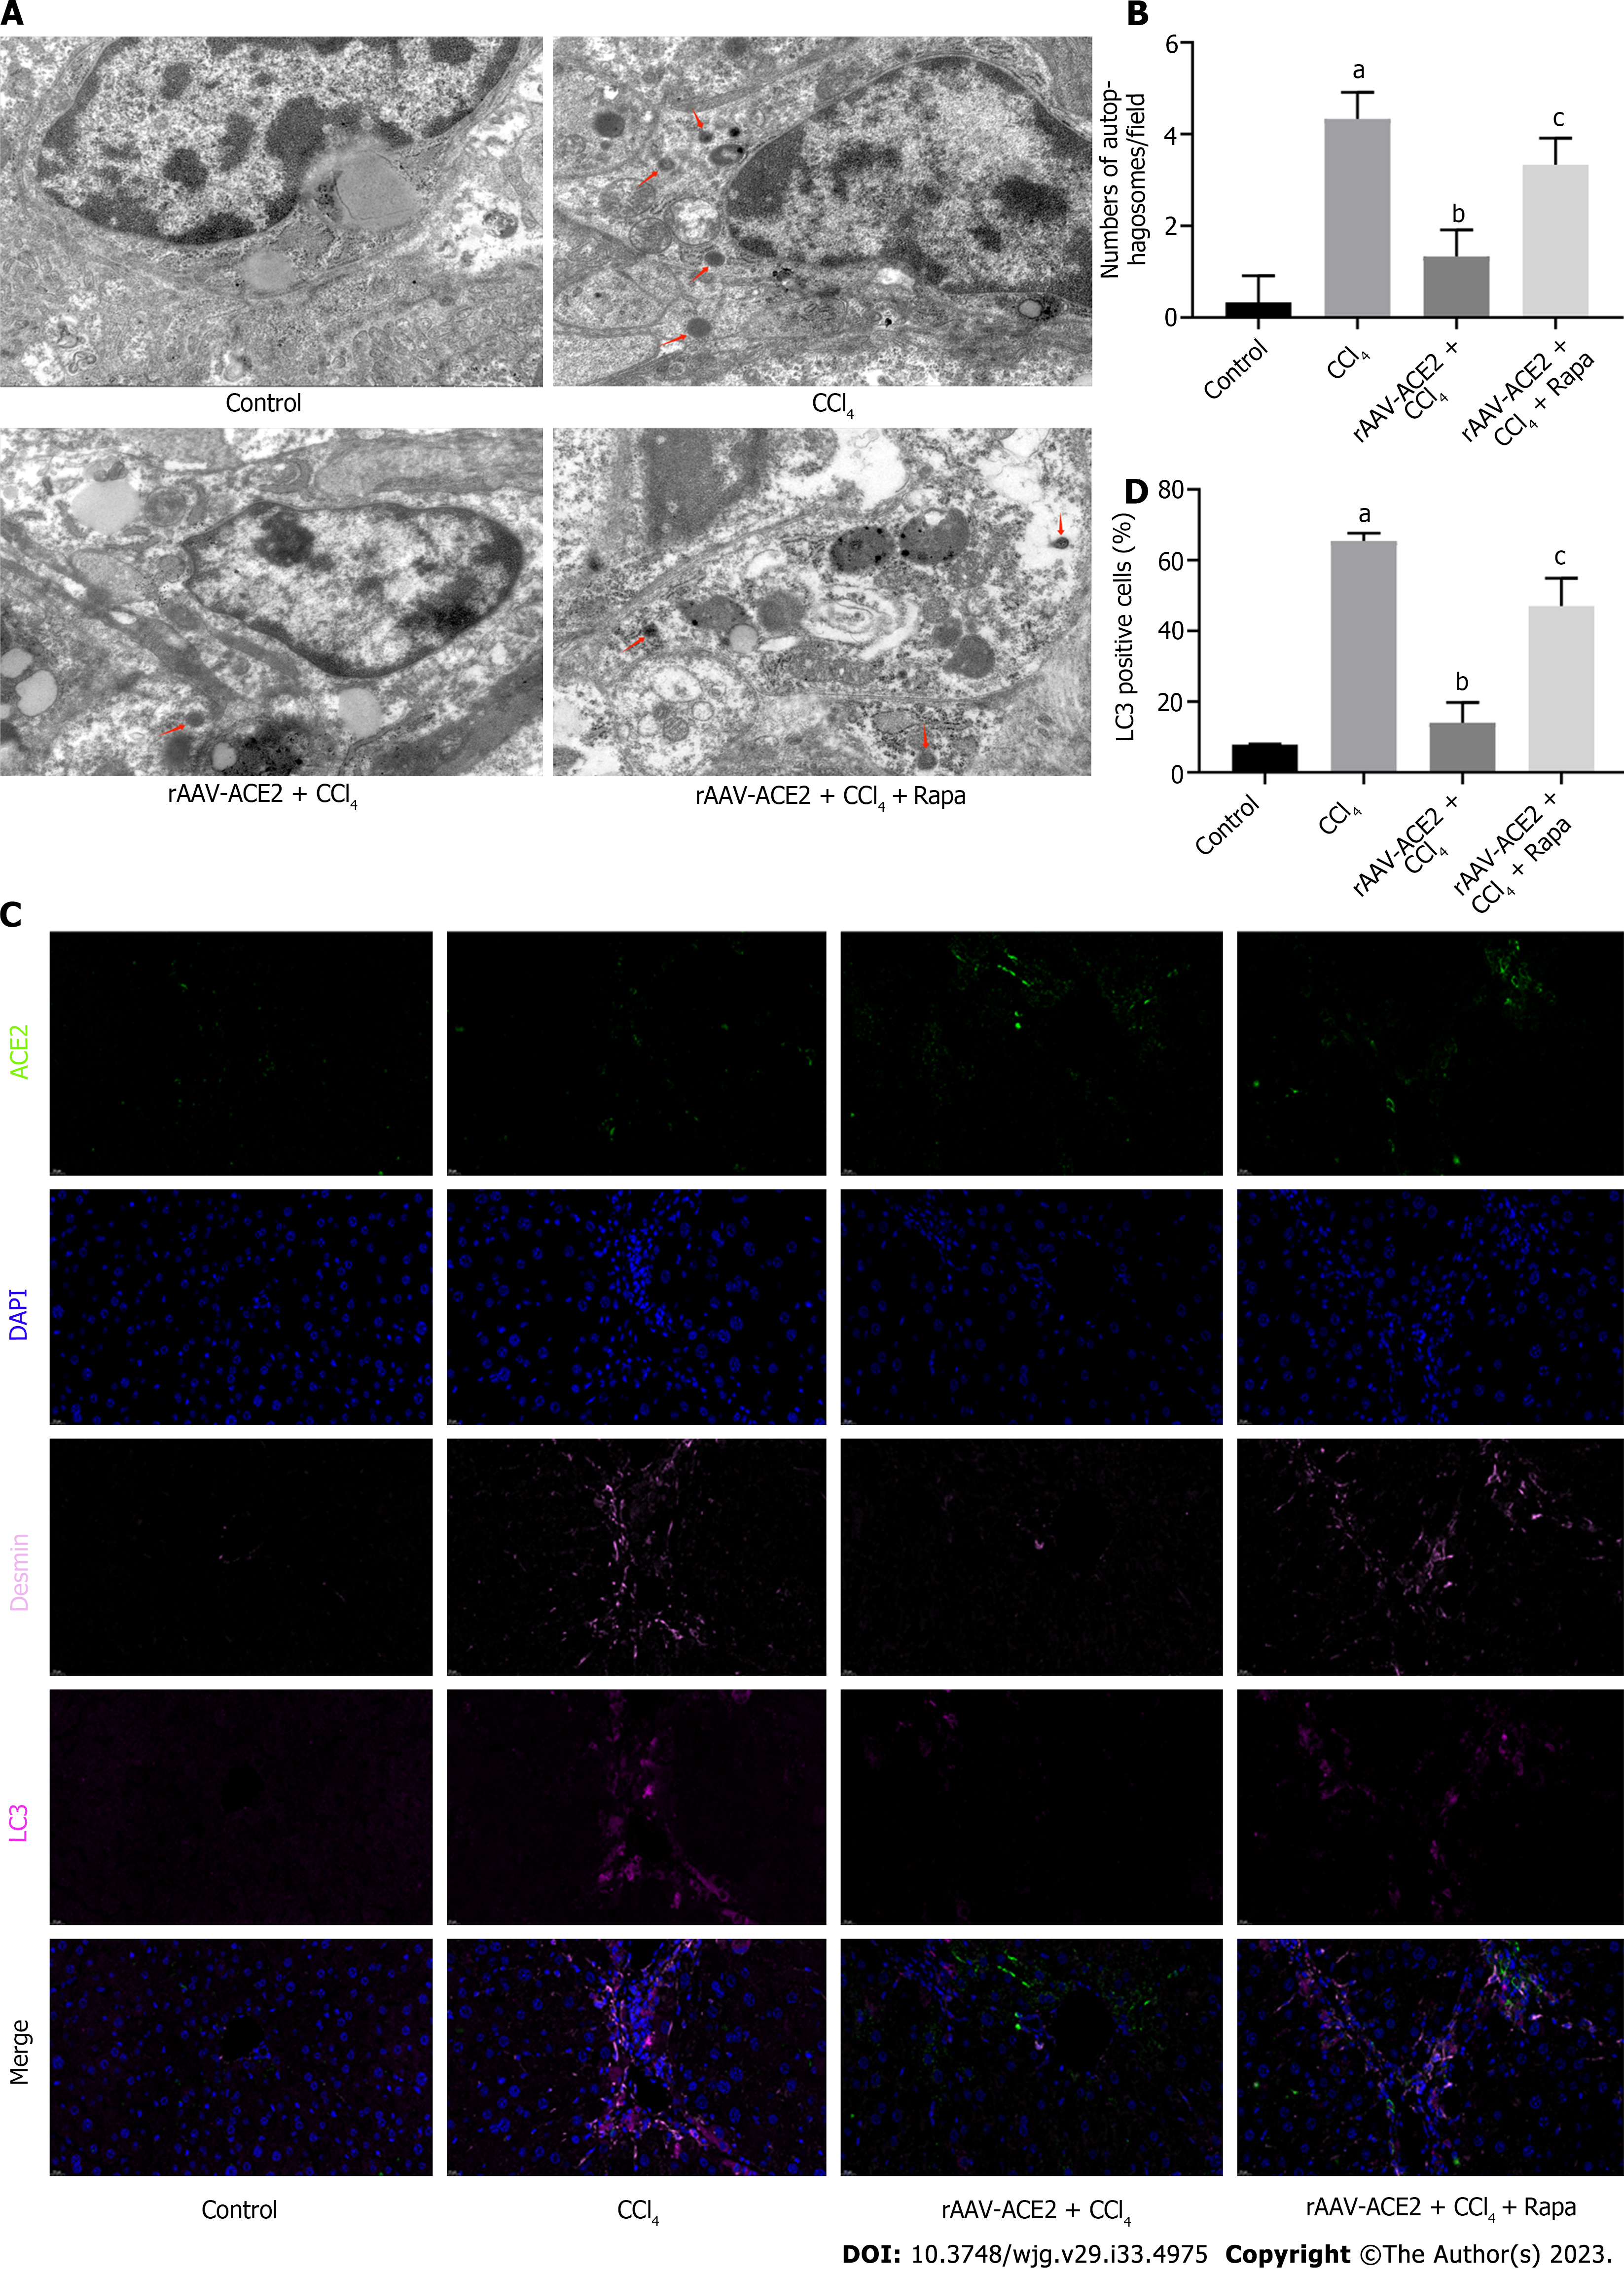
Figure 5 Effect of rAAV-Angiotensin-converting enzyme 2 administration on hepatic stellate cell autophagy in mouse liver tissues.
A: Effect of rAAV-ACE2 administration on hepatic stellate cell autophagosome formation in CCl4-induced fibrotic mice was observed by Transmission electron microscopy (magnification × 7000). As shown, red arrows indicated autophagosomes; B: The number of autophagosomes in each group was quantified. aP < 0.01 vs Control; bP < 0.05 vs CCl4; cP < 0.01 vs rAAV-ACE2 + CCl4; C: Effect of rAAV-ACE2 administration on the expression of autophagy protein LC3. Multicolor immunofluorescence staining for ACE2 (green), autophagic LC3 (Purplish red), desmin (pink), nuclear DAPI (blue), and merged signals in mouse liver tissues (magnification × 400); D: The number of LC3 positive cells in each group was analyzed using Image-Pro Plus 6.0 software. aP < 0.001 vs Control; bP < 0.01 vs CCl4; cP < 0.05 vs rAAV-ACE2 + CCl4. Rapa: Rapamycin; DAPI: 4',6-diamidino-2-phenylindole; ACE2: Angiotensin-converting enzyme 2.
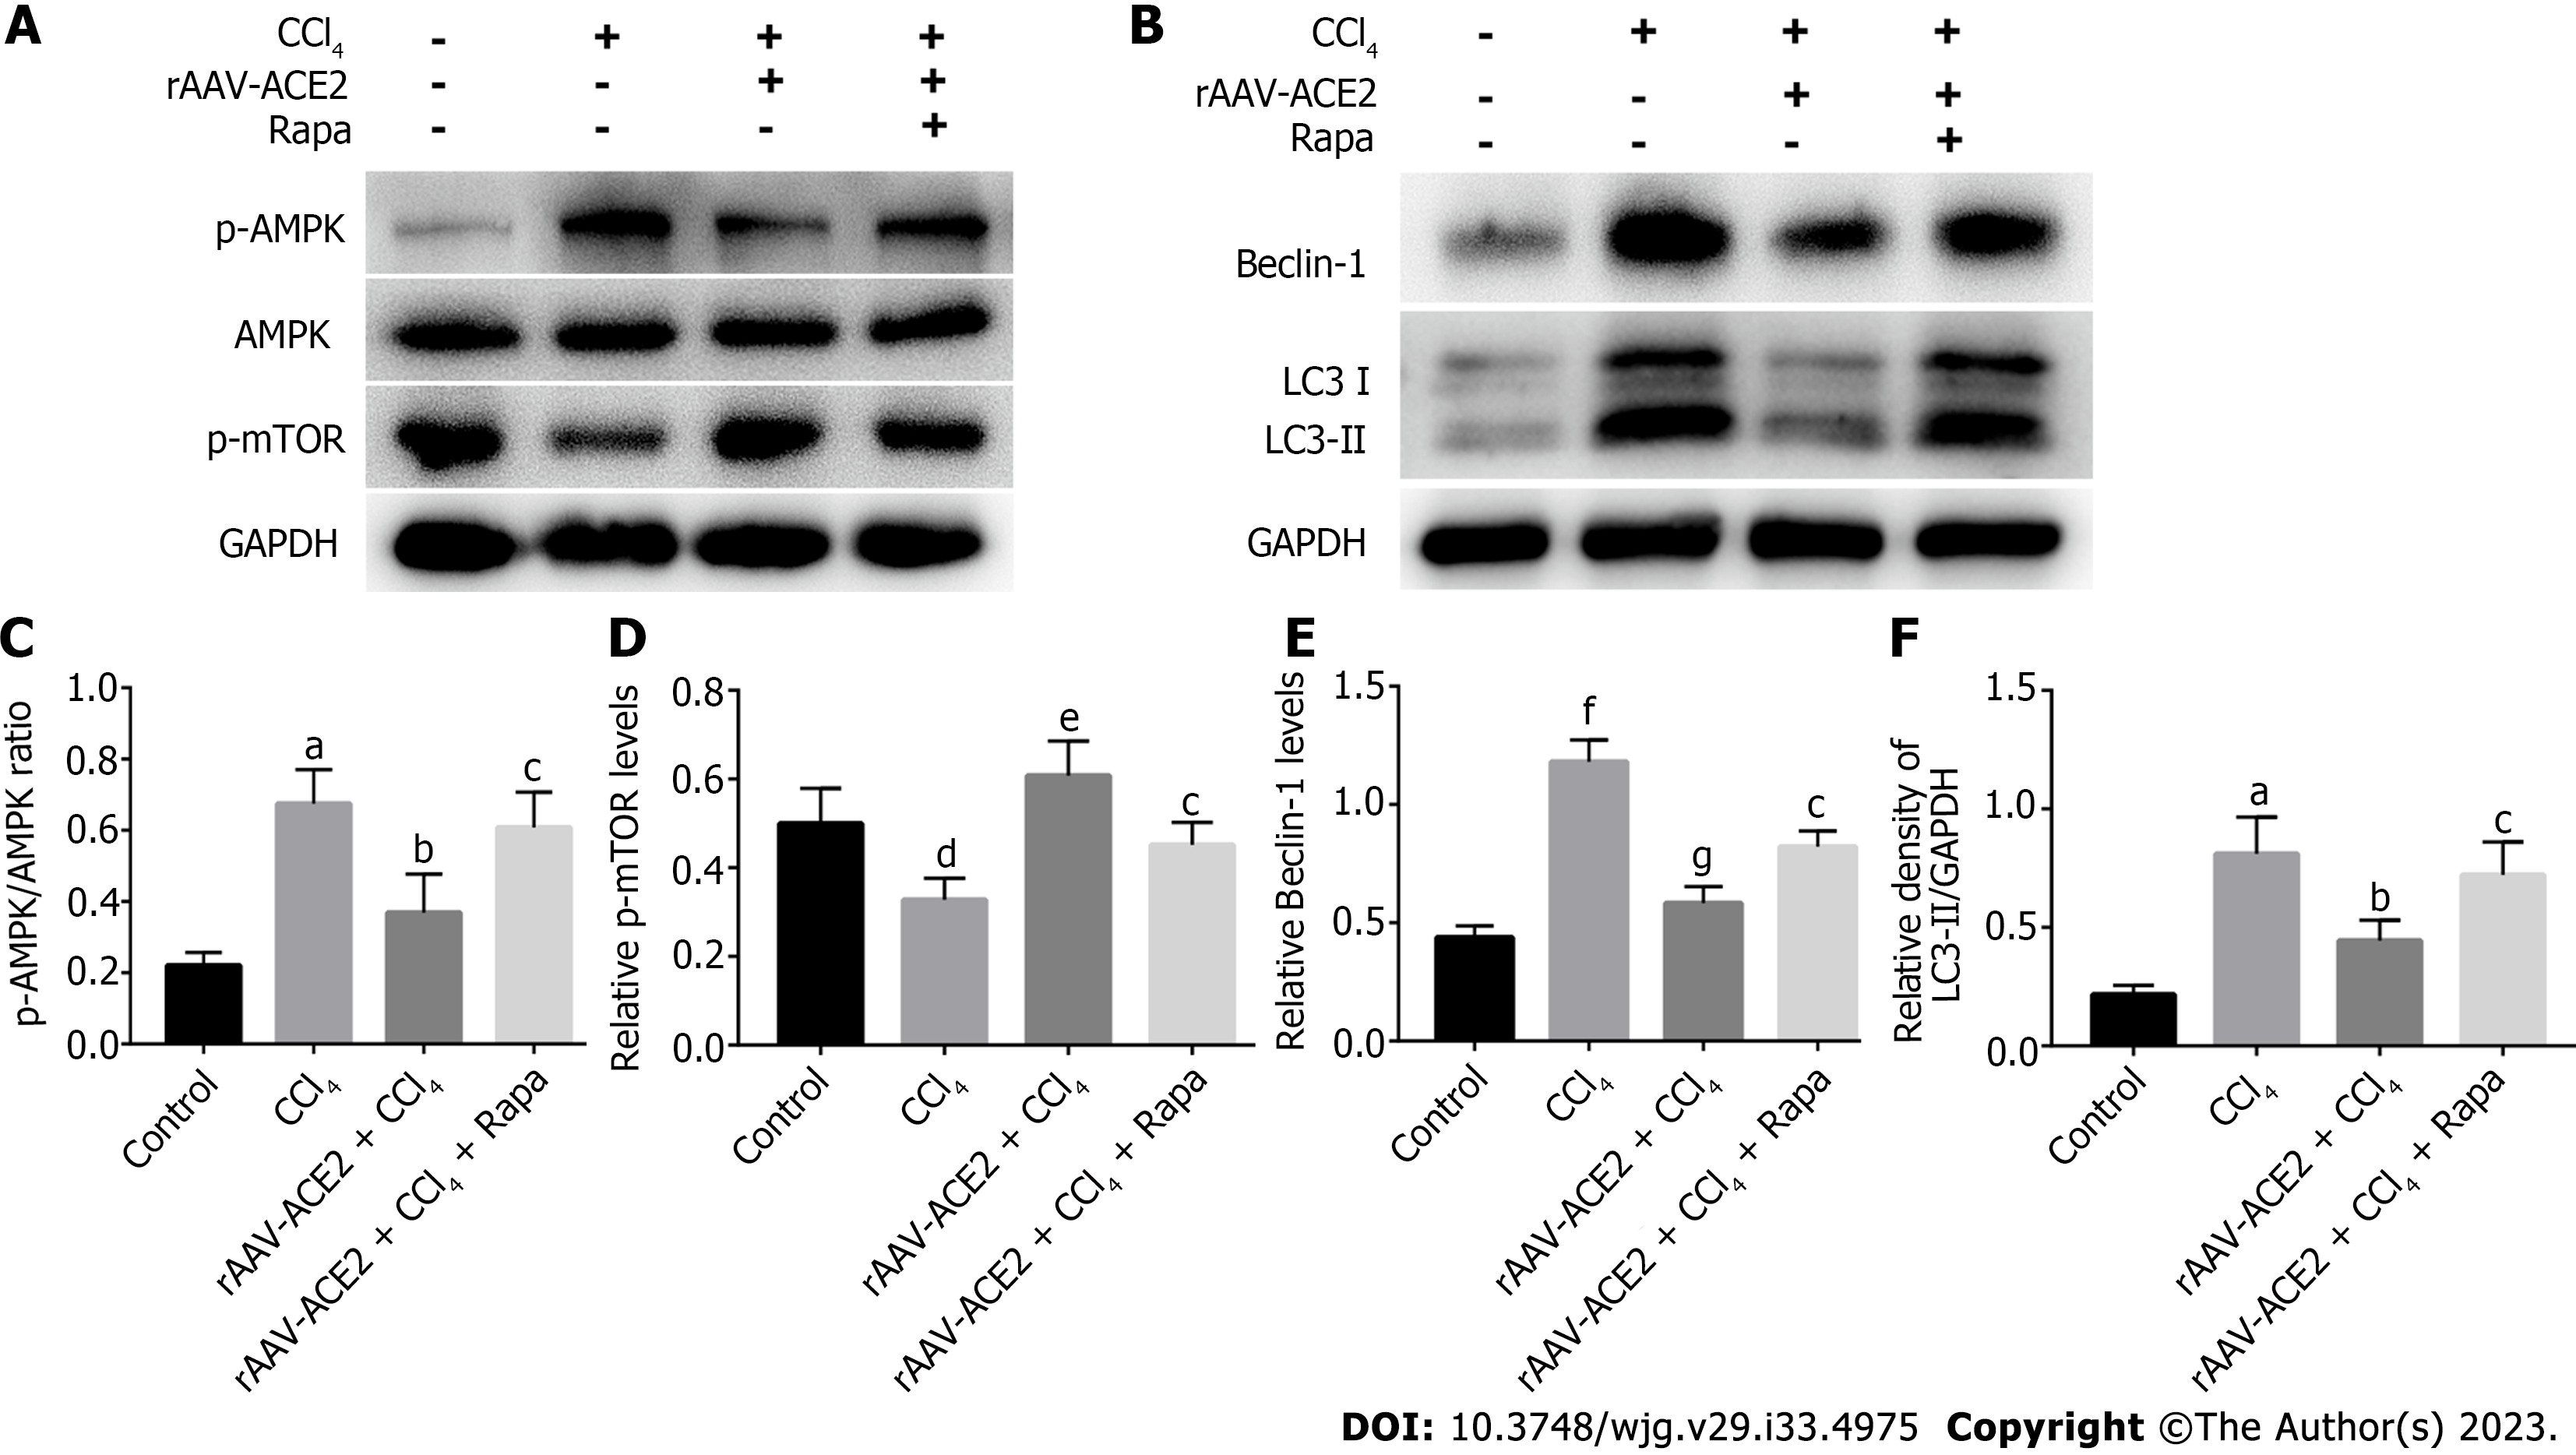
Figure 6 Effect of rAAV-Angiotensin-converting enzyme 2 treatment on the expression of adenosine monophosphate activates protein kinases signaling pathway proteins and autophagy-related proteins in mouse liver tissues.
A: The expression levels of p-AMPK, AMPK and p-mTOR were detected by western blotting; B: The expression levels of autophagy markers Beclin-1, LC3I and LC3II were detected by western blotting; C-F: The relative protein levels in each group were analyzed using ImageJ. aP < 0.01 vs Control; bP < 0.05 vs CCl4; cP < 0.05 vs rAAV-ACE2 + CCl4; dP < 0.05 vs Control; eP < 0.01 vs CCl4; fP < 0.001 vs Control; gP < 0.001 vs CCl4. Rapa: Rapamycin; p-mTOR: p-mammalian target of rapamycin; AMPK: Adenosine monophosphate activates protein kinases; ACE2: Angiotensin-converting enzyme 2.
- Citation: Wu Y, Yin AH, Sun JT, Xu WH, Zhang CQ. Angiotensin-converting enzyme 2 improves liver fibrosis in mice by regulating autophagy of hepatic stellate cells. World J Gastroenterol 2023; 29(33): 4975-4990
- URL: https://www.wjgnet.com/1007-9327/full/v29/i33/4975.htm
- DOI: https://dx.doi.org/10.3748/wjg.v29.i33.4975


