Copyright
©The Author(s) 2023.
World J Gastroenterol. Aug 28, 2023; 29(32): 4860-4872
Published online Aug 28, 2023. doi: 10.3748/wjg.v29.i32.4860
Published online Aug 28, 2023. doi: 10.3748/wjg.v29.i32.4860
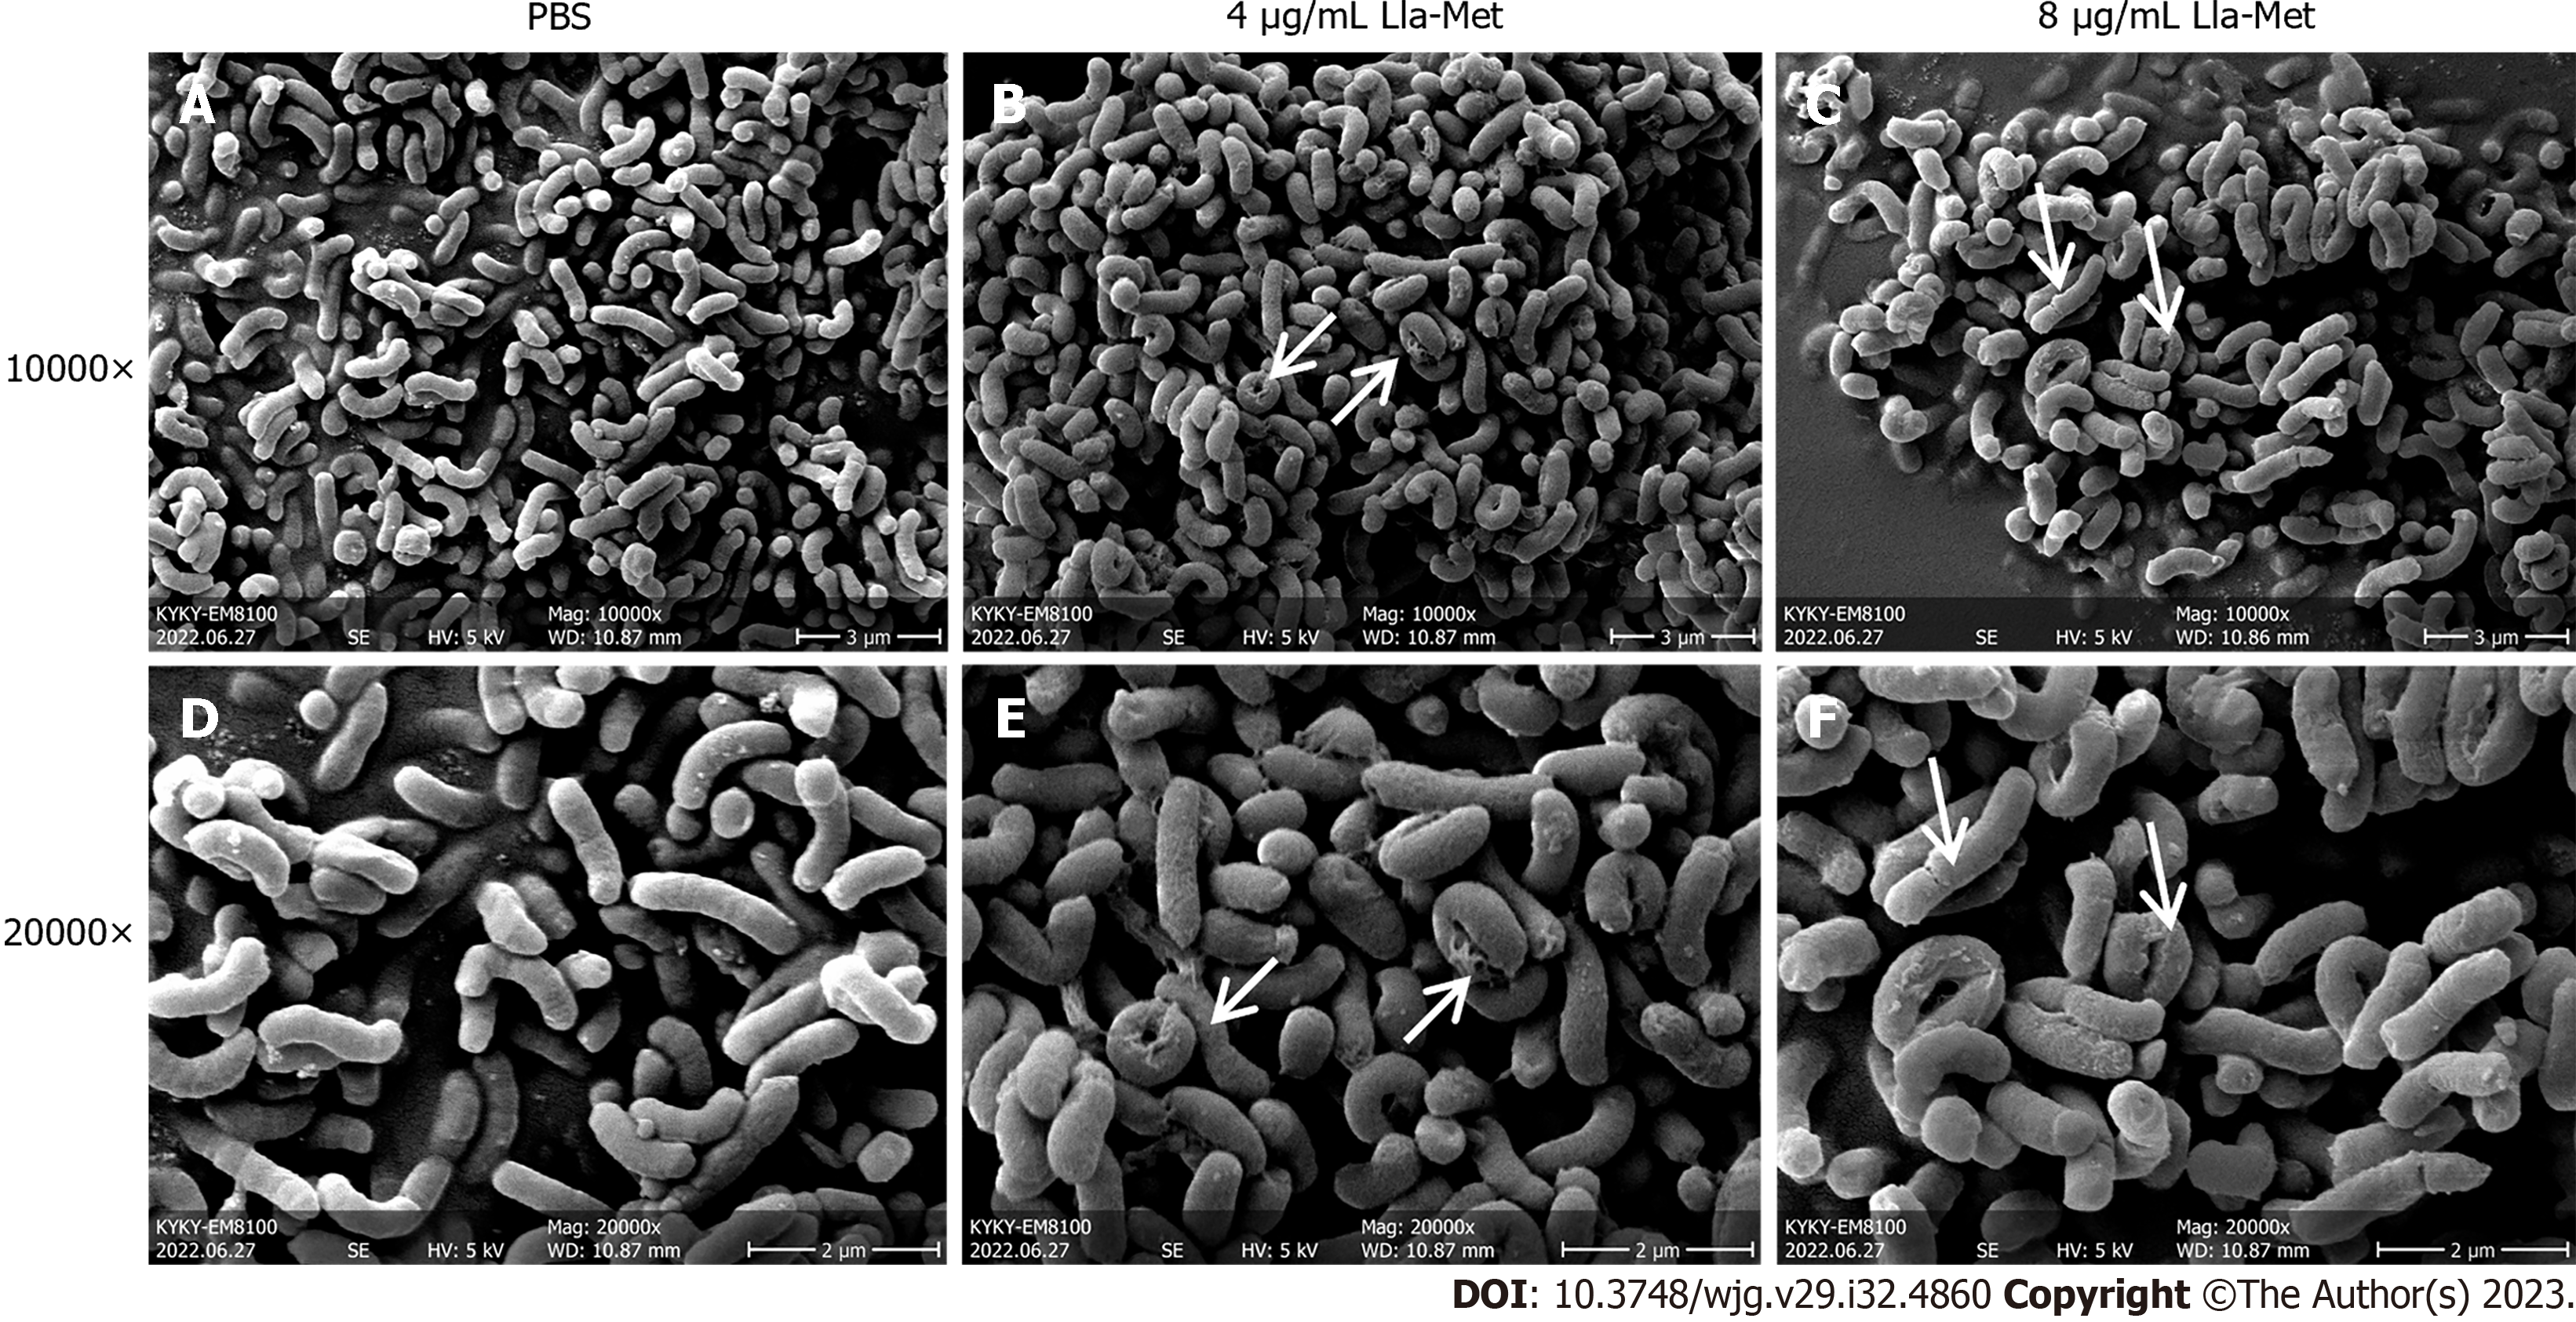
Figure 1 The effect of linolenic acid-metronidazole on Helicobacter pylori morphology.
A: The control group shows the cell morphology at × 10000 magnification; B: The appearance of Helicobacter pylori (H. pylori) in linolenic acid-metronidazole concentrations of 4 μg/mL shows the cell morphology at × 10000 magnification; C: The appearance of H. pylori in linolenic acid-metronidazole concentrations of 8 μg/mL shows the cell morphology at × 10000 magnification; D: The control group shows the cell morphology at × 20000 magnification; E: The appearance of H. pylori in linolenic acid-metronidazole concentrations of 4 μg/mL shows the cell morphology at × 20000 magnification; F: The appearance of H. pylori in linolenic acid-metronidazole concentrations of 8 μg/mL shows the cell morphology at × 20000 magnification. The arrow points to the cell damage. Roughness, swelling, breakages on the cell surface, etc., are shown. PBS: Phosphate buffered saline; Lla-Met: Linolenic acid-metronidazole.
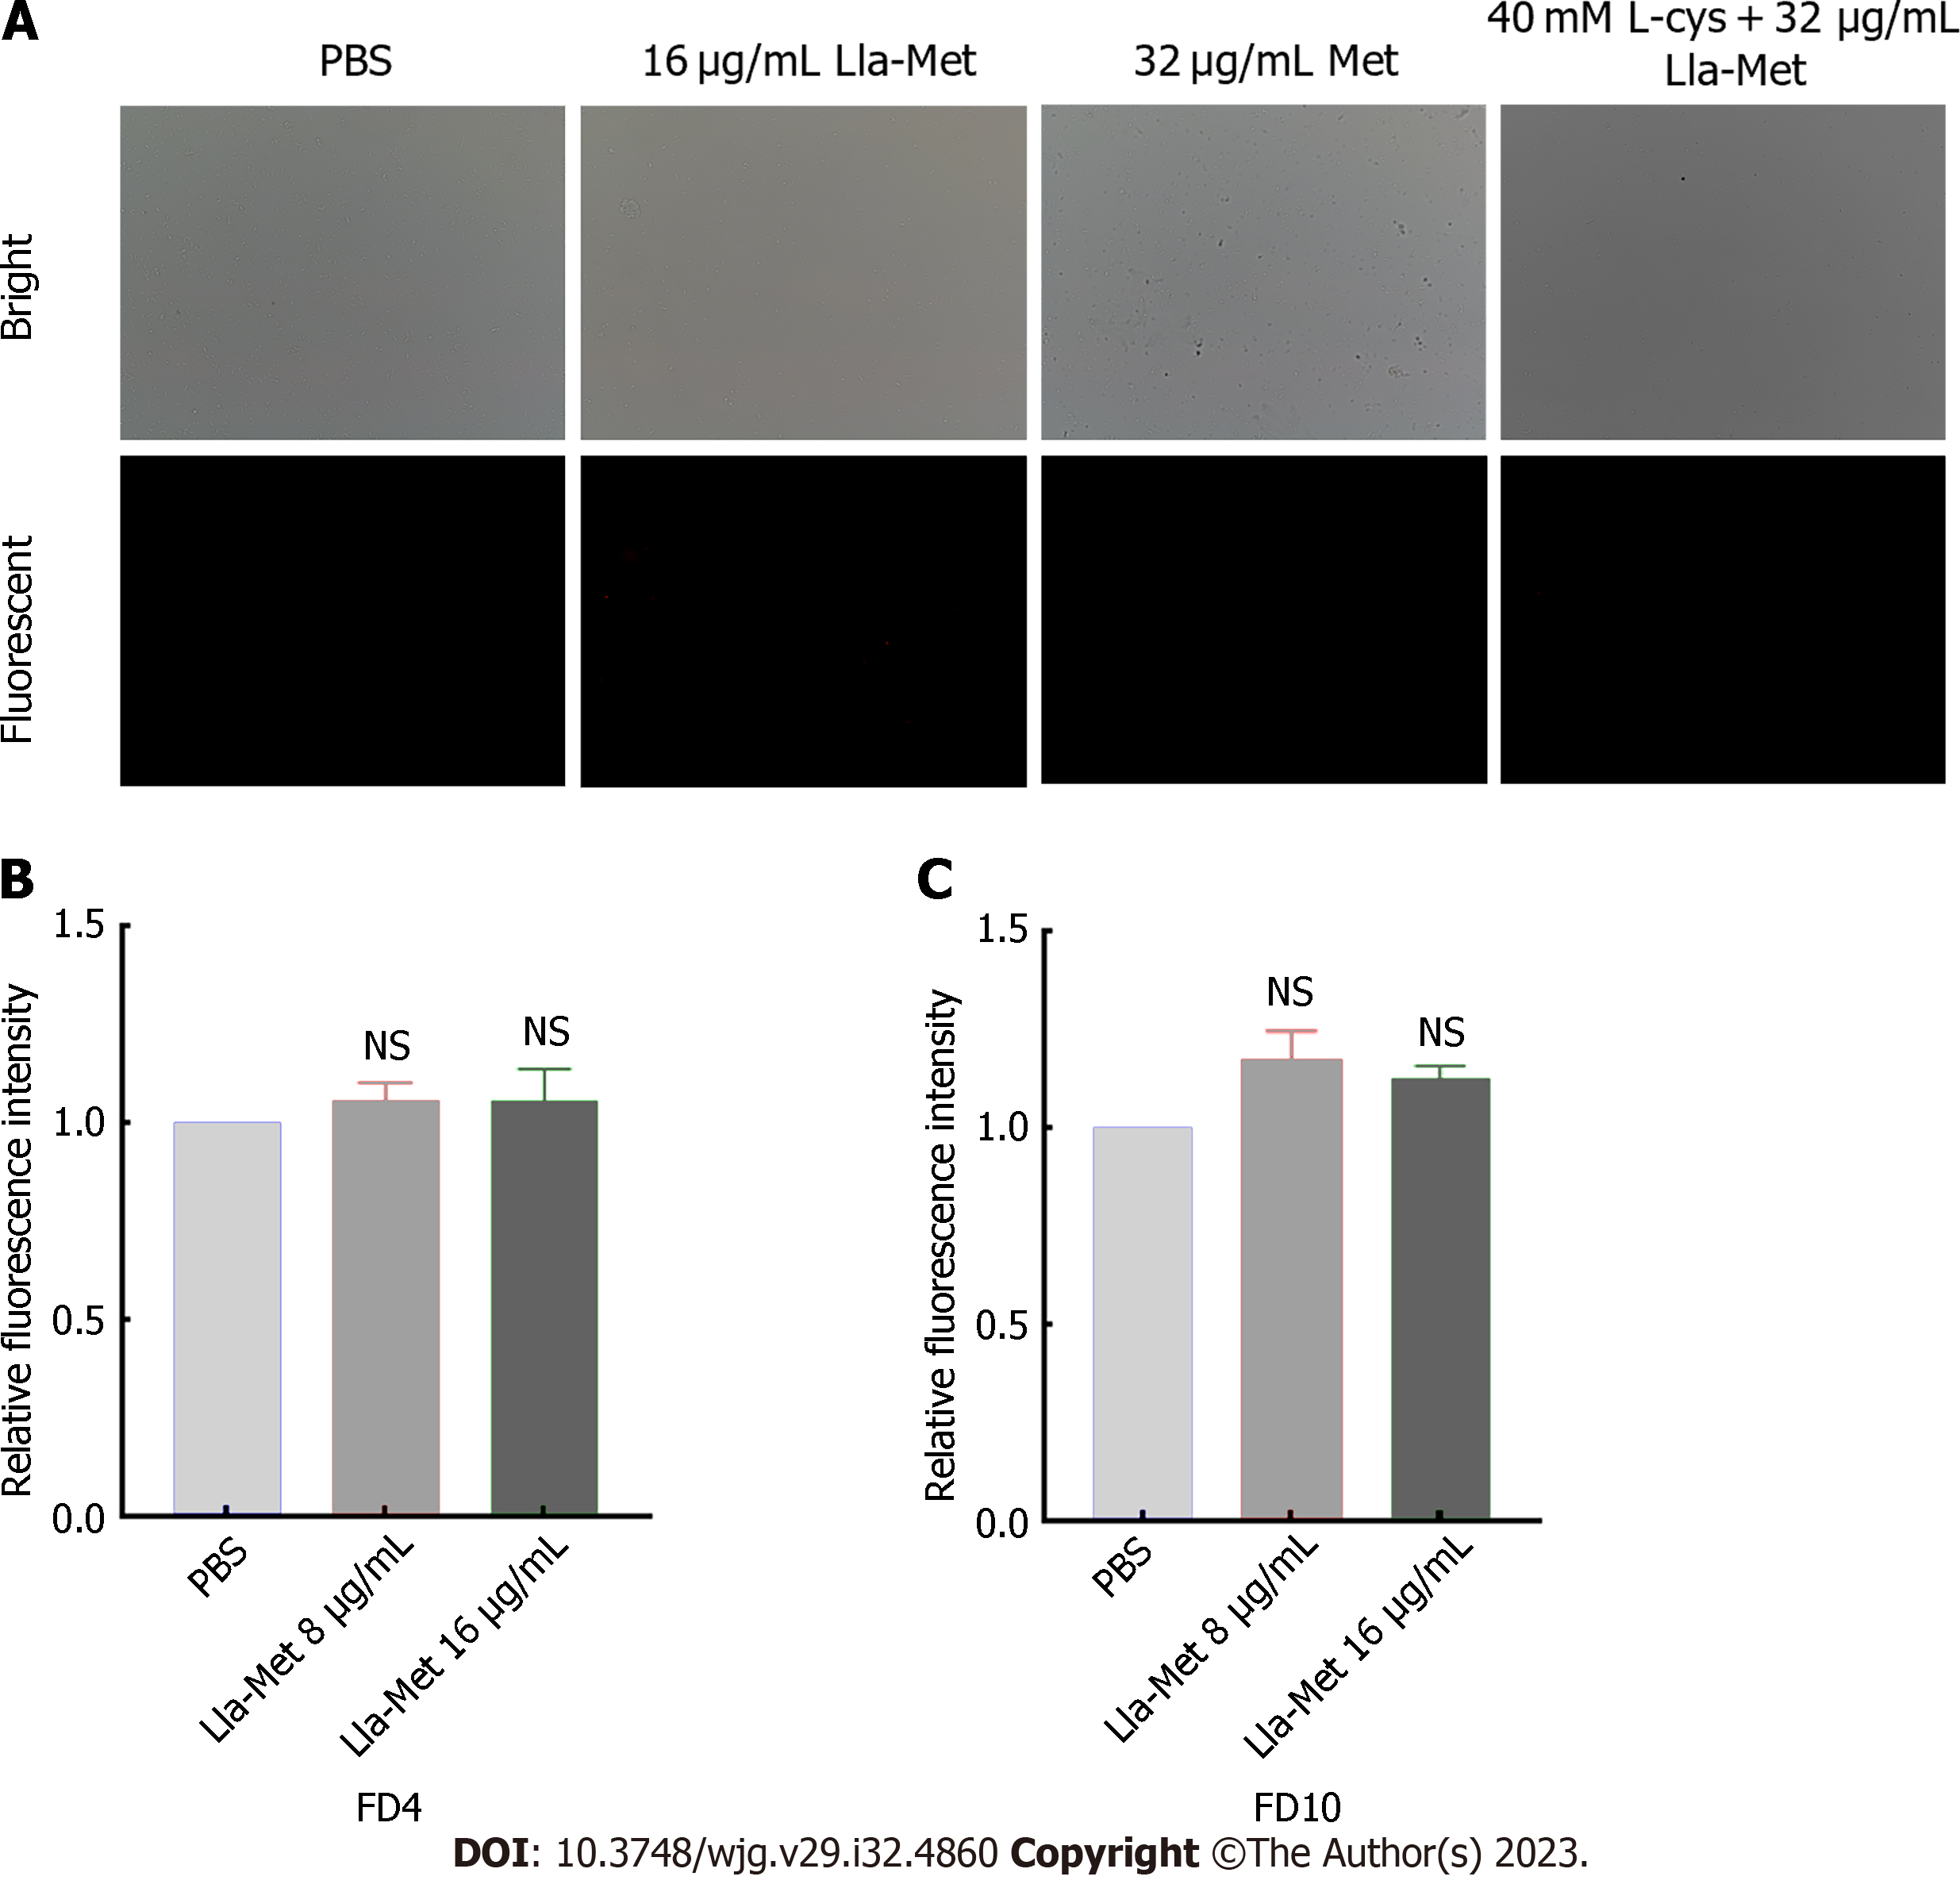
Figure 2 The effect of linolenic acid-metronidazole on cell membrane permeability.
A: Linolenic acid-metronidazole (Lla-met) induced membrane damages of Helicobacter pylori (H. pylori) using PI staining; B: Lla-met induced membrance pore size damage of H. pylori using FD4; C: Lla-met induced membrance pore size damage of H. pylori using FD10. PI, FD4 and FD10 can’t pass through the intact cell membrane. NS: Not significant; PBS: Phosphate buffered saline; Lla-Met: Linolenic acid-metronidazole.
Figure 3 The effect of the linolenic acid-metronidazole compound on Helicobacter pylori ion channels.
A: K+, Na+, Cl-, and Ca2+ ion channels; B: Ca2+ ion channels. NS: Not significant; PBS: Phosphate buffered saline; Lla-Met: Linolenic acid-metronidazole.
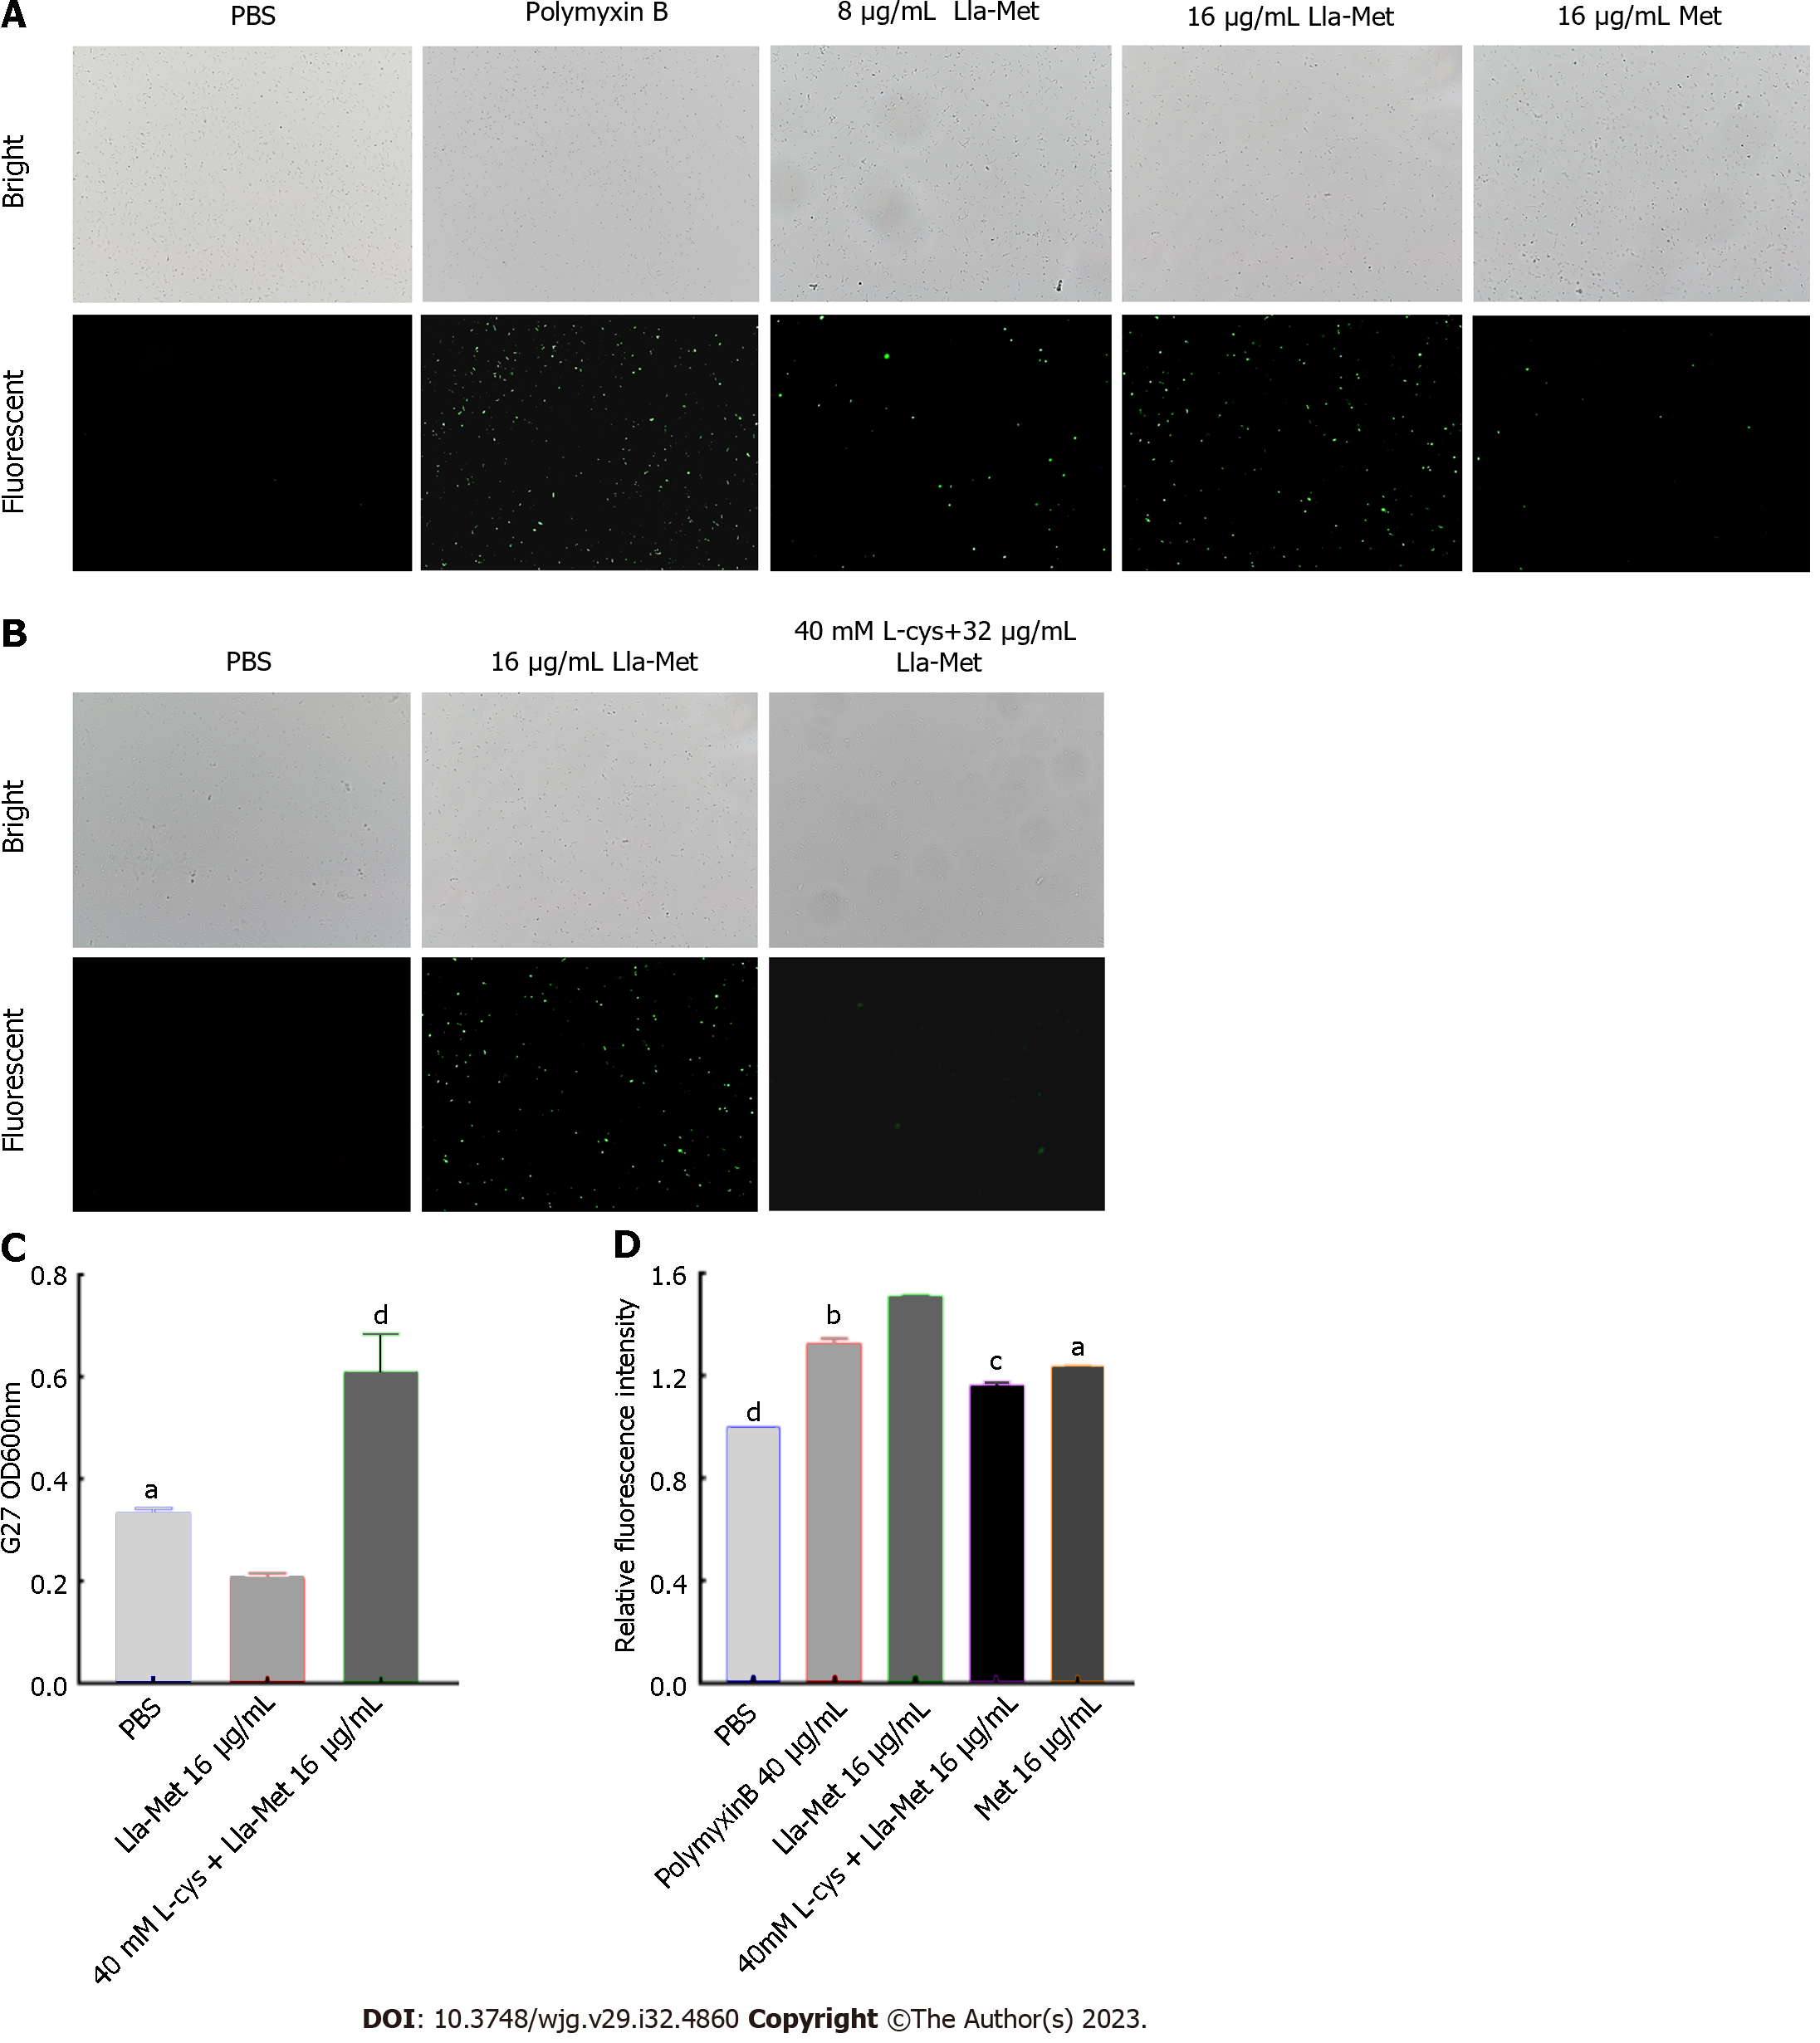
Figure 4 The effect of linolenic acid-metronidazole on the intracellular reactive oxygen species content in Helicobacter pylori.
A: Fluorescent microscopy for the effect of linolenic acid-metronidazole on the production of reactive oxygen species (ROS); B: The effect of L-cysteine (L-Cys) on intracellular production of ROS; C: The effect of L-cys on cell viability; D: Effect of L-cys on ROS. aP < 0.05; bP < 0.01; cP < 0.001; dP < 0.0001. PBS: Phosphate buffered saline; Lla-Met: Linolenic acid-metronidazole; L-Cys: L-cysteine.
Figure 5 Detection of phosphatidylserine ectropion and DNA fragmentation of Helicobacter pylori.
A and C: Fluorescence microscope detection of phosphatidylserine ectropion; B and D: Multifunctional enzyme labeler detection of bacterial DNA fragmentation. aP < 0.05; bP < 0.01; cP < 0.001; dP < 0.0001. PBS: Phosphate buffered saline; Lla-Met: Linolenic acid-metronidazole; L-Cys: L-cysteine.
Figure 6 Linolenic acid-metronidazole up-regulates the expression of superoxide dismutase.
A: The half inhibitory concentration of linolenic acid-metronidazole; B: RNA-seq quality data; C: The principal component analysis; D: Venn diagram; E: Gene set enrichment analysis; F: Up-regulates the expression of genes. aP < 0.05. PBS: Phosphate buffered saline; Lla-Met: Linolenic acid-metronidazole; qPCR: Quantitative polymerase chain reaction; GO: Gene Ontology.
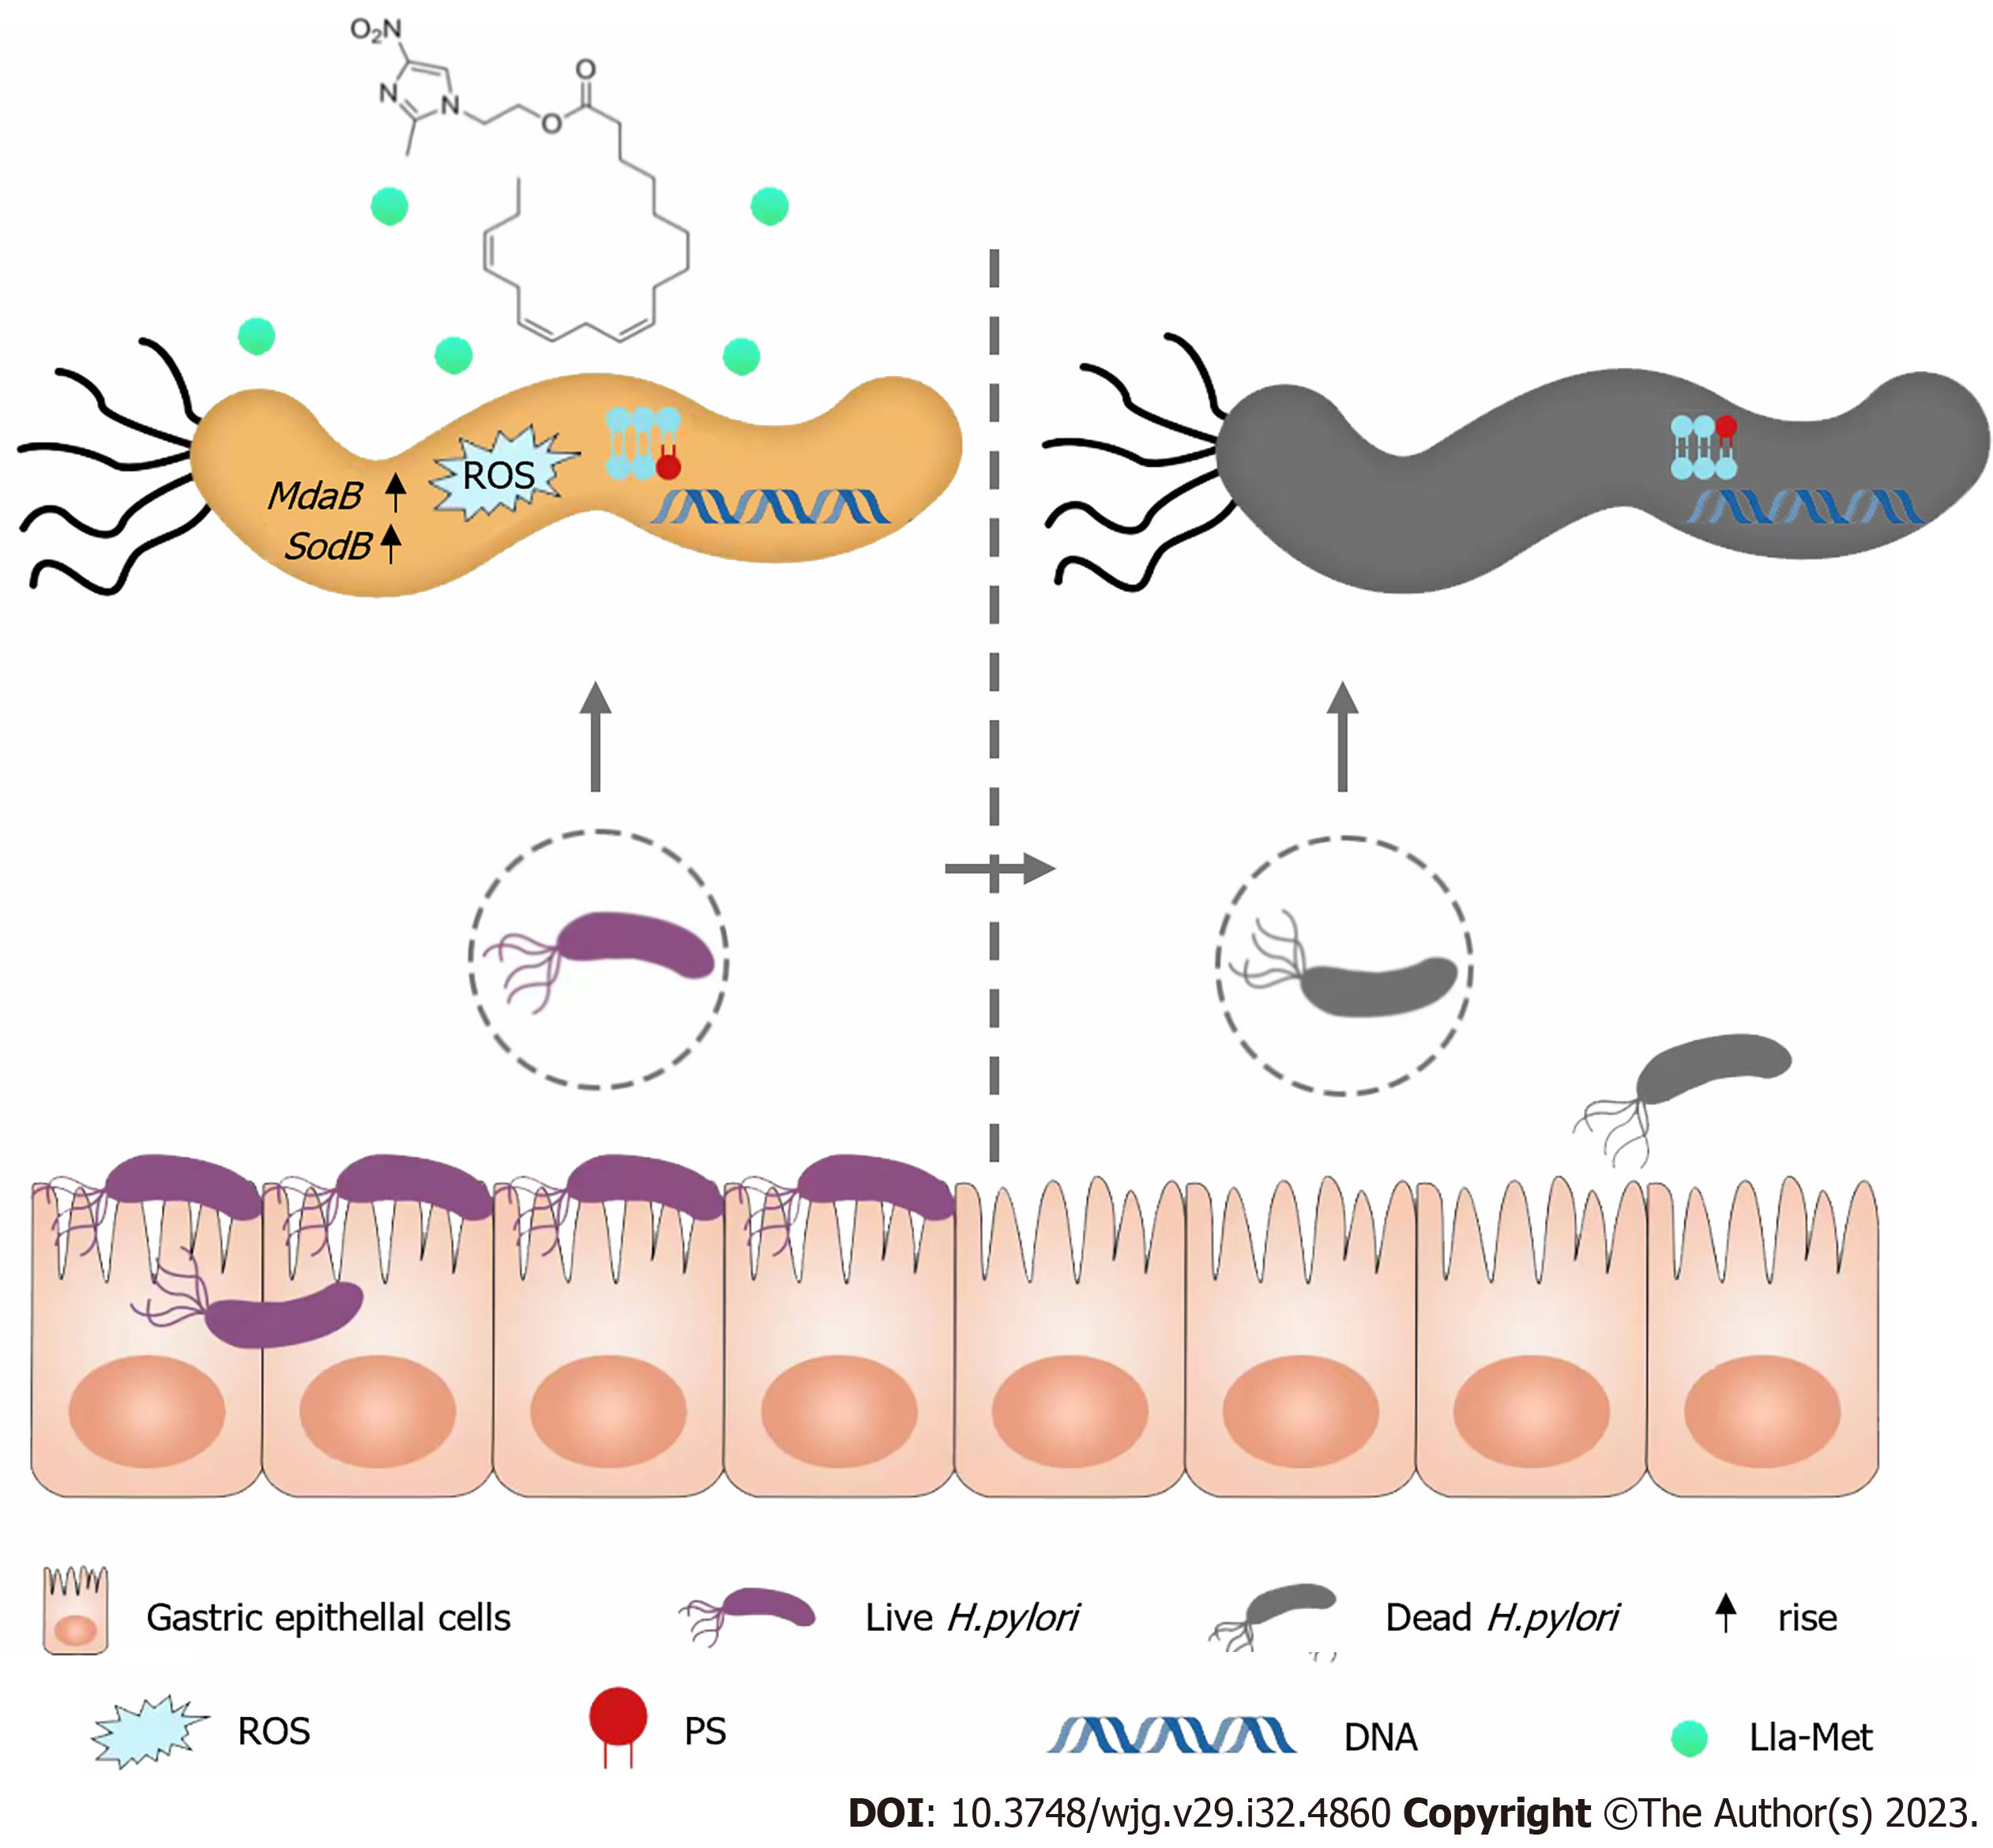
Figure 7 Hypothesized model of the mechanism of linolenic acid-metronidazole against Helicobacter pylori.
ROS: Reactive oxygen species; PS: Phosphatidylserine; Lla-Met: Linolenic acid-metronidazole; H. pylori: Helicobacter pylori.
- Citation: Zhou WT, Dai YY, Liao LJ, Yang SX, Chen H, Huang L, Zhao JL, Huang YQ. Linolenic acid-metronidazole inhibits the growth of Helicobacter pylori through oxidation. World J Gastroenterol 2023; 29(32): 4860-4872
- URL: https://www.wjgnet.com/1007-9327/full/v29/i32/4860.htm
- DOI: https://dx.doi.org/10.3748/wjg.v29.i32.4860


